. 2018 Aug;46(8):1146-1156.
doi: 10.1124/dmd.118.081398. Epub 2018 Jun 1.

Regulation of Cytosolic Sulfotransferases in Models of Human Hepatocyte Development

Affiliations

Regulation of Cytosolic Sulfotransferases in Models of Human Hepatocyte Development

Sarah Dubaisi et al. Drug Metab Dispos. 2018 Aug.

Abstract

Cytosolic sulfotransferases (SULTs) are expressed during early life and therefore metabolize endogenous and xenobiotic chemicals during development. Little is currently known about the regulation of individual SULTs in the developing human liver. We characterized SULT expression in primary cultures of human fetal hepatocytes and the HepaRG model of liver cell differentiation. SULT1A1 (transcript variants 1-4), SULT1C2, SULT1C4, SULT1E1, and SULT2A1 were the most abundant transcripts in human fetal hepatocytes. In HepaRG cells, SULT1B1, SULT1C2/3/4, and SULT1E1 mRNA levels increased during the transition from proliferation to confluency and then decreased as the cells underwent further differentiation. By contrast, SULT2A1 mRNA levels increased during differentiation, whereas SULT1A1 and SULT2B1 mRNA levels remained relatively constant. The temporal patterns of SULT1C2, SULT1E1, and SULT2A1 protein content were consistent with those observed at the mRNA level. To identify regulators of SULT expression, cultured fetal hepatocytes and HepaRG cells were treated with a panel of lipid- and xenobiotic-sensing receptor activators. The following effects were observed in both fetal hepatocytes and HepaRG cells: 1) liver X receptor activator treatment increased SULT1A1 transcript variant 5 levels; 2) vitamin D receptor activator treatment increased SULT1C2 and SULT2B1 mRNA levels; and 3) farnesoid X receptor activator treatment decreased SULT2A1 expression. Activators of aryl hydrocarbon receptor, constitutive androstane receptor, pregnane X receptor, and peroxisome proliferator-activated receptors produced additional gene-dependent effects on SULT expression in HepaRG cells. These findings suggest that SULT-regulating chemicals have the potential to modulate physiologic processes and susceptibility to xenobiotic stressors in the developing human liver.


Figures

Fig. 1.
Fig. 1.
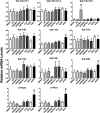
SULT, CYP3A4, and CYP3A7 expression in primary cultured human fetal hepatocytes. Freshly isolated hepatocytes from five fetal livers were incubated in medium containing 0.1% DMSO for 48 hours, after which the cells were harvested and SULT, CYP3A4, CYP3A7, and GAPDH (used as a normalization gene) mRNA levels were measured using TaqMan Gene Expression Assays. Each bar represents the mean relative mRNA level ± S.E.M. for the five independent experiments compared with SULT1C4, which had the highest expression of the SULTs. Relative CYP3A4 and CYP3A7 mRNA levels are shown for comparison.
Fig. 2.
Fig. 2.
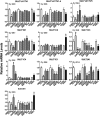
Effects of nuclear receptor agonists on SULT, CYP3A4, and CYP3A7 expression in primary cultured human fetal hepatocytes. Freshly isolated hepatocytes from five fetal livers were incubated in medium containing 0.1% DMSO, 0.1% ethanol (EtOH), 10 μM rifampicin (Rif), 10 μM GW3965, 10 μM GW4064, 10 μM GW7647, 1 μM rosiglitazone (Rosi), or 0.1 μM VitD3 for 48 hours, after which the cells were harvested and SULT, CYP3A4, CYP3A7, and GAPDH (used as a normalization gene) mRNA levels were measured. Each bar represents the mean relative mRNA level ± S.E.M. compared with control (0.1% ethanol for VitD3; 0.1% DMSO for other agonists) for the five independent experiments. *Significantly different from control, P < 0.05.
Fig. 3.
Fig. 3.
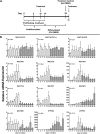
Temporal expression of SULTs, CYP3A4, and CYP3A7 in HepaRG cells. (A) HepaRG differentiation protocol showing proliferating, confluent, and differentiated phases and the times when treatments were begun. (B) HepaRG cells were plated (day 0) and harvested on the indicated days for the measurement of mRNA levels. mRNA levels were normalized to the levels measured on day 2 (i.e., first harvest day). The data show the expression patterns of eight cytosolic SULTs as well as CYP3A4 and CYP3A7 from the proliferative to the confluent phase (open bars) and then through the differentiation phase (gray bars). The Ct values for the various genes measured on day 14 (i.e., the time of highest expression for several of the genes) are shown on the graphs as estimations of their relative expression levels. Data were normalized to GAPDH and are shown as the mean ± S.E.M. from three independent experiments. *Significantly different from day 14 mRNA level, P < 0.05.
Fig. 4.
Fig. 4.
SULT1C2, SULT1E1, and SULT2A1 immunoreactive protein levels in HepaRG cells harvested at different time points. HepaRG cells were plated (day 0) and harvested on the indicated days for the measurement of SULT1C2, SULT1E1, and SULT2A1 protein levels by Western blot analysis. β-actin was used as the loading control. The images shown are from one representative experiment. For each protein, the last lane contains a standard consisting of whole-cell lysate prepared from SULT cDNA-transfected human embryonic kidney 293 (HEK293) cells [empty vector (EV)–transfected HEK293 cells]. Band densities were quantified using ImageJ, and data are shown normalized to the protein levels measured at day 5. Each bar represents the mean ± S.E.M. from three independent experiments. *Significantly different from day 14 (P < 0.05).
Fig. 5.
Fig. 5.
Effects of lipid- and xenobiotic-sensing receptor activators on SULT mRNA levels in confluent HepaRG cells. Ten days after plating, confluent HepaRG cells were incubated in treatment medium containing 0.1% DMSO, 0.1% ethanol, 0.01 µM TCDD, 1 μM CITCO, 10 μM rifampicin (Rif), 10 μM GW3965, 1 μM GW4064, 50 µM CDCA, 10 μM GW7647, 10 μM rosiglitazone (Rosi), or 0.1 μM VitD3 for 48 hours, after which cells were harvested and SULT and TATA-box binding protein (used as normalization gene) mRNA levels were measured. Each bar represents the mean relative mRNA level ± range (for rosiglitazone treatment only) or S.E.M. compared with control (0.1% ethanol for VitD3; 0.1% DMSO for all other agonists) for two (for rosiglitazone) or three independent experiments. *Significantly different from control, P < 0.05. Ct values for the various genes determined in DMSO-treated confluent HepaRG cells (from three independent experiments) as estimations of their relative expression levels.
Fig. 6.
Fig. 6.
Effects of lipid- and xenobiotic-sensing receptor activators on SULT mRNA levels in differentiated HepaRG cells. Four weeks after plating, differentiated HepaRG cells were incubated with treatment medium alone for 72 hours and then treatment medium containing 0.1% DMSO, 0.1% ethanol, 0.01 µM TCDD, 1 μM CITCO, 10 μM rifampicin (Rif), 10 μM GW3965, 1 μM GW4064, 50 µM CDCA, 10 μM GW7647, 10 μM rosiglitazone (Rosi), or 0.1 μM VitD3 for 48 hours, after which cells were harvested and SULT and TATA-box binding protein (used as a normalization gene) mRNA levels were measured. Each bar represents the mean relative mRNA level ± S.E.M. relative to control (0.1% ethanol for VitD3; 0.1% DMSO for all other agonists) from three independent experiments (except for SULT1A1/TV1 and SULT1A1TV1–4 for the CITCO, GW4064, CDCA, GW7647, and Rosi treatment groups, where each bar represents the mean ± range from two independent experiments). *Significantly different from control, P < 0.05. Ct values for the various genes determined in DMSO-treated differentiated HepaRG cells (from three independent experiments) as estimations of their relative expression levels.

References

    1. Allali-Hassani A, Pan PW, Dombrovski L, Najmanovich R, Tempel W, Dong A, Loppnau P, Martin F, Thornton J, Edwards AM, et al. (2007) Structural and chemical profiling of the human cytosolic sulfotransferases [published correction appears in PLoS Biol (2007) 5:e165]. PLoS Biol 5:e97. - PMC - PubMed
    1. Aninat C, Piton A, Glaise D, Le Charpentier T, Langouët S, Morel F, Guguen-Guillouzo C, Guillouzo A. (2006) Expression of cytochromes P450, conjugating enzymes and nuclear receptors in human hepatoma HepaRG cells. Drug Metab Dispos 34:75–83. - PubMed
    1. Barker EV, Hume R, Hallas A, Coughtrie WH. (1994) Dehydroepiandrosterone sulfotransferase in the developing human fetus: quantitative biochemical and immunological characterization of the hepatic, renal, and adrenal enzymes. Endocrinology 134:982–989. - PubMed
    1. Barrett KG, Fang H, Kocarek TA, Runge-Morris M. (2016) Transcriptional regulation of cytosolic sulfotransferase 1C2 by vitamin D receptor in LS180 human colorectal adenocarcinoma cells. Drug Metab Dispos 44:1431–1434. - PMC - PubMed
    1. Berger U, Wilson P, McClelland RA, Colston K, Haussler MR, Pike JW, Coombes RC. (1988) Immunocytochemical detection of 1,25-dihydroxyvitamin D receptors in normal human tissues. J Clin Endocrinol Metab 67:607–613. - PubMed

Publication types

LinkOut - more resources