

Identification of MOSPD2, a novel scaffold for endoplasmic reticulum membrane contact sites
- PMID: 29858488
- PMCID: PMC6030701
- DOI: 10.15252/embr.201745453
Identification of MOSPD2, a novel scaffold for endoplasmic reticulum membrane contact sites
Abstract
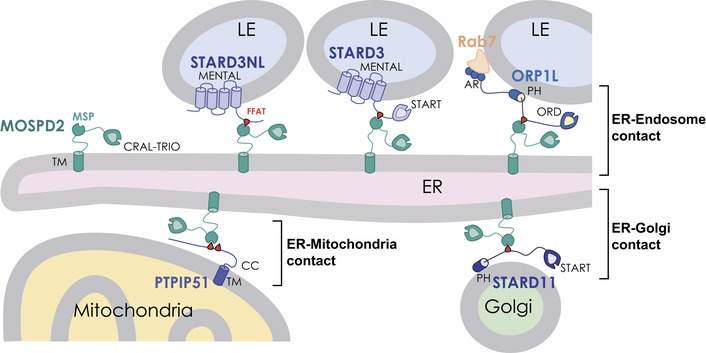
Membrane contact sites are cellular structures that mediate interorganelle exchange and communication. The two major tether proteins of the endoplasmic reticulum (ER), VAP-A and VAP-B, interact with proteins from other organelles that possess a small VAP-interacting motif, named FFAT [two phenylalanines (FF) in an acidic track (AT)]. In this study, using an unbiased proteomic approach, we identify a novel ER tether named motile sperm domain-containing protein 2 (MOSPD2). We show that MOSPD2 possesses a Major Sperm Protein (MSP) domain which binds FFAT motifs and consequently allows membrane tethering in vitro MOSPD2 is an ER-anchored protein, and it interacts with several FFAT-containing tether proteins from endosomes, mitochondria, or Golgi. Consequently, MOSPD2 and these organelle-bound proteins mediate the formation of contact sites between the ER and endosomes, mitochondria, or Golgi. Thus, we characterized here MOSPD2, a novel tethering component related to VAP proteins, bridging the ER with a variety of distinct organelles.
Keywords: ER–organelle contact; FFAT motif; VAP proteins; endoplasmic reticulum; membrane contact site.
© 2018 The Authors. Published under the terms of the CC BY NC ND 4.0 license.
Figures
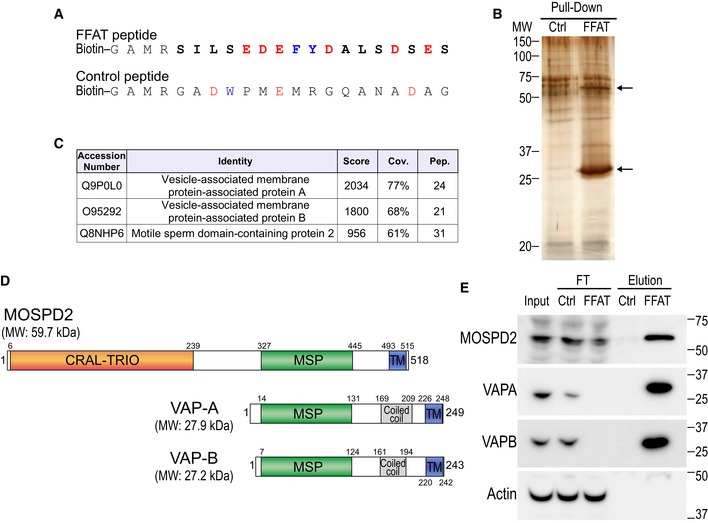
Sequence of the two peptides used for the pull‐down assay. The peptides are composed of an amino‐terminal biotin, a linker sequence and the FFAT sequence of ORP1 (FFAT peptide) or a random sequence (control peptide). The FFAT sequence of ORP1 is in bold and corresponds to residues 469–483 (Accession Number Q9BXW6‐1). Aromatic and acidic residues are in blue and red, respectively.
Silver nitrate staining of proteins pulled down using the control peptide (left) or the FFAT peptide (right), after SDS–PAGE. The two major differential bands are highlighted by arrows.
Tandem mass spectrometry result table showing the three top‐scored proteins identified in the FFAT peptide‐bound fraction. Score: protein score based on the sum of the ion scores of all peptides identified; Cov.: percentage of the protein sequence covered by identified peptides; Pep.: number of unique peptide sequences identified.
Schematic representation of MOSPD2, VAP‐A, and VAP‐B. Numbers correspond to the predicted positions of the beginning and the end of each domain. Calculated molecular weights (MW) of the proteins are shown.
Western blot analysis of proteins pulled down using the control (Ctrl) peptide (left), or the FFAT (FFAT) peptide (right). The input, FT (flow through), and elution fractions correspond to HeLa cell total protein extract, unbound proteins, and bound proteins, respectively. Representative illustration of at least two independent experiments.
- A
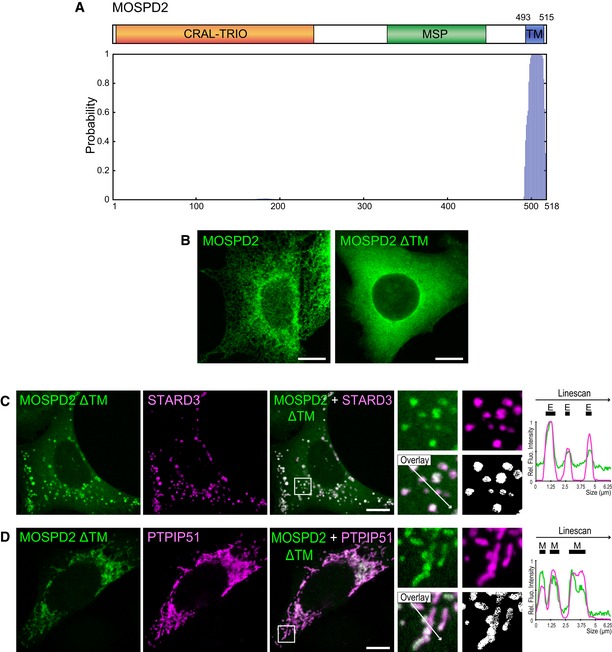
Top: Schematic representation of MOSPD2. Numbers indicate the positions of the first and the last residue of the putative transmembrane domain (blue box). Bottom: Determination of the number and position of transmembrane helices using TMHMM software 73. Vertical bars of the diagram represent the probability for a given amino acid to be included in a transmembrane helix. MOSPD2 is predicted to possess a single carboxyl‐terminus transmembrane helix.
- B
Localization of GFP‐MOSPD2 (left, green) and GFP‐MOSPD2 ΔTM (right, green) expressed in HeLa cells. The GFP‐MOSPD2 ΔTM protein is lacking the last 26 amino acids of MOSPD2, which include the transmembrane domain. Scale bars: 10 μm.
- C, D
Localization of GFP‐MOSPD2 ΔTM (green) and Flag‐STARD3 (C, magenta), or HA‐PTPIP51 (D, magenta), expressed in HeLa cells. The subpanels on the right are higher magnification (3.5×) images of the area outlined in white. The Overlay panel shows merged green and magenta images. The Coloc panel displays a colocalization mask on which pixels where the green and the magenta channels co‐localize are shown in white. Right: Linescan analyses with fluorescence intensities of the green and magenta channels along the white arrow shown on the subpanel Overlay. Black rectangles indicate the positions of late endosomes (E) and mitochondria (M). Scale bars: 10 μm.
- A, B
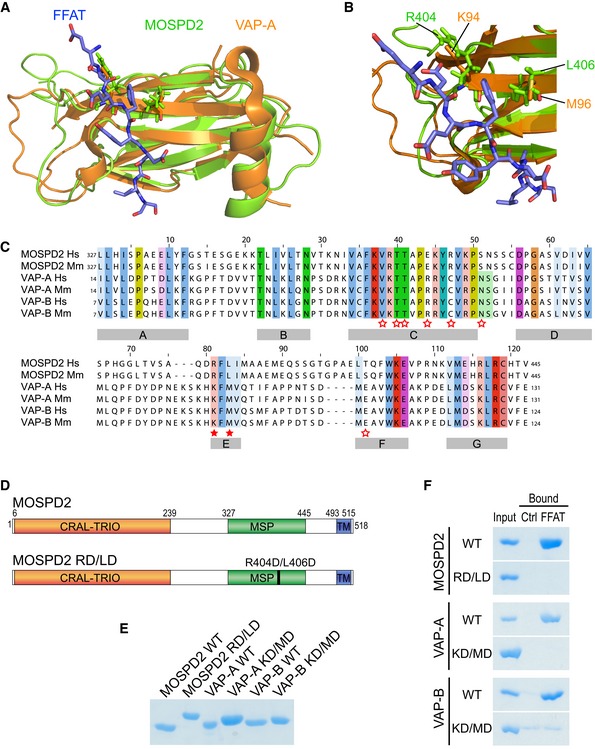
(A) Structural alignment of the MSP domains of MOSPD2 (PDB ID: 1WIC; green) and VAP‐A in complex with the FFAT motif of ORP1 (PDB ID: 1Z9O; orange). The FFAT peptide is in blue. (B) FFAT‐MSP binding interface: the critical residues K94, M96 in VAP‐A, and R404, L406 in MOSPD2 are shown as sticks.
- C
Sequence alignment of the MSP domains of MOSPD2, VAP‐A, and VAP‐B from human (Hs) and mouse (Mm). Numbers refer to amino acid positions. Red stars indicate the position of residues interacting with the FFAT motif in VAP‐A 27. Filled stars indicate the position of the two critical residues in VAP proteins (K94 and M96 in VAP‐A; K87 and M89 in VAP‐B) for FFAT interaction. Subregions with high homology between the three proteins are indicated with gray boxes (A–G).
- D
Schematic representation of MOSPD2 showing the position of the RD/LD mutation of the MSP domain.
- E
Coomassie blue staining of recombinant wild‐type and mutant MSP domains of MOSPD2, VAP‐A, and VAP‐B on SDS–PAGE. Note that the mutant MSP domains of MOSPD2, VAP‐A, and VAP‐B displayed a slowed migration, likely resulting from the negative charges introduced by the mutations.
- F
Coomassie blue staining of proteins pulled down with the control or the FFAT peptide. Representative illustration of at least two independent experiments.
- A–H
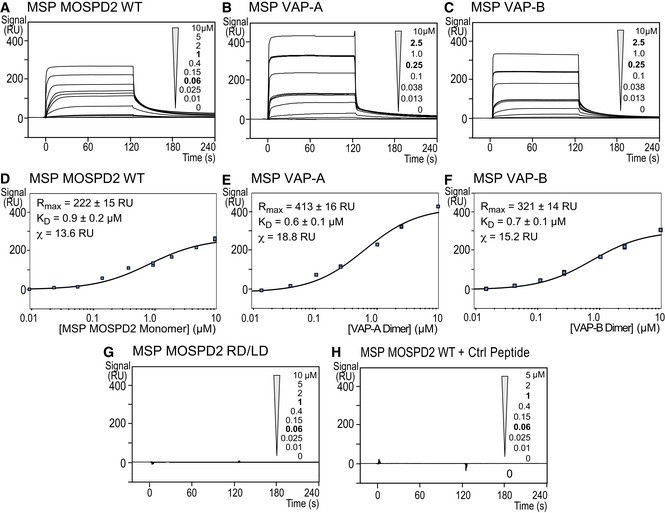
Surface plasmon resonance analysis of the MSP domain of MOSPD2, VAP‐A, or VAP‐B binding onto immobilized FFAT peptide. Representative sensorgrams resulting from the interaction between the MSP domain of MOSPD2 (A), VAP‐A (B), or VAP‐B (C) injected at different concentrations, and the FFAT peptide. No binding was detected when the RD/LD mutant MSP domain of MOSPD2 was injected onto the FFAT peptide (G), or when the wild‐type MSP domain of MOSPD2 was injected onto the immobilized control peptide (H). Binding curves display the SPR signal (RU) as a function of time. Concentrations printed in bold indicate samples measured three times. Samples with no protein (0 μM concentration) were measured two times. (D) Steady‐state analysis of the FFAT peptide/MSP domain of MOSPD2 interaction: Equilibrium responses (R eq) extracted from panel (A) were plotted as a function of the MSP domain of MOSPD2 concentration, and fitted with a 1:1 binding model. (E, F) Steady‐state analysis of the FFAT peptide/MSP domain of VAP‐A (E) or VAP‐B (F) interaction: equilibrium responses (R eq) extracted from panel (A) were plotted as a function of dimeric VAP concentration and fitted with a 1:1 binding model.
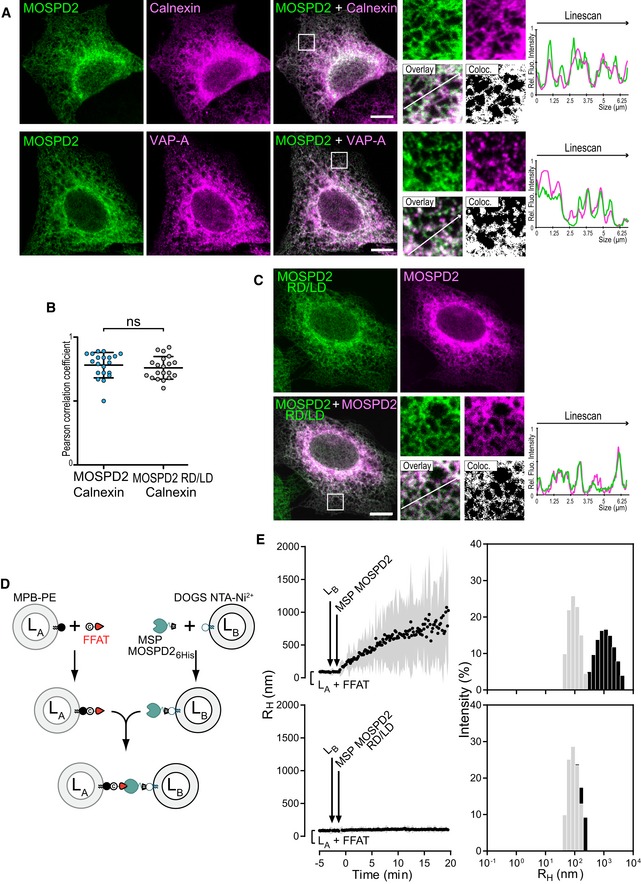
HeLa/GFP‐MOSPD2 cells were labeled with anti‐Calnexin antibodies (top; magenta) or with anti‐VAP‐A antibodies (bottom; magenta).
Pearson correlation coefficients between GFP‐MOSPD2 and Calnexin (left) or GFP‐MOSPD2 RD/LD and Calnexin (right) staining are shown. Each dot represents a single cell (20 cells from three independent experiments). Means and error bars (SD) are shown. Mann–Whitney test.
HeLa cells co‐expressing GFP‐MOSPD2 RD/LD (green) and mCherry‐MOSPD2 (magenta).
Description of the liposome aggregation assay experimental strategy. LA liposomes are decorated with an FFAT peptide owing to covalent links with MPB‐PE lipids, and mixed with LB liposomes covered by 6His‐tagged MOSPD2 MSP domain attached to DOGS‐NTA‐Ni2+.
Aggregation assays in real time. LA liposomes (50 μM total lipids) decorated with conventional FFAT peptide (380 nM) were mixed with LB liposomes (50 μM total lipids) covered with the wild‐type (top; 760 nM) or the RD/LD mutant (bottom; 760 nM) MSP domain of MOSPD2. Aggregation was followed by dynamic light scattering (DLS). Left panels: mean radius (black dots) and polydispersity (shaded area) over time. Right panels: size distribution before (gray bars) and after (black bars) the reaction. Representative illustration of at least three independent experiments.
- A
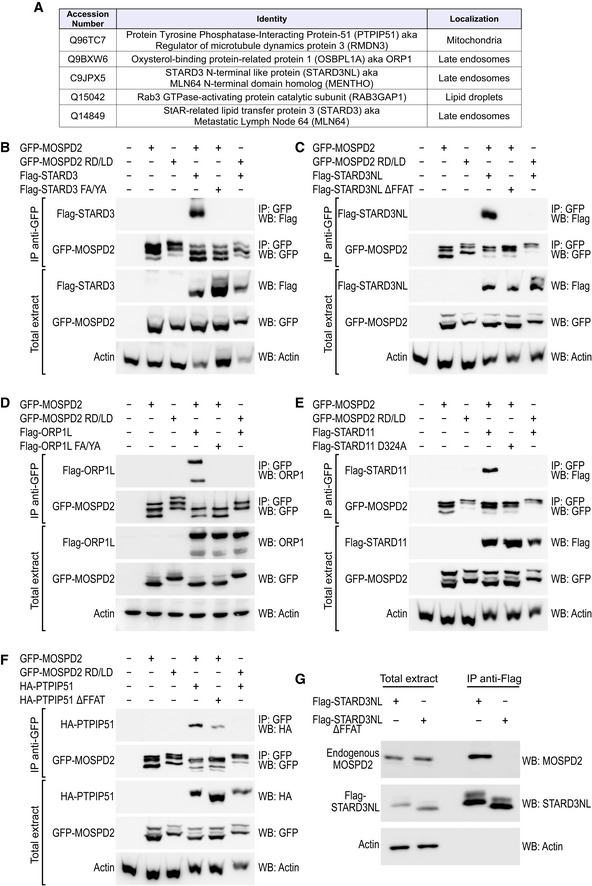
List of the five top‐scored proteins interacting with MOSPD2 and known to contain a FFAT motif (see Appendix Table S1 for the full list). Proteins co‐precipitated with GFP‐MOSPD2 and GFP‐MOSPD2 RD/LD proteins were identified by mass spectrometry; proteins were filtered for their ability to bind MOSPD2 and not the RD/LD mutant. The subcellular localization of the proteins is indicated 53, 65, 66, 67, 68, 69.
- B–F
Immunoprecipitation (GFP‐Trap) experiments between GFP‐MOSPD2 (WT and RD/LD mutant) and Flag‐tagged STARD3 (B), STARD3NL (C), ORP1L (D), STARD11 (E), and HA‐tagged PTPIP51 (F) (WT and FFAT‐deficient). Approximatively 5 μg of total protein extracts was analyzed by Western blot using anti‐Flag (B, C, E), anti‐ORP1 (D), anti‐HA (F), anti‐GFP (B–F), and anti‐actin (B–F) antibodies. Immunoprecipitated material was analyzed using anti‐Flag (B, D–F) or anti‐ORP1 (C), and anti‐GFP (B–F) antibodies.
- G
Immunoprecipitation (anti‐Flag) experiment between Flag‐tagged STARD3NL (WT and FFAT‐deficient) and endogenous MOSPD2. Proteins extracts and immunoprecipitated material were analyzed by Western blot using anti‐MOSPD2, anti‐STARD3NL, and anti‐actin antibodies.
- A
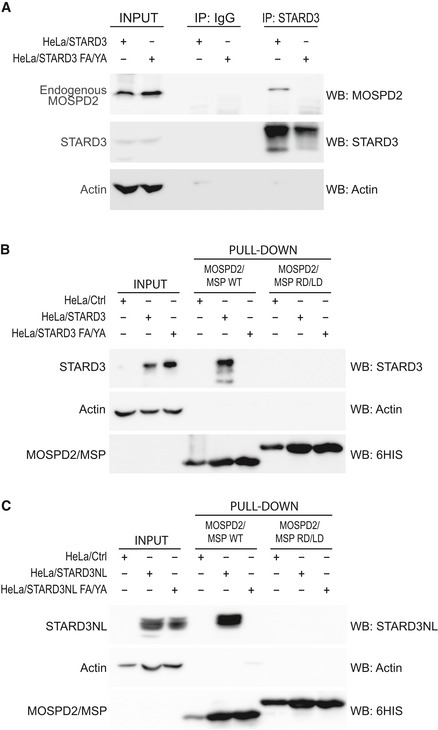
Immunoprecipitation experiment between STARD3 (WT and FFAT‐deficient) and endogenous MOSPD2. Proteins were immunoprecipitated using anti‐STARD3 antibodies or control IgG. Protein extracts and immunoprecipitates were analyzed by Western blot using anti‐MOSPD2, anti‐STARD3, and anti‐actin antibodies.
- B, C
Interaction of STARD3 (B), or STARD3NL (C), with the recombinant MSP domain of MOSPD2. The WT and the RD/LD mutant MSP domain of MOSPD2 were bound to a Ni2+‐NTA resin and used in a pull‐down assay with protein extracts of control (HeLa/Ctrl), STARD3, and STARD3 FA/YA FFAT‐defective mutant (B), and STARD3NL and STARD3NL FA/YA FFAT‐defective mutant (C) expressing cells. Total and bound proteins were analyzed by Western blot using anti‐STARD3 (B), anti‐STARD3NL (C), anti‐HIS tag (B and C), and anti‐actin (B and C).
- A
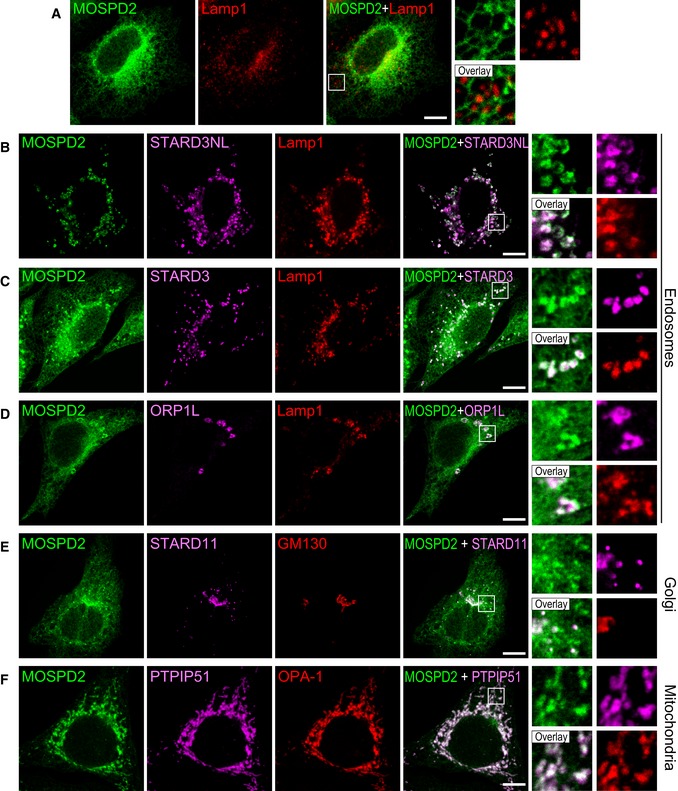
GFP‐MOSPD2 (green)‐expressing cells were stained with an anti‐Lamp1 antibody (red) to label late endosomes/lysosomes.
- B–F
GFP‐MOSPD2 (green)‐expressing cells were transfected with Flag‐STARD3NL (B), Flag‐STARD3 (C), Flag‐ORP1L (D), Flag‐STARD11 (E), or HA‐PTPIP51 (F), and labeled using anti‐Flag (B–E; magenta), anti‐HA (F: magenta), and anti‐Lamp1 (B–D; red), GM130 (E; red), or OPA‐1 (F; red) as markers of late endosomes/lysosomes, Golgi, and mitochondria, respectively.
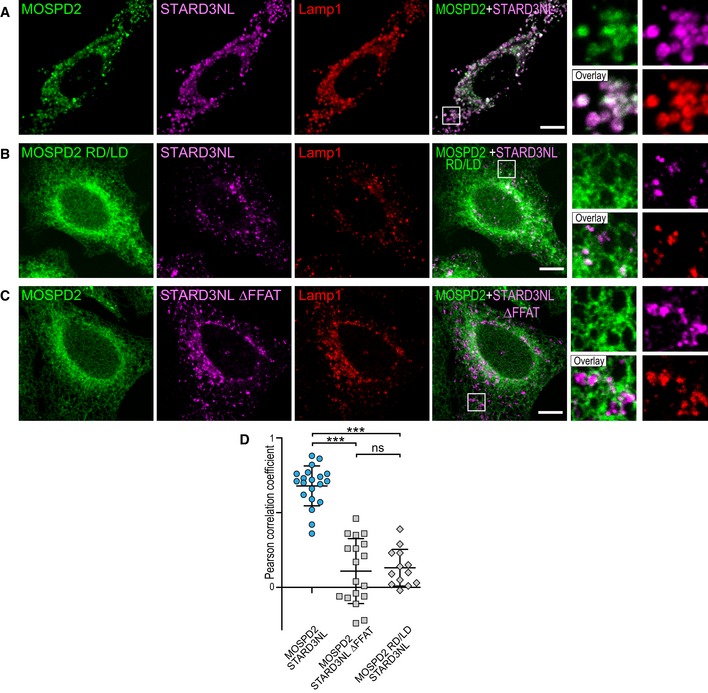
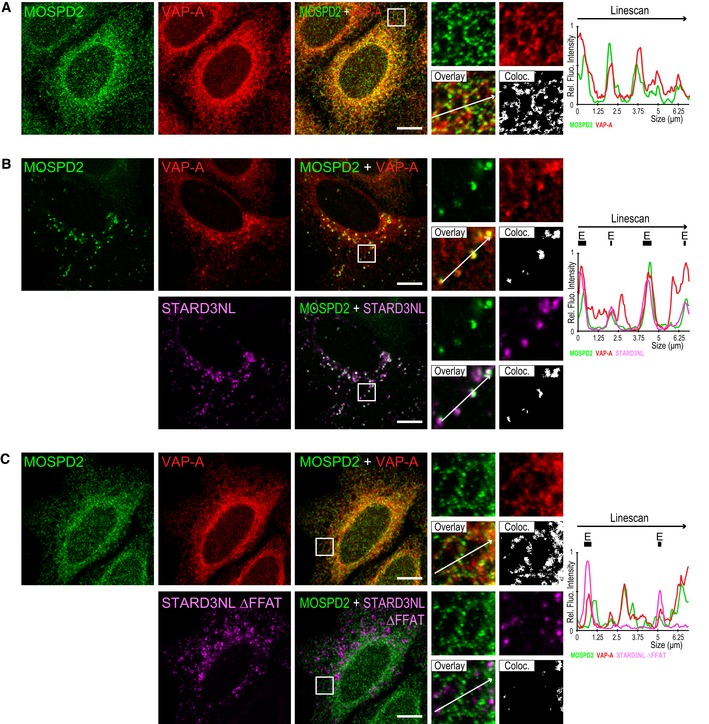
- A–C
GFP‐MOSPD2‐ (A and C) and GFP‐MOSPD2 RD/LD‐expressing cells (B) were transfected with Flag‐STARD3NL (A and B), or Flag‐STARD3NL ΔFFAT (C), and labeled using anti‐Flag (magenta) and anti‐Lamp1 (late endosomes/lysosomes marker; red) antibodies. The subpanels on the right are higher magnification (3.5×) images of the area outlined in white. The Overlay panel shows merged green and magenta images. Scale bars: 10 μm.
- D
Pearson's correlation coefficients between MOSPD2 (WT or RD/LD mutant) and STARD3NL (WT or ΔFFAT) staining are shown. Each dot represents a single cell (number of cells: MOSPD2–STARD3NL: 20; MOSPD2–STARD3NL ΔFFAT: 18; MOSPD2 RD/LD–STARD3NL: 13, from three independent experiments). Means and error bars (SD) are shown. Kruskal–Wallis with Dunn's multiple comparison test (***P < 0.001).
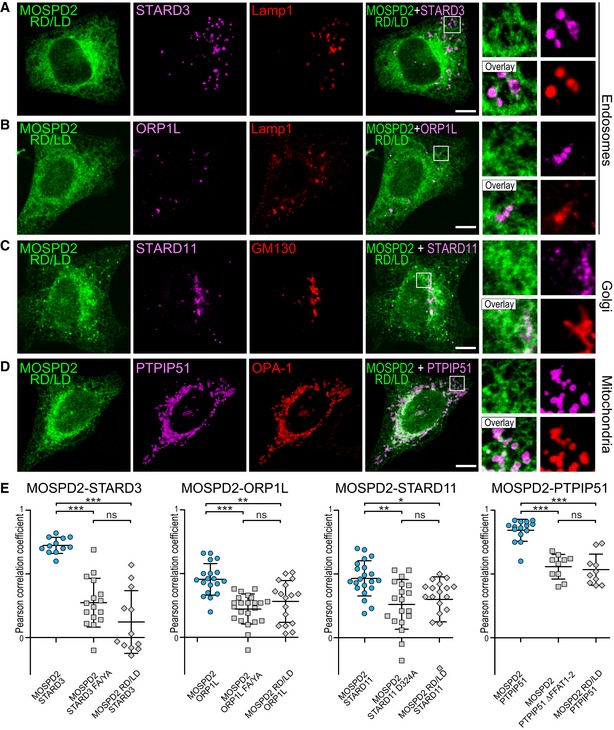
- A–D
GFP‐MOSPD2 RD/LD (green)‐expressing cells were transfected with Flag‐STARD3 (A), Flag‐ORP1L (B), Flag‐STARD11 (C), or HA‐PTPIP51 (D), and labeled using anti‐Flag (A–C; magenta), anti‐HA (D: magenta), and anti‐Lamp1 (A and B; red), GM130 (C; red), or OPA‐1 (D; red), as markers of late endosomes/lysosomes, Golgi, and mitochondria, respectively. The subpanels on the right are higher magnification (3.5×) images of the area outlined in white. The Overlay panel shows merged green and magenta images. Scale bars: 10 μm.
- E
Pearson correlation coefficients between MOSPD2 (WT or RD/LD mutant) and STARD3 (WT or FA/YA), ORP1L (WT or FA/YA), STARD11 (WT or D324A), and PTPIP51 (WT or ΔFFAT 1–2) staining are shown. Each dot represents a single cell from three independent experiments (number of cells: MOSPD2–STARD3: 12; MOSPD2–STARD3 FA/YA: 16; MOSPD2 RD/LD–STARD3: 12; MOSPD2–ORP1L: 19; MOSPD2–ORP1L FA/YA: 23; MOSPD2 RD/LD–ORP1L: 17; MOSPD2–STARD11: 21; MOSPD2–STARD11 D324A: 19; MOSPD2 RD/LD–STARD11: 18; MOSPD2–PTPIP51: 15; MOSPD2–PTPIP51 ΔFFAT 1–2: 10; MOSPD2 RD/LD–PTPIP51: 10). Means and error bars (SD) are shown. Kruskal–Wallis with Dunn's multiple comparison test (*P‐values < 0.05; **P < 0.01; ***P < 0.001).
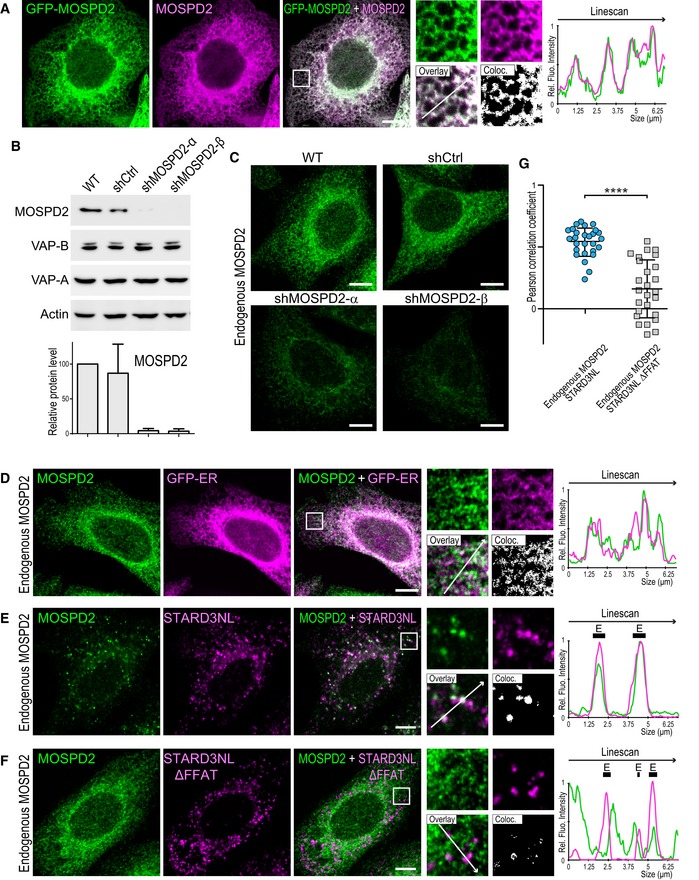
- A
GFP‐tagged MOSPD2 (green)‐expressing cells were labeled with an anti‐MOSPD2 antibody (magenta). The superposition of the green and magenta signals indicates that the anti‐MOSPD2 antibody recognized efficiently MOSPD2 by immunofluorescence.
- B
Western blot analysis of MOSPD2 and VAP proteins in control HeLa cells (WT) and in HeLa cells expressing a control shRNA (shCtrl) and two individual shRNAs targeting MOSPD2 (shMOSPD2‐α or shMOSPD2‐β). Quantification of MOSPD2 protein level is shown below. Means and error bars (SD) are shown. n: Three independent experiments.
- C
Endogenous MOSPD2 (green) was labeled in control HeLa cells (WT), in cells expressing a control shRNA (shCtrl), and in cells expressing two individual shRNAs targeting MOSPD2 (shMOSPD2‐α or shMOSPD2‐β). Scale bar: 10 μm.
- D
Endogenous MOSPD2 (green) staining in HeLa cells expressing the ER marker GFP‐ER (magenta).
- E, F
Endogenous MOSPD2 (green) staining in HeLa cells expressing Flag‐STARD3NL (E) or Flag‐STARD3NL ΔFFAT (F) (anti‐Flag; magenta).
- G
Pearson's correlation coefficients between endogenous MOSPD2 and Flag‐STARD3NL (WT or ΔFFAT) staining are shown. Each dot represents a single cell (number of cells: MOSPD2–Flag‐STARD3NL: 27; MOSPD2–Flag‐STARD3NL ΔFFAT: 26; from three independent experiments). Means and error bars (SD) are shown. Mann–Whitney test (two‐tailed P‐value; ****P < 0.0001).
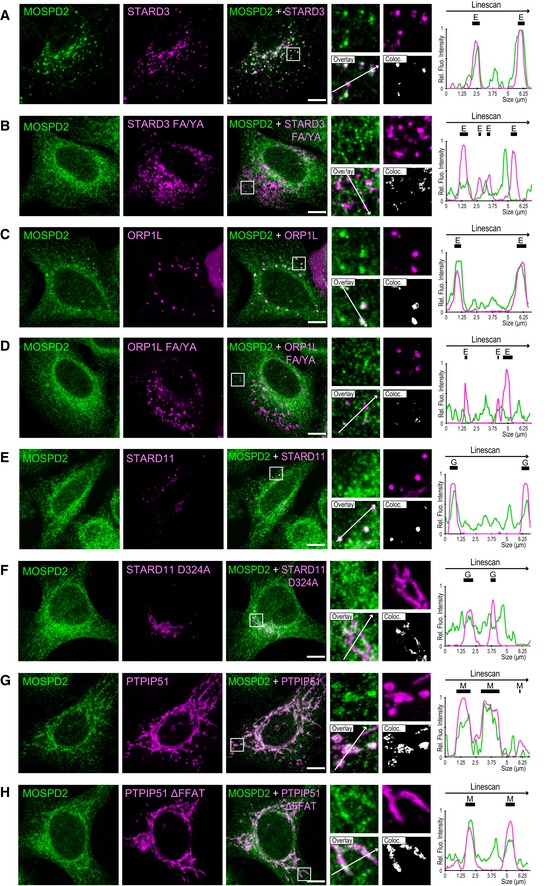
- A–H
Endogenous MOSPD2 (green) staining in HeLa cells expressing Flag‐STARD3 (A), Flag‐STARD3 FA/YA (B), GFP‐ORP1L (C), GFP‐ORP1L FA/YA (D), Flag‐STARD11 (E), Flag‐STARD11 D324A (F), HA‐PTPIP51 (G), or HA‐PTPIP51 ΔFFAT (H) (magenta). Endogenous MOSPD2 was recruited around endosomes, Golgi, and mitochondria by STARD3 and ORP1L, STARD11 and PTPIP51, respectively. FFAT‐deficient STARD3, ORP1L, STARD11, and PTPIP51 mutants did not recruit endogenous MOSPD2. Note that in agreement with immunoprecipitation assays (Fig 5F), PTPIP51 ΔFFAT retained a partial ability to recruit MOSPD2. The subpanels on the right are higher magnification (3.5×) images of the area outlined in white. The Overlay panel shows merged green and magenta images. The Coloc panel displays a co‐localization mask on which pixels where the green and the magenta channels co‐localize are shown in white. Right: Linescan analyses with fluorescence intensities of the green and magenta channels along the white arrow shown on the subpanel Overlay. Black rectangles indicate the positions of late endosomes (E), Golgi stacks (G), and mitochondria (M). Scale bars: 10 μm.
- A
HeLa cells were labeled with anti‐MOSPD2 (green) and anti‐VAP‐A (red) antibodies.
- B, C
HeLa cells expressing Flag‐STARD3NL (B) or Flag‐STARD3NL ΔFFAT (C) were labeled with anti‐MOSPD2 (green), anti‐VAP‐A (red), and anti‐Flag (magenta) antibodies.
- A
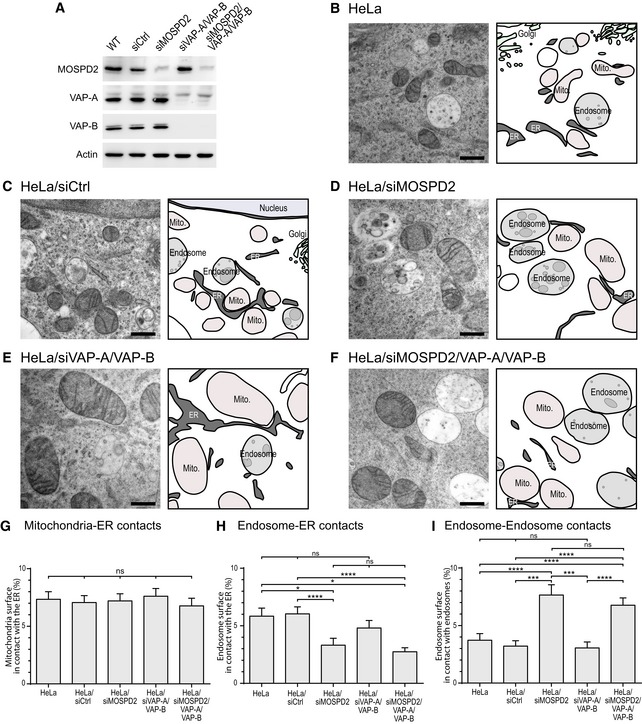
Western blot analysis of MOSPD2, VAP‐A, and VAP‐B proteins in control HeLa cells (WT) and in HeLa cells transfected with a control siRNA (siCtrl), and with siRNA targeting MOSPD2 (siMOSPD2), VAP‐A, and VAP‐B (siVAP‐A/VAP‐B), and MOSPD2, VAP‐A, and VAP‐B (siMOSPD2/VAP‐A/VAP‐B).
- B–F
TEM images of control HeLa cells (B: HeLa; C: HeLa/siCtrl) and MOSPD2 (D: siMOSPD2), VAP‐A, and VAP‐B (E: siVAP‐A/VAP‐B), and MOSPD2‐, VAP‐A‐, and VAP‐B (F: siMOSPD2/VAP‐A/VAP‐B)‐silenced HeLa cells. An interpretation scheme representing contacts between organelles is shown on the right; the ER, endosomes, and ILV are in dark, light, and medium gray, respectively. Mitochondria and Golgi are in pink and light green, respectively. Scale bars: 500 μm.
- G–I
Quantification by stereology of ER–mitochondria (G), ER–endosome (H), and endosome–endosome (I) contacts. The percentages of mitochondria perimeter in contact with the ER (G), endosome perimeter in contact with the ER (H), and endosome perimeter in contact with an endosome (I) are shown as means and error bars (SEM). (G) 200 (HeLa), 208 (siCtrl), 199 (siMOSPD2), 202 (siVAP‐A/VAP‐B), 199 (siMOSPD2/VAP‐A/VAP‐B) mitochondria from 8, 10, 8, 12, and 12 cells, respectively, were analyzed. (H, I) 202 (HeLa), 189 (siCtrl), 148 (siMOSPD2), 141 (siVAP‐A/VAP‐B), 221 (siMOSPD2/VAP‐A/VAP‐B) endosomes from 9, 19, 10, 14, and 12 cells, respectively, were analyzed. Kruskal–Wallis with Dunn's multiple comparison test (*P‐values < 0.05; ***P < 0.001; ****P < 0.0001).
References
-
- Gatta AT, Levine TP (2017) Piecing together the patchwork of contact sites. Trends Cell Biol 27: 214–229 - PubMed
-
- Holthuis JCM, Levine TP (2005) Lipid traffic: floppy drives and a superhighway. Nat Rev Mol Cell Biol 6: 209–220 - PubMed
-
- Eisenberg‐Bord M, Shai N, Schuldiner M, Bohnert M (2016) A tether is a tether is a tether: tethering at membrane contact sites. Dev Cell 39: 395–409 - PubMed
-
- Helle SCJ, Kanfer G, Kolar K, Lang A, Michel AH, Kornmann B (2013) Organization and function of membrane contact sites. Biochim Biophys Acta 1833: 2526–2541 - PubMed
Publication types
MeSH terms
Substances
LinkOut - more resources
Full Text Sources
Other Literature Sources
Molecular Biology Databases
Research Materials
