. 2018 Jun 1;9(1):2146.
doi: 10.1038/s41467-018-04450-y.

Mucosal-associated invariant T cells are a profibrogenic immune cell population in the liver

Affiliations

Mucosal-associated invariant T cells are a profibrogenic immune cell population in the liver

Pushpa Hegde et al. Nat Commun. .

Abstract

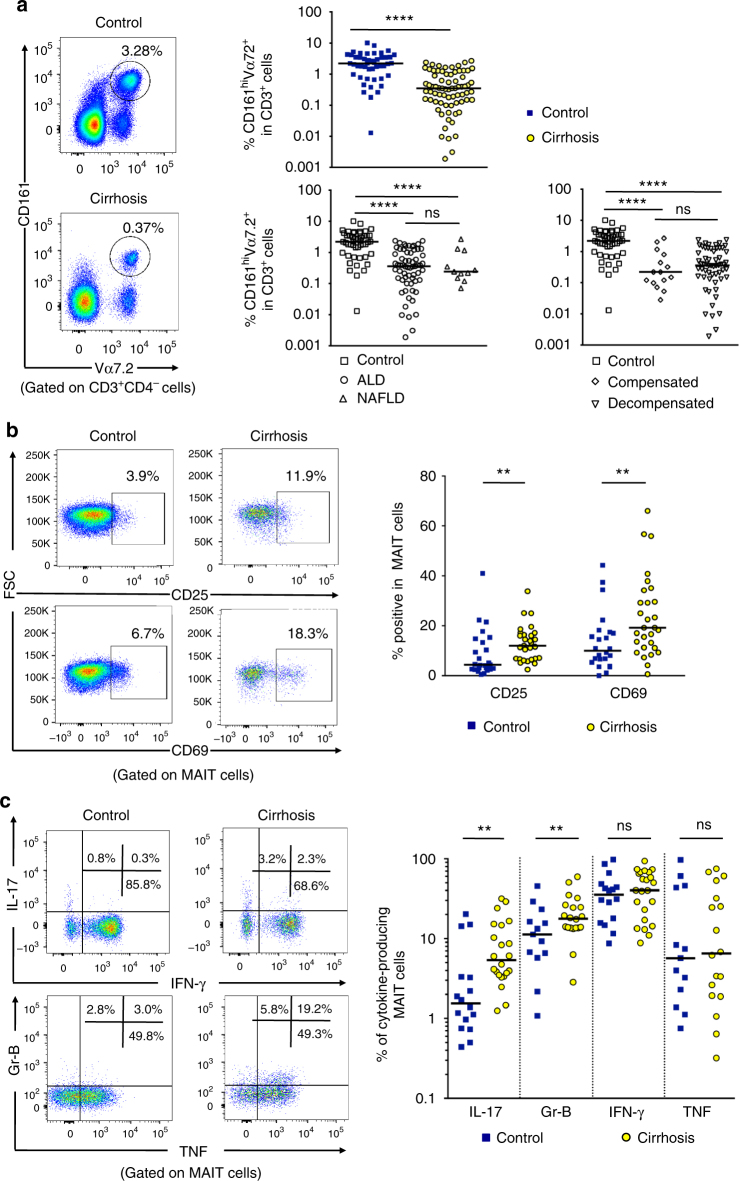
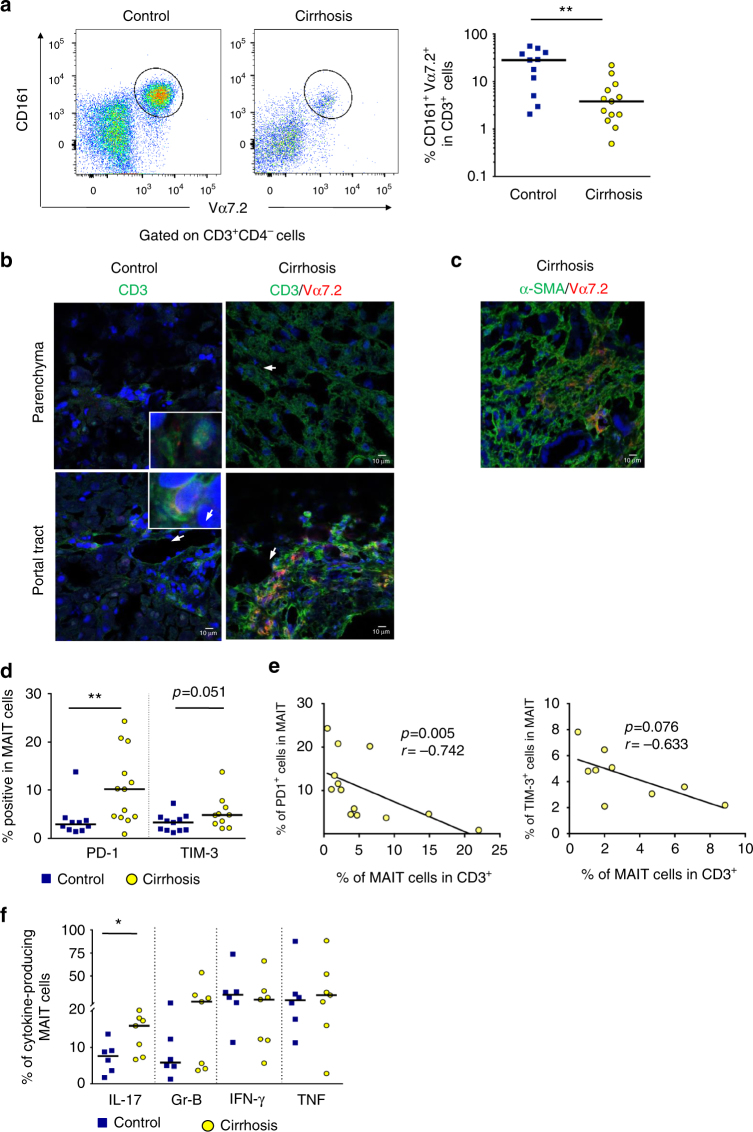
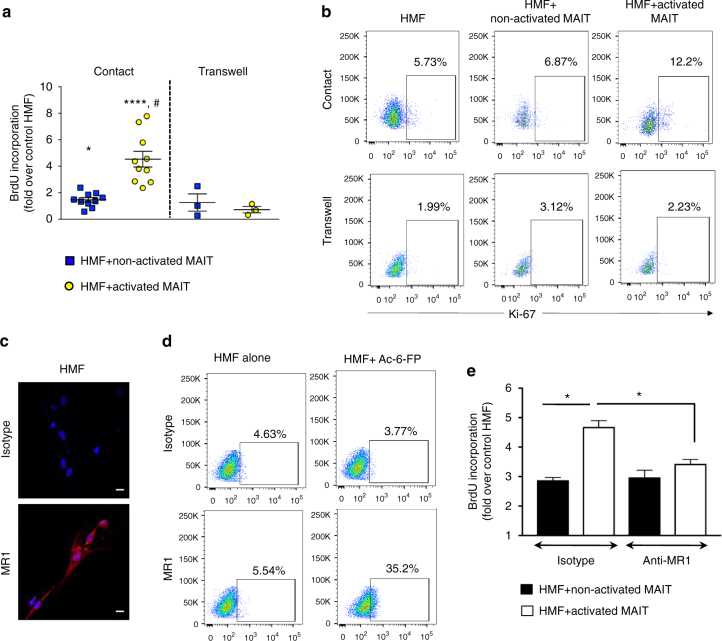
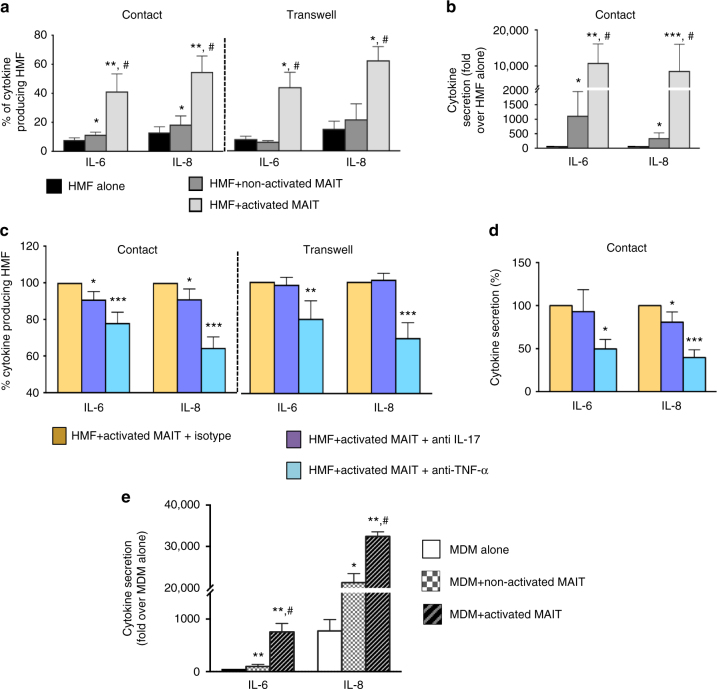
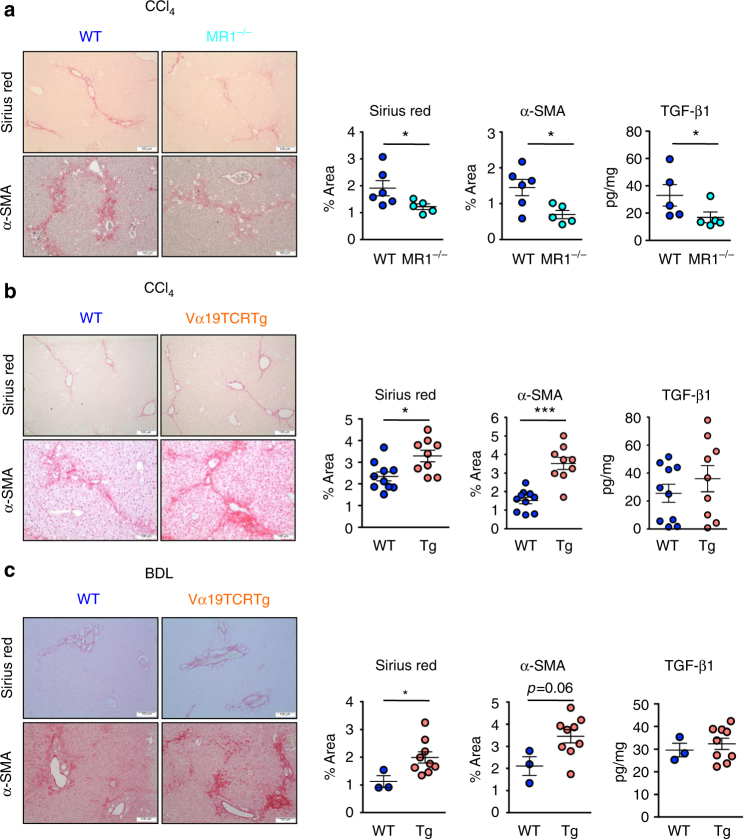
Liver fibrosis is the common response to chronic liver injury, and leads to cirrhosis and its complications. Persistent inflammation is a driving force of liver fibrosis progression. Mucosal-associated invariant T (MAIT) cells are non-conventional T cells that display altered functions during chronic inflammatory diseases. Here, we show that circulating MAIT cells are reduced in patients with alcoholic or non-alcoholic fatty liver disease-related cirrhosis while they accumulate in liver fibrotic septa. Using two models of chronic liver injury, we demonstrate that MAIT cell-enriched mice show increased liver fibrosis and accumulation of hepatic fibrogenic cells, whereas MAIT cell-deficient mice are resistant. Co-culture experiments indicate that MAIT cells enhance the proinflammatory properties of monocyte-derived macrophages, and promote mitogenic and proinflammatory functions of fibrogenic cells, via distinct mechanisms. Our results highlight the profibrogenic functions of MAIT cells and suggest that targeting MAIT cells may constitute an attractive antifibrogenic strategy during chronic liver injury.


Conflict of interest statement

The authors declare no competing interests.

Figures

Fig. 1
Fig. 1
Frequency and functions of circulating MAIT cells are impaired during cirrhosis. a Representative dot plots showing reduction of CD161hi Vα7.2+ double positive (MAIT) cells in PBMC and summary data from cirrhotic patients (n = 74), as compared to that in healthy donors (n = 47), and repartition of cirrhotic patients into disease etiology (alcoholic cirrhosis, n = 63 and NASH cirrhosis, n = 11) and severity (compensated cirrhosis, n = 15 and decompensated cirrhosis, n = 59). Representative dot plots and cumulative data of b increased surface expression of CD25 and CD69 on MAIT cells from healthy donors (n = 25) and cirrhotic patients (n = 29) and c cytokine profile of cirrhotic (n = 20–23) vs. healthy (n = 13–16) blood MAIT cells. Statistical analysis was performed using Mann–Whitney (a, b, c) or Kruskal–Wallis followed by Dunn’s post test analysis (a). **p ≤ 0.01; ****p ≤ 0.0001; ns p > 0.05
Fig. 2
Fig. 2
Frequency and functions of liver MAIT cells are impaired during cirrhosis. a Representative dot plots and summary data of CD161hi Vα7.2+ double positive cells (MAIT) in mononuclear cells isolated from cirrhotic (n = 13) and control (n = 11) liver tissues. b Representative images of CD3+Vα7.2+ double positive cells in liver tissue sections from control (n = 4) and cirrhotic (n = 6) livers, showing the preferential presence of CD3+ Vα7.2+  cells within the fibrotic septa, and no or discrete sinusoidal immunostaining, whereas discrete sinusoidal staining is observed in control livers, both in sinusoidal space and portal tract (n = 6, double stained cells are indicated by arrows). Scale bar = 10 μm. c Representative CD3+ Vα7.2+ double immunostaining of liver tissue sections from cirrhotic livers, showing their presence close to α-SMA positive cells. Scale bar = 10 μm. d Comparison of expression of PD-1 and TIM-3 on intrahepatic MAIT cells in control (n = 10–11) and cirrhotic livers (n = 13–10). e Correlation between intrahepatic MAIT frequency and the percentage of positive MAIT cells for PD-1 (n = 13) and TIM-3 (n = 9) in cirrhotic livers. f Representative dot plots and summary data of cytokine profile of cirrhotic (n = 7) vs. control (n = 6) intrahepatic MAIT cells. Statistical analysis was performed using Mann–Whitney (a, d, f) or Spearman correlation test (e). *p ≤ 0.05; **p ≤ 0.01
Fig. 3
Fig. 3
MAIT cells stimulate mitogenic functions of human hepatic myofibroblasts (HMF). a BrdU incorporation in hepatic myofibroblasts following direct and transwell co-cultures with either non-activated or activated MAIT cells. The results show the mean ± SEM of direct (n = 10) and transwell (n = 3) co-cultures, each performed with a different MAIT cell donor. b Representative dot plots showing the percentage of Ki-67+ hepatic myofibroblasts in direct and transwell co-culture with non-activated and activated MAIT cells by flow cytometry. c Representative immunofluorescence images showing expression of MR1 on hepatic myofibroblasts and no signal with control isotype. Similar results were obtained in three independent experiments. Scale bar = 10 μm. d Representative dot plots showing increased expression of MR1 on hepatic myofibroblast surface by flow cytometry, upon exposure to 1 μm Ac-6-FP. Three different cell cultures gave similar results. e DNA synthesis in hepatic myofibroblasts pretreated with MR1-neutralizing antibody or isotype, and co-cultured with either non-activated or activated MAIT cells. The results show a representative experiment and are the mean ± SEM of quadruplicate determinations. Similar results were obtained in three independent experiments with MAIT cells from three different donors (Supplementary Fig. 3b). Statistical analysis was determined using Mann–Whitney (a, e) or Kruskal–Wallis followed by Dunn’s post test analysis (a). *p ≤ 0.05; ****p ≤ 0.0001 vs. control HMF. #p ≤ 0.005 vs. HMF treated with non-activated MAIT cells
Fig. 4
Fig. 4
MAIT cells stimulate proinflammatory properties of human hepatic myofibroblasts. Analysis of intracellular cytokine production by human hepatic myofibroblasts a by FACS following direct (n = 8 experiments) or transwell (n = 6 experiments) co-cultured with either activated or non-activated MAIT cells; b by ELISA following direct co-cultures (n = 6 experiments). In each experiment, MAIT cells from different donors were used. c, d Analysis of intracellular cytokine production by human hepatic myofibroblasts co-cultured with activated or non-activated MAIT cells, following neutralization with 0.5 μg/ml of an IL-17-neutralizing antibody, 5 μg/ml of TNF-neutralizing antibody, or isotype. c FACS analysis (n = 6 experiments); d ELISA (n = 4 experiments). The results are expressed as the percentage of cytokine producing HMF in the presence of MAIT cells with neutralizing antibodies relative to those with isotype. e Analysis of IL-6 and IL-8 production by ELISA from monocyte-derived macrophages (MDM) upon direct co-culture with either activated or non-activated MAIT cells. The results show a representative experiment and are the mean ± SEM of sextuplicate determinations. Similar results were obtained in two independent co-culture experiments with both MAIT cells and MDM coming from two different donors (Supplementary Fig. 4b). Statistical significance was determined using Kruskal–Wallis followed by Dunn’s post test analysis (ae). Comparison of HMF alone and HMF with non-activated and activated MAIT cells was performed further by Mann–Whitney test (ae). *p ≤ 0.05; **p ≤ 0.01; ***p ≤ 0.001 vs. control HMF. #p ≤ 0.005 vs. HMF treated with non-activated MAIT cells
Fig. 5
Fig. 5
Profibrogenic properties of MAIT cells in vivo. Representative images and quantification of Sirius red and α-SMA areas, and hepatic TGF-β1 secretion in a MAIT cell-deficient (MR1−/−) mice (n = 5) and their WT littermates (n = 6) chronically administered with CCl4, b MAIT cell-enriched (Vα19TCRTg) mice (n = 9) and their WT littermates (n = 10) chronically exposed to CCl4 in two independent experiments (exp 1, n = 5 WT, n = 4 Tg; exp 2, n = 5 WT, n = 5 Tg), and c MAIT cell-enriched (Vα19TCRTg) mice (n = 9) and their WT littermates (n = 3) subjected to bile duct ligation. Scale bar = 100 μm. Statistical analysis was performed using Mann–Whitney (a, b, c). *p ≤ 0.05 vs. WT

References

    1. Mallat A, Lotersztajn S. Cellular mechanisms of tissue fibrosis. 5. Novel insights into liver fibrosis. Am. J. Physiol. Cell Physiol. 2013;305:C789–C799. doi: 10.1152/ajpcell.00230.2013. - DOI - PubMed
    1. Lotersztajn S, Julien B, Teixeira-Clerc F, Grenard P, Mallat A. Hepatic fibrosis: molecular mechanisms and drug targets. Ann. Rev. Pharmacol. Toxicol. 2005;45:605–628. doi: 10.1146/annurev.pharmtox.45.120403.095906. - DOI - PubMed
    1. Marra F, Lotersztajn S. Pathophysiology of NASH: Perspectives for a targeted treatment. Curr. Pharm. Des. 2013;19:5250–5269. doi: 10.2174/13816128113199990344. - DOI - PMC - PubMed
    1. Gao B, Bataller R. Alcoholic liver disease: pathogenesis and new therapeutic targets. Gastroenterology. 2011;141:1572–1585. doi: 10.1053/j.gastro.2011.09.002. - DOI - PMC - PubMed
    1. Tsuchida T, Friedman SL. Mechanisms of hepatic stellate cell activation. Nat. Rev. Gastroenterol. Hepatol. 2017;14:397–411. doi: 10.1038/nrgastro.2017.38. - DOI - PubMed

Publication types

MeSH terms