. 2018 Aug;175(16):3379-3393.
doi: 10.1111/bph.14383. Epub 2018 Jul 3.

A long-acting FGF21 alleviates hepatic steatosis and inflammation in a mouse model of non-alcoholic steatohepatitis partly through an FGF21-adiponectin-IL17A pathway

Affiliations

A long-acting FGF21 alleviates hepatic steatosis and inflammation in a mouse model of non-alcoholic steatohepatitis partly through an FGF21-adiponectin-IL17A pathway

Lichen Bao et al. Br J Pharmacol. 2018 Aug.

Abstract

Background and purpose: Non-alcoholic steatohepatitis (NASH) is the most severe form of non-alcoholic fatty liver disease and is a serious public health problem around the world. There are currently no approved treatments for NASH. FGF21 has recently emerged as a promising drug candidate for metabolic diseases. However, the disadvantages of FGF21 as a clinically useful medicine include its short plasma half-life and poor drug-like properties. Here, we have explored the effects of PsTag600-FGF21, an engineered long-acting FGF21 fusion protein, in mice with NASH and describe some of the underlying mechanisms.

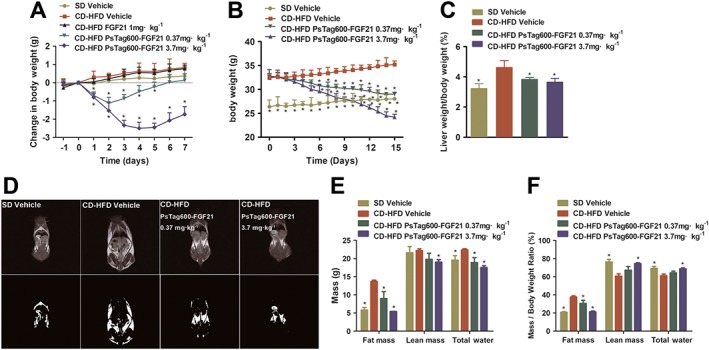
Experimental approach: A long-acting FGF21 was prepared by genetic fusion with a 600 residues polypeptide (PsTag600). We used a choline-deficient high-fat diet-induced model of NASH in mice. The effects on body weight, insulin sensitivity, inflammation and levels of hormones and metabolites were studied first. We further investigated whether PsTag600-FGF21 attenuated inflammation through the Th17-IL17A axis and the associated mechanisms.

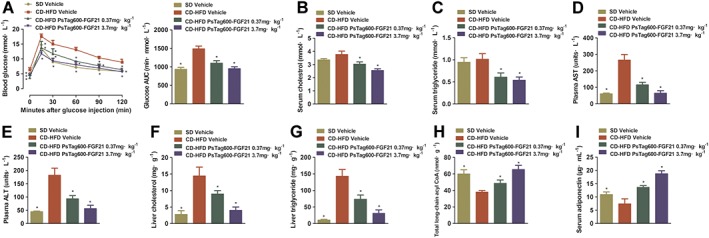
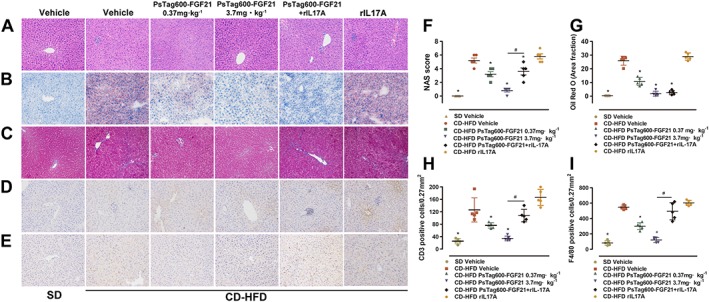
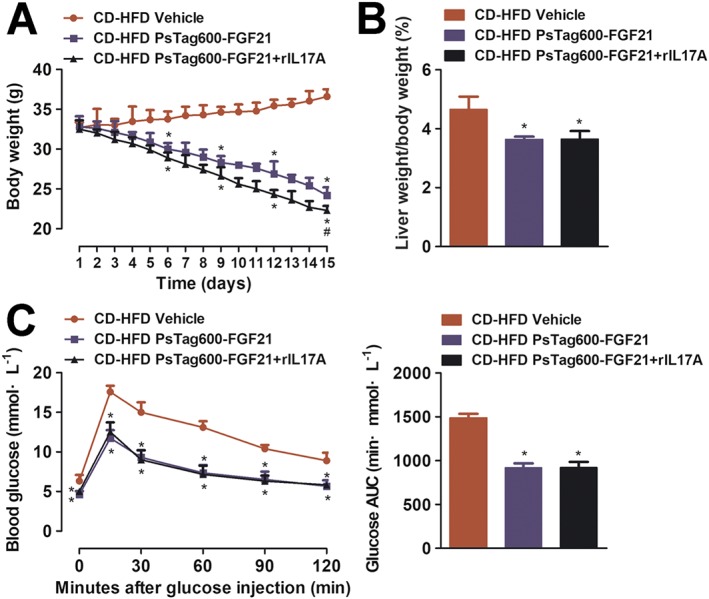
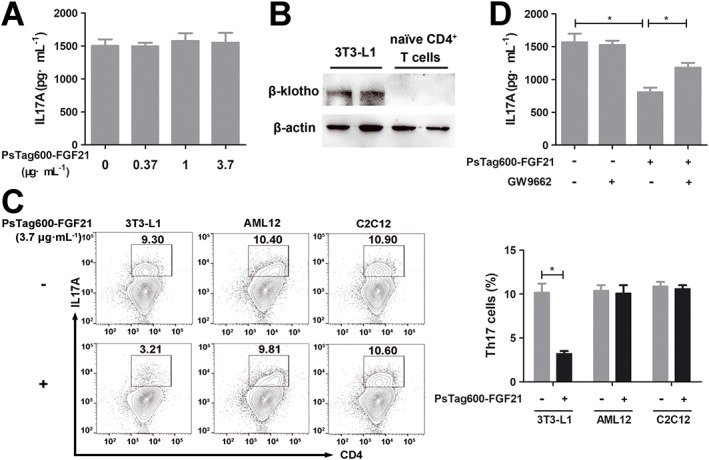
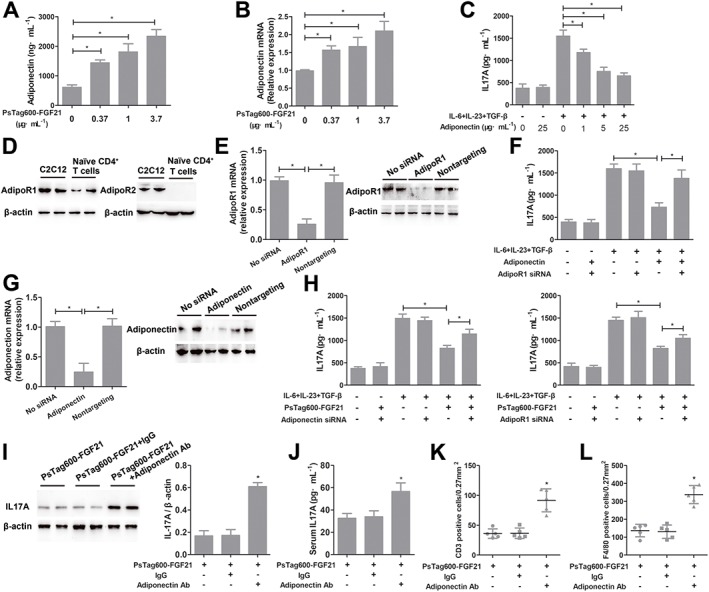
Key results: PsTag600-FGF21 dose-dependently reduced body weight, blood glucose, and insulin and lipid levels and reversed hepatic steatosis. PsTag600-FGF21 enhanced fatty acid activation and mitochondrial β-oxidation in the liver. The profound reduction in hepatic inflammation in NASH mice following PsTag600-FGF21 was associated with inhibition of IL17A expression in Th17 cells. Furthermore, PsTag600-FGF21 depended on adiponectin to exert its suppression of Th17 cell differentiation and IL17A expression.

Conclusions and implications: Our data have uncovered some of the mechanisms by which PsTag600-FGF21 suppresses hepatic inflammation and further suggest that PsTag600-FGF21 could be an effective approach in NASH treatment.


Figures

Figure 1
Figure 1
Physiological effects of PsTag600‐FGF21 in CD‐HFD‐induced NASH mice. (A) Body weight change was measured daily for 7 days. NASH mice were injected i.p. with a single dose on day 0 (n = 8 per group). (B) In a 15 day pharmacological study, body weight was monitored every day (n = 10 per group). (C) Liver weight/body weight (%) of mice after 15 days of treatment. (D) T 1‐weighted MRI images (top) and the fat highlight images (bottom) of mice were shown. (E) Body compositions were analysed. (F) Change in body composition adjusted to body weight. Data shown are means ± SD. *P < 0.05, significantly different from vehicle‐treated NASH mice).
Figure 2
Figure 2
Effects on glucose tolerance, levels of hormones and metabolites. (A) For OGTT, blood glucose and the glucose AUC from 0 to 120 min were measured. (B) Serum cholesterol. (C) Serum triglyceride. (D) Plasma AST. (E) Plasma ALT. (F) Liver cholesterol. (G) Liver triglyceride. (H) Liver total long‐chain acyl CoA. (I) Serum adiponectin. Data shown are means ± SD (n = 10 per group). *P < 0.05, significantly different from vehicle‐treated NASH mice.
Figure 3
Figure 3
Tissue histological and immunohistochemical analyses. Representative histology and IHC on liver sections after the treatment of PsTag600‐FGF21, PsTag600‐FGF21 (3.7 mg·kg−1) + rIL17A or rIL17A. From A to E: H&E, Oil‐red‐O, Masson, CD3 and F4/80 (200× magnification). (F) NAS. (G–I) Quantification analysis of Oil‐red‐O, CD3 and F4/80 using image analytical software Image‐pro plus 6.0 (Media Cybernetics, Inc., Rockville, MD, USA). Data shown are means ± SD (n = 5 per group). *P < 0.05 significantly different from vehicle‐treated NASH mice. # P < 0.05, significantly different from PsTag600‐FGF21‐treated NASH mice.
Figure 4
Figure 4
Gene analysis of liver. (A) Relative mRNA levels of key genes associated with hepatic metabolism in livers. ACSL; FATP; Pgc‐1α, PPARγ coactivator 1α. (B) Relative mRNA levels of proinflammatory genes in livers. CCL2; TNFα; IL‐6; IL‐1β; F4/80; CD68. (C, D) Western blot analysis of CCL2 and TNFα protein levels in the livers and quantitation of results of Western blot using Quantity One® (Bio‐Rad). Data shown are means ± SD (n = 10 per group). *P < 0.05, significantly different from vehicle‐treated NASH mice.
Figure 5
Figure 5
The roles of IL17A in CD‐HFD‐induced NASH mice. (A) Flow cytometry analysis and quantification of IL17A expression on CD4+ T cells in the livers. (B) Relative mRNA levels of IL17A and Lcn2 in livers. (C) Western blot analysis of IL17A protein levels in the livers and quantitation of results of Western blot using Quantity One® (Bio‐Rad). (D) Serum IL17A was measured in CD‐HFD‐induced NASH mice with/without PsTag600‐FGF21. Data shown are means ± SD (n = 10 per group). *P < 0.05, significantly different from vehicle‐treated NASH mice.
Figure 6
Figure 6
The effect of recombinant IL17A on body weight, liver weight and glucose tolerance in NASH mice. (A) In a 15 day pharmacological study, change in body weight was monitored every day. NASH mice were injected i.p. with 3.7 mg·kg−1 PsTag600‐FGF21 every 3 days and 25 μg·kg−1 rIL17A twice a day. (B) Liver weight/body weight (%) of mice after 15 days of treatment. (C) For OGTT, blood glucose and the glucose AUC from 0 to 120 min were measured. Data shown are means ± SD (n = 10 per group). *P < 0.05, significantly different from vehicle‐treated NASH mice; # P < 0.05, significantly different from PsTag600‐FGF21‐treated NASH mice.
Figure 7
Figure 7
PsTag600‐FGF21 indirectly suppressed Th17 cell differentiation and IL17A expression. (A) Naïve CD4+ T cells were treated with indicated concentrations of PsTag600‐FGF21 during differentiation to Th17 cells. The supernatant IL17A levels were assayed after differentiation. (B) Naïve CD4+ T cells were analysed for the expression of FGF21 receptor β‐klotho. Differentiated 3T3‐L1 adipocytes were used as a positive control. (C) Coculture of naïve CD4+ T cells and differentiated 3T3‐L1 adipocytes /AML12 cells/C2C12 myoblasts with/without PsTag600‐FGF21 (3.7 μg·mL−1) during differentiation to Th17 cells. Flow cytometry analysis and quantification of IL17A expression on CD4+ T cells after differentiation. (D) Co‐culture of differentiated 3T3‐L1 adipocytes and naïve CD4+ T cells were pretreated with GW9662 (10.0 μmol·L−1) for 1 h, followed by incubation with PsTag600‐FGF21 (3.7 μg·mL−1) during differentiation to Th17 cells. The supernatant IL17A levels were assayed after differentiation. Data shown are means ± SD (n = 6 per group). *P < 0.05, significantly different as indicated.
Figure 8
Figure 8
PsTag600‐FGF21 suppressed Th17 cell differentiation via adiponectin (n = 5 per group). (A, B) Differentiated 3T3‐L1 adipocytes were incubated with indicated concentrations of PsTag600‐FGF21 for 24 h. Adiponectin concentration in the conditioned medium and relative adiponectin mRNA abundance were analysed. *P < 0.05, significantly different as indicated. (C) Naïve CD4+ T cells were treated with indicated concentrations of adiponectin during differentiation to Th17 cells. The levels of IL17A in the supernatants were assayed after differentiation. *P < 0.05, significantly different as indicated. (D) Naïve CD4+ T cells were analysed for the expression of the adiponectin receptors, Adipo1 and Adipo2. C2C12 muscle cells were used as a positive control. (E) Naïve CD4+ T cells were transfected with Adipo1 receptor siRNA or non‐targeting control siRNA. Relative abundance of Adipo1 receptor mRNA and protein levels were analysed. *P < 0.05, significantly different as indicated. (F) Naïve CD4+ T cells were transfected with Adipo1 receptor siRNA and were treated with adiponectin (5 μg·mL−1) during differentiation to Th17 cells. The levels of IL17A in the supernatants were assayed after differentiation. *P < 0.05, significantly different as indicated. (G) Differentiated 3T3‐L1 adipocytes were transfected with adiponectin siRNA or nontargeting control siRNA. Relative adiponectin mRNA abundance and protein levels were analysed. *P < 0.05, significantly different as indicated. (H) Differentiated 3T3‐L1 adipocytes were transfected with siRNA against adiponectin, or naïve CD4+ T cells were transfected with siRNA against Adipo1 receptors respectively. Differentiated 3T3‐L1 adipocytes and naïve CD4+ T cells were cocultured with PsTag600‐FGF21 (3.7 μg·mL−1) during differentiation to Th17 cells. The levels of IL17A in the supernatants were assayed after differentiation. *P < 0.05, significantly different as indicated. (I) Western blot analysis of IL17A protein levels in the livers was measured in PsTag600‐FGF21‐treated NASH mice with/without an anti‐adiponectin antibody. Quantitation of results of Western blot using Quantity One® (Bio‐Rad) *P < 0.05, significantly different from PsTag600‐FGF21‐treated NASH mice. (J) Serum IL17A in mice described in (I) (*P < 0.05 vs. PsTag600‐FGF21‐treated NASH mice). (K, L) Quantification of CD3 and F4/80 from Supporting Information Figure S7. Data shown are means ± SD. *P < 0.05, significantly different from PsTag600‐FGF21‐treated NASH mice.

References

    1. Alexander SPH, Kelly E, Marrion NV, Peters JA, Faccenda E, Harding SD et al (2017a). The Concise Guide to PHARMACOLOGY 2017/18: Other proteins. Br J Pharmacol 174: S1–S16. - PMC - PubMed
    1. Alexander SPH, Cidlowski JA, Kelly E, Marrion NV, Peters JA, Faccenda E et al (2017b). The Concise Guide to PHARMACOLOGY 2017/18: Nuclear hormone receptors. Br J Pharmacol 174: S208–S224. - PMC - PubMed
    1. Alexander SPH, Fabbro D, Kelly E, Marrion NV, Peters JA, Faccenda E et al (2017c). The Concise Guide to PHARMACOLOGY 2017/18: Catalytic receptors. Br J Pharmacol 174: S225–S271. - PMC - PubMed
    1. Alexander SPH, Kelly E, Marrion NV, Peters JA, Faccenda E, Harding SD et al (2017d). The Concise Guide to PHARMACOLOGY 2017/18: Transporters. Br J Pharmacol 174: S360–S446. - PMC - PubMed
    1. Bashiardes S, Shapiro H, Rozin S, Shibolet O, Elinav E (2016). Non‐alcoholic fatty liver and the gut microbiota. Mol Metab 5: 782–794. - PMC - PubMed

Publication types

MeSH terms