. 2018 Jun 1;19(1):71.
doi: 10.1186/s13059-018-1437-x.

Vex-seq: high-throughput identification of the impact of genetic variation on pre-mRNA splicing efficiency

Affiliations

Vex-seq: high-throughput identification of the impact of genetic variation on pre-mRNA splicing efficiency

Scott I Adamson et al. Genome Biol. .

Abstract

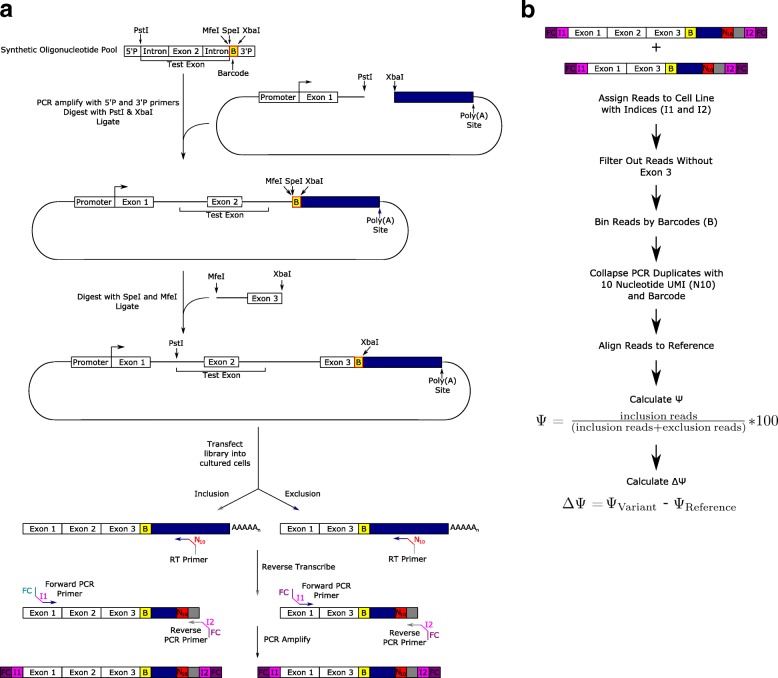
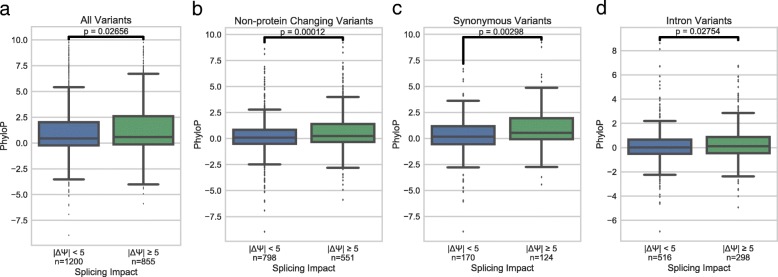
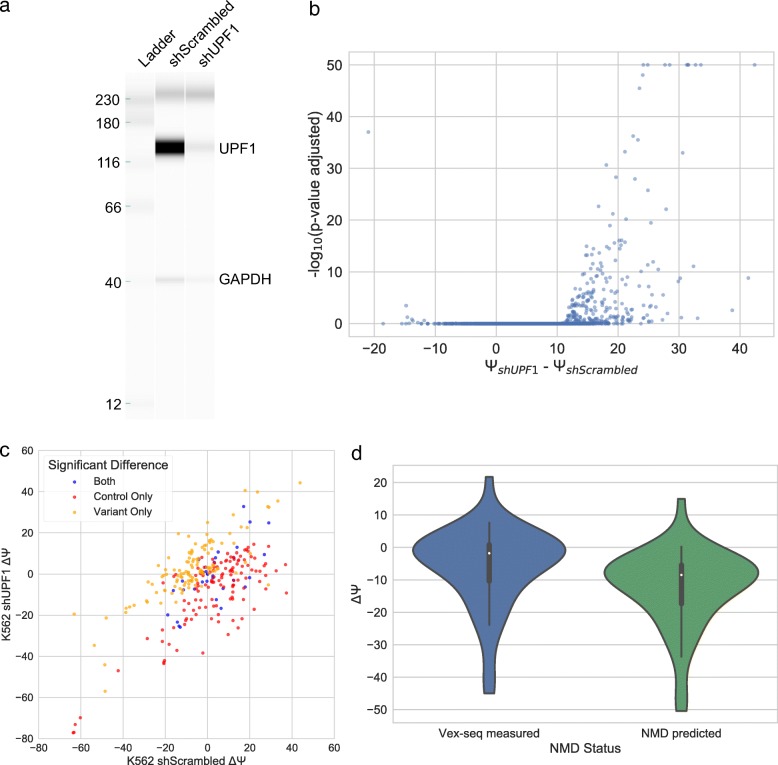
Understanding the functional impact of genomic variants is a major goal of modern genetics and personalized medicine. Although many synonymous and non-coding variants act through altering the efficiency of pre-mRNA splicing, it is difficult to predict how these variants impact pre-mRNA splicing. Here, we describe a massively parallel approach we use to test the impact on pre-mRNA splicing of 2059 human genetic variants spanning 110 alternative exons. This method, called variant exon sequencing (Vex-seq), yields data that reinforce known mechanisms of pre-mRNA splicing, identifies variants that impact pre-mRNA splicing, and will be useful for increasing our understanding of genome function.


Conflict of interest statement

The authors declare that they have no competing interests.

Figures

Fig. 1
Fig. 1
Assembly of test exon and experimental design. a The test exon and flanking introns are subcloned into a reporter plasmid in a two-step process, such that the barcode designating the sequence is near the end of the transcript. Once these plasmids are transfected into cultured cells, a transcript will be produced that may not contain the variant itself, but does contain the barcode (b) uniquely associated with the variant tested. A ten-nucleotide UMI (N10) is attached during the reverse transcription step to collapse PCR duplicates downstream. Illumina flow cell binding sequences (FC) and indexes (I1 and I2) are attached via primers during PCR and the resulting DNA is sequenced on a MiSeq platform. b Data analysis pipeline for splicing results
Fig. 2
Fig. 2
Quality control for plasmid integrity. a Quality control pipeline for plasmid integrity. Amplicon sequencing of the 1o and 2o plasmid configurations are done through PCR to attach Illumina flow cell binding sequences (FC) and indexes (I1 and I2). Poor quality barcodes are then filtered out by identification of reads not containing variants and excluding barcodes with less than 85% of reads containing the correct variant. b A histogram of the barcodes with the percentage of reads with correct variant identified. c Box plots of 1˚ library read depth for barcodes included and excluded from further analysis
Fig. 3
Fig. 3
Behavior and reproducibility of splicing outcomes. a Scatter plots showing the behavior of Ψ for each barcode replicate of the same variant. These were averaged Ψ values of the barcode in each biological replicate. Spearman (s) and Pearson (p) correlations of Ψ are also shown. b Scatter plots showing the splicing behavior or Ψ for each variant in each biological replicate. Spearman (s) and Pearson (p) correlations of Ψ are also shown
Fig. 4
Fig. 4
Splice site control sequences generally reflect expected splicing behavior. Boxplots of mean Ψ for each type of control and test sequences are shown. Mutated splice site controls contained mutated splice sites such that the 3′ splice sites were changed from AG to TC and the 5′ splice sites were changed from GT to CA. For the consensus splice site controls, the variants contained a 20-nucleotide pyrimidine tract, an AG at the 3′ splice site, and a consensus 5′ splice site of GTAAGT
Fig. 5
Fig. 5
Similar behavior of splicing between K562 and HepG2 cell lines. a Correlation between Ψ values for each variant between K562 and HepG2 cell lines. b Correlation between ΔΨ values between K562 and HepG2 cell lines. Color coding highlights variants in which the HepG2 ΔΨ changes at different thresholds. Spearman (s) and Pearson (p) correlations are also displayed on each plot
Fig. 6
Fig. 6
Distribution of variants tested and their impacts relative to splice sites. ΔΨ from both K562 and HepG2 cell lines is plotted for all variants relative to 3′ and 5′ splice sites. Fifty bases of upstream intron, 33 bases of exon proximal to the splice sites and 20 bases of downstream intron are shown. Above is a histogram showing the number of observations at each position
Fig. 7
Fig. 7
Analysis of potential mechanisms underlying splicing changes. a Violin plots showing how the directionality of a change in ESEseq score associates with splicing changes. P value is calculated using Mann-Whitney U-test. b Scatter plot demonstrating the relationship between the ESEseq score of each hexamer and the average ΔΨ of variance gaining (adding ΔΨ) or losing (subtracting ΔΨ) that hexamer. c Scatter plot showing the positive correlation between changes in 3′ splice site maximum entropy and ΔΨ. d Scatter plot showing the positive correlation between changes in 5′ splice site maximum entropy and ΔΨ. Spearman correlation coefficients and spearman correlation p values are shown in c and d
Fig. 8
Fig. 8
Variants classified by effect prediction and their impact on ΔΨ. Splice region classified by VEP is defined as being within one to three bases of the proximal exon, or three to eight bases of the proximal introns. The splice donor and acceptor annotations strictly refer to the dinucleotides downstream and upstream of the exon, respectively. The first reported annotation by VEP is displayed
Fig. 9
Fig. 9
Conservation of variants with strong splicing impacts. a Boxplots showing the relationship of PhyloP and magnitude of ΔΨ for all variants. b Boxplots showing the relationship of PhyloP and magnitude of ΔΨ for variants without predicted protein coding annotations. c Boxplots showing the relationship of PhyloP and magnitude ΔΨ for synonymous variants. d Boxplots showing the relationship of PhyloP and magnitude of ΔΨ for intron variants. P values are calculated with the Mann-Whitney U-test. All variant effect predictions were performed by VEP and were classified by the first reported annotation
Fig. 10
Fig. 10
The impact of NMD on Vex-seq splicing results. a Western blot from Wes showing UPF1 knockdown in K562 cells. b A volcano plot showing the significance (assessed by rMATS-STAT) and change in splicing of shUPF1 cells compared to a scrambled control. c A scatter plot showing the behavior of ΔΨ of test exons in which there is a significant difference in the shUPF1 cells compared to the shScrambled cells. The color coding highlights test exons in which a significant difference in Ψ was identified. d Violin plots showing the predicted impact of NMD on variants which would be subject to NMD endogenously, but not in Vex-seq

References

    1. Nilsen TW, Graveley BR. Expansion of the eukaryotic proteome by alternative splicing. Nature. 2010;463:457–63. - PMC - PubMed
    1. Garcia-Blanco MA, Baraniak AP, Lasda EL. Alternative splicing in disease and therapy. Nat Biotechnol. 2004;22:535–546. doi: 10.1038/nbt964. - DOI - PubMed
    1. Li YI, van de Geijn B, Raj A, Knowles DA, Petti AA, Golan D, et al. RNA splicing is a primary link between genetic variation and disease. Science. 2016;352:600–604. doi: 10.1126/science.aad9417. - DOI - PMC - PubMed
    1. Scotti MM, Swanson MS. RNA mis-splicing in disease. Nat Rev Genet. 2016;17:19–32. doi: 10.1038/nrg.2015.3. - DOI - PMC - PubMed
    1. Xiong HY, Alipanahi B, Lee LJ, Bretschneider H, Merico D, Yuen RKC, et al. RNA splicing. The human splicing code reveals new insights into the genetic determinants of disease. Science. 2015;347:1254806. doi: 10.1126/science.1254806. - DOI - PMC - PubMed

Publication types