. 2018 Aug 15;27(16):2874-2892.
doi: 10.1093/hmg/ddy201.

Benfotiamine treatment activates the Nrf2/ARE pathway and is neuroprotective in a transgenic mouse model of tauopathy

Affiliations

Benfotiamine treatment activates the Nrf2/ARE pathway and is neuroprotective in a transgenic mouse model of tauopathy

Victor Tapias et al. Hum Mol Genet. .

Abstract

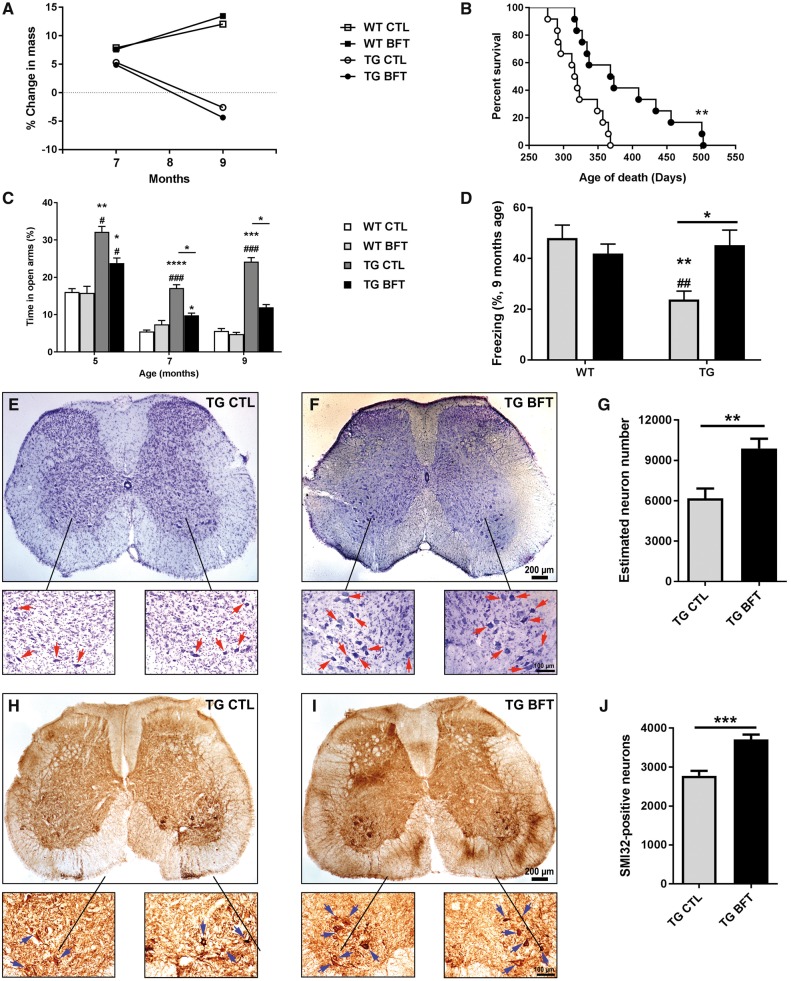
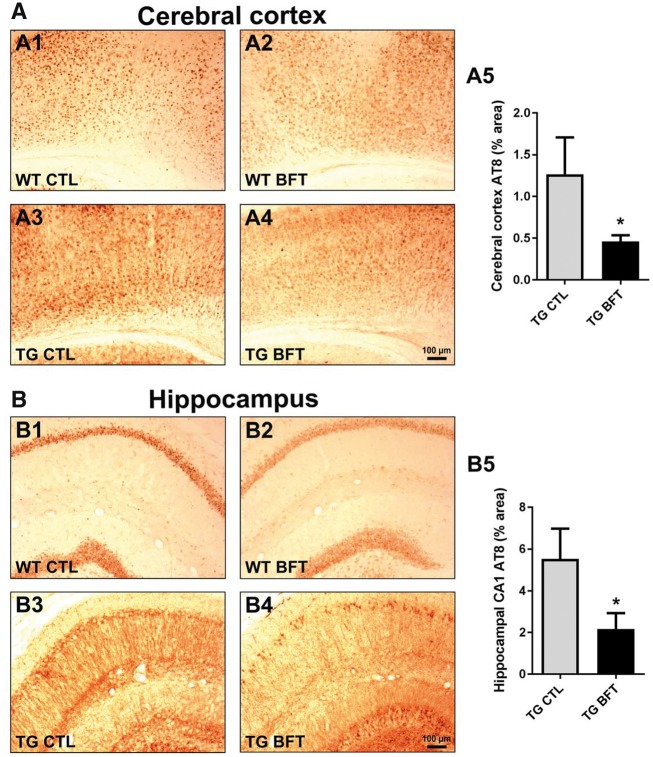
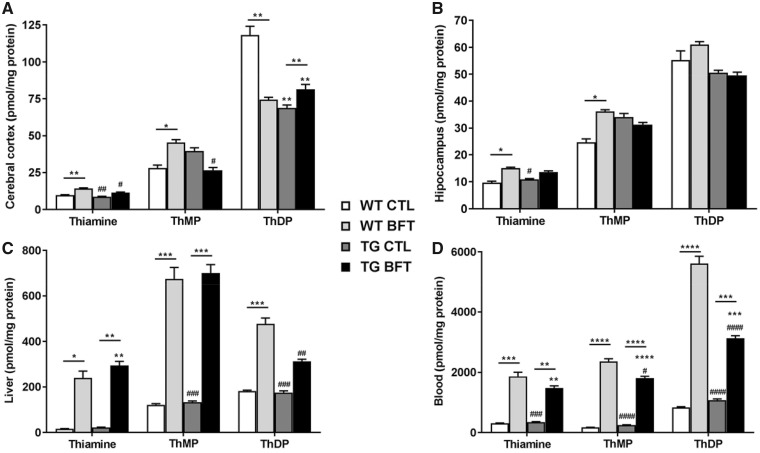
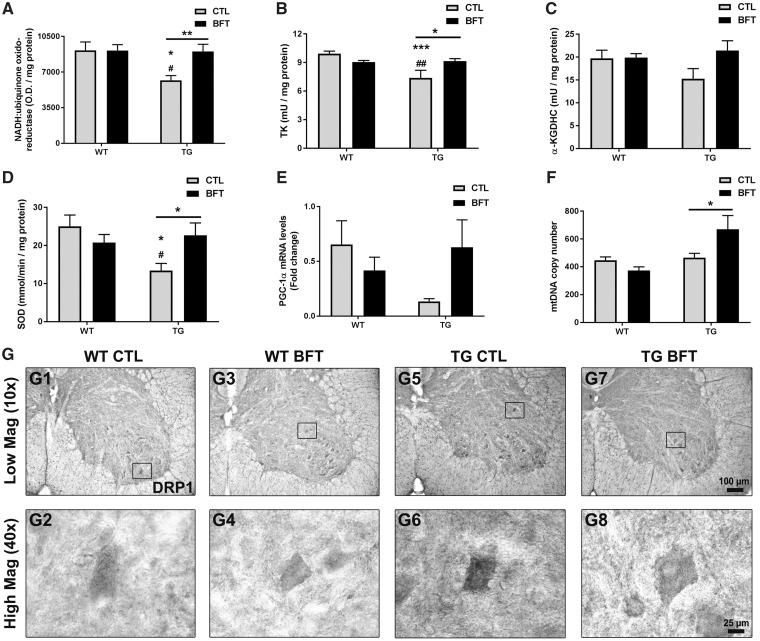
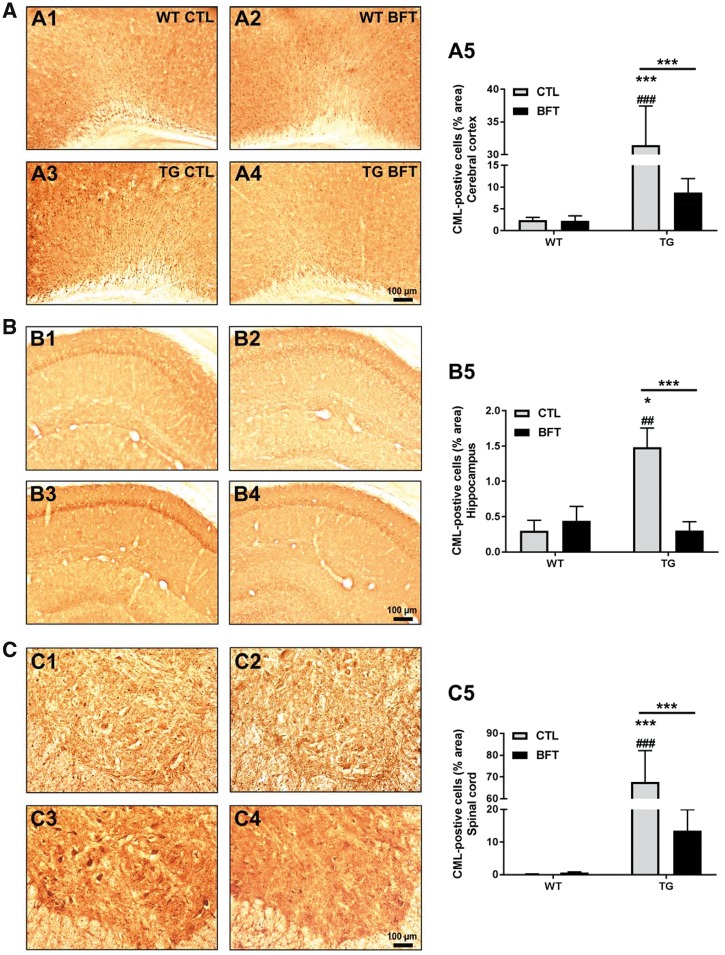
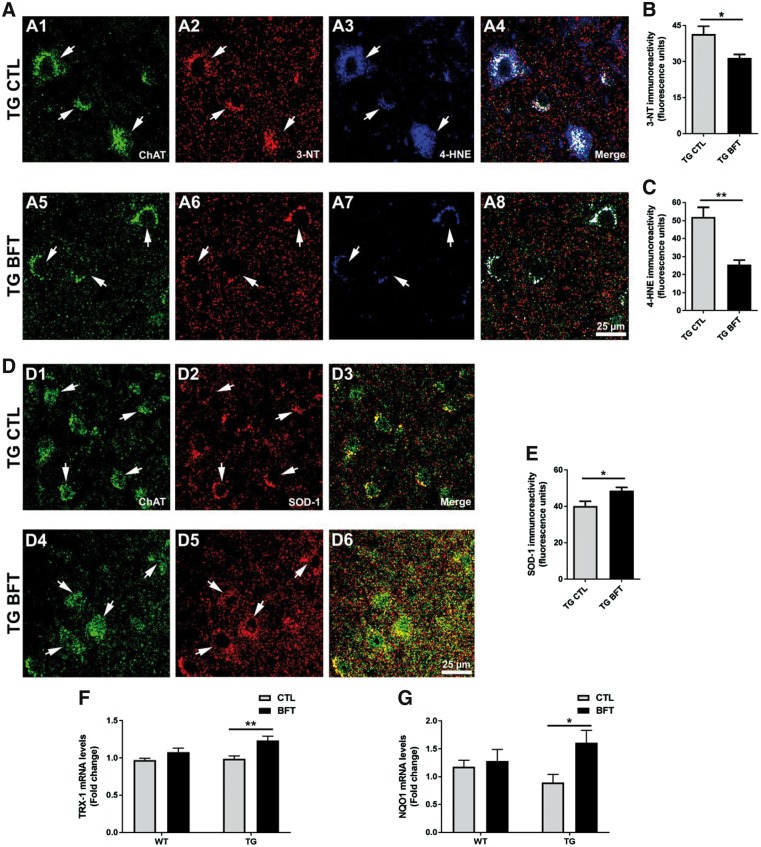
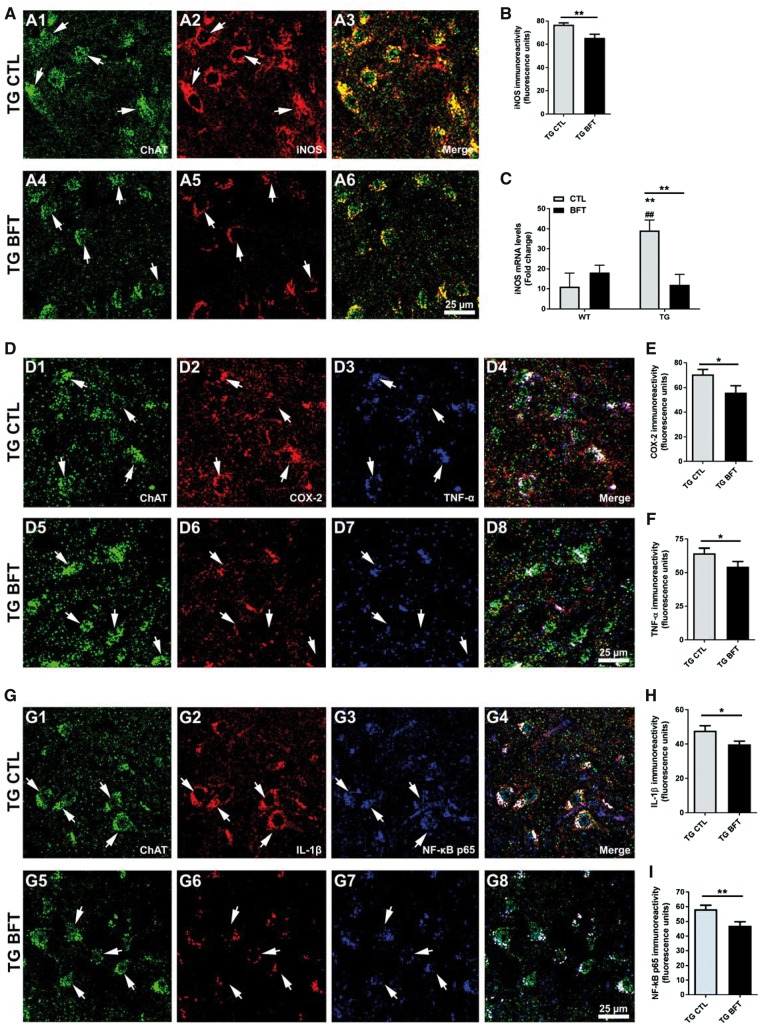
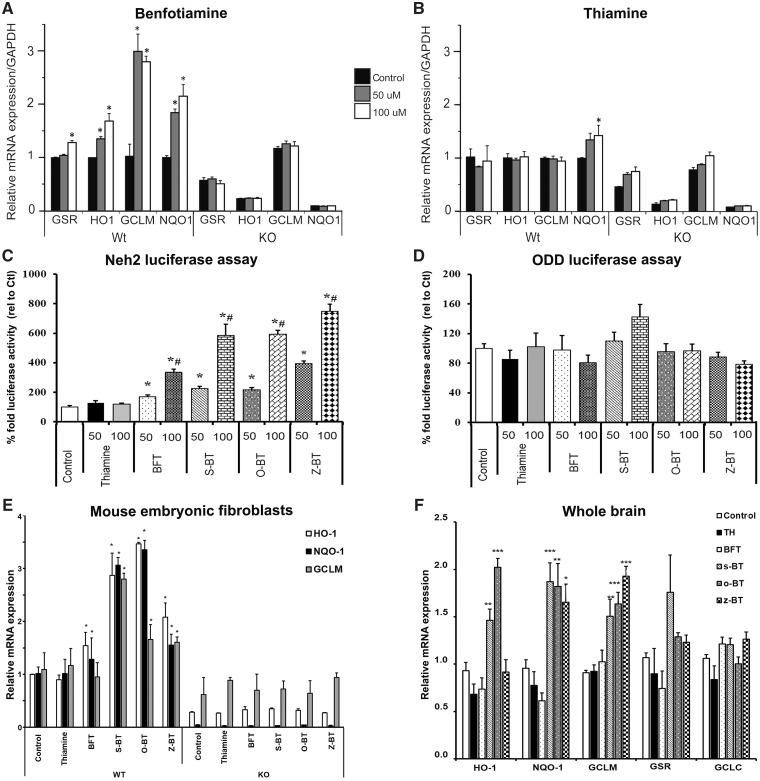
Impaired glucose metabolism, decreased levels of thiamine and its phosphate esters, and reduced activity of thiamine-dependent enzymes, such as pyruvate dehydrogenase, alpha-ketoglutarate dehydrogenase and transketolase occur in Alzheimer's disease (AD). Thiamine deficiency exacerbates amyloid beta (Aβ) deposition, tau hyperphosphorylation and oxidative stress. Benfotiamine (BFT) rescued cognitive deficits and reduced Aβ burden in amyloid precursor protein (APP)/PS1 mice. In this study, we examined whether BFT confers neuroprotection against tau phosphorylation and the generation of neurofibrillary tangles (NFTs) in the P301S mouse model of tauopathy. Chronic dietary treatment with BFT increased lifespan, improved behavior, reduced glycated tau, decreased NFTs and prevented death of motor neurons. BFT administration significantly ameliorated mitochondrial dysfunction and attenuated oxidative damage and inflammation. We found that BFT and its metabolites (but not thiamine) trigger the expression of Nrf2/antioxidant response element (ARE)-dependent genes in mouse brain as well as in wild-type but not Nrf2-deficient fibroblasts. Active metabolites were more potent in activating the Nrf2 target genes than the parent molecule BFT. Docking studies showed that BFT and its metabolites (but not thiamine) bind to Keap1 with high affinity. These findings demonstrate that BFT activates the Nrf2/ARE pathway and is a promising therapeutic agent for the treatment of diseases with tau pathology, such as AD, frontotemporal dementia and progressive supranuclear palsy.


Figures

Figure 1.
Figure 1.
BFT treatment increased lifespan, improved behavioral deficits, and prevented motor neuron death in P301S mice. (A) Animal weight. No differences were observed following chronic BFT administration. (B) Survival curve. BFT-treated TG mice showed a significant increase in lifespan. **P <0.01 compared with TG CTL (Gehan–Breslow–Wilcoxon test). (C) EPM and (D) contextual fear conditioning. Long-term treatment with BFT enhanced memory and reduced behavioral hyperactivity and disinhibition. ****P < 0.0001, ***P < 0.001, **P < 0.01 and *P < 0.05 relative to WT CTL. ###P < 0.001, ##P < 0.01 and #P < 0.05 versus WT BFT. *P < 0.05 compared with TG CTL (two-way ANOVA followed by Tukey multiple comparisons test). L3‒L6 regions of the spinal cord, which contain motor neuron pools for the hind limbs, were stained with cresyl violet (E and F) and the SMI32 antibody (H and I), which recognizes an epitope on non-phosphorylated neurofilament of proteins. Stereological counts show a higher number of motor neurons in BTF treated P301S TG mice compared with TG mice on a control diet. Quantitative analysis was carried out in eight sections per animal. Each treatment group was comprised of six mice. **P < 0.01 and *P < 0.05 relative to TG CTL (unpaired t-test). Scale bar: 200 μm at low magnification and 100 μm at high magnification.
Figure 2.
Figure 2.
Reduced tau pathology following BFT administration. Immunostaining with AT8 antibody in the cerebral cortex (A) and hippocampus (B) of WT and TG mice treated with BFT or control diet. Calculation of the percent area occupied by AT8-immunopositive neurons revealed that BFT significantly reduced tau hyperphosphorylation in the brain of TG mice. For all tests, n = 6 for TG CTL and n = 8 for TG BFT. *P < 0.05 compared with TG CTL (unpaired t-test). Scale bar: 100 μm.
Figure 3.
Figure 3.
Levels of thiamine and its metabolites. Content of thiamine, ThMP and ThDP levels in the cerebral cortex (A), hippocampus (B), liver (C) and blood (D) of WT and TG mice. Treatment with BFT resulted in elevated levels of thiamine, ThMP and ThDP in the liver and blood of both WT littermates and P301S TG mice. However, BFT only increases the concentration of cortical and hippocampal thiamine, ThMP and ThDP in WT mice but remained unchanged in TG mice. The experimental groups were comprised of seven mice for CTL group and eight mice for BFT group. ****P < 0.0001, ***P < 0.001, **P < 0.01 and *P < 0.05 versus WT CTL. ####P < 0.001, ###P < 0.001, ##P < 0.01 and #P < 0.05 compared with WT BFT. ****P < 0.0001, ***P < 0.001 and **P < 0.01 relative to TG CTL (two-way ANOVA followed by Tukey multiple comparisons test).
Figure 4.
Figure 4.
BFT restores mitochondrial dysfunction. Frontal lobe samples were used to determine the mitochondrial expression of complex I (A), enzymatic activity of TK (B), α-KGDHC (C) and SOD (D), mRNA levels of PGC-1α (E), and mtDNA copy number (F). TG mice fed BFT exhibited a considerable increase in Complex I immunoreactivity, enzymatic activities, PGC-1α levels and the copy number of mtDNA. Data are mean ± S.E.M. of six to eight mice per group. ***P < 0.001 and *P < 0.05 relative to WT CTL. ##P < 0.01 and #P < 0.05 versus WT BFT. **P < 0.01 and *P < 0.05 compared with TG CTL (two-way ANOVA followed by Tukey multiple comparisons test). (G) Assessment of DRP1 immunoreactivity in the ventral horn of the lumbar spinal cord of WT and TG mice fed control or BFT diets. Insets correspond to high magnification images of DRP1 immunoreactivity in individual motor neurons. The expression of DRP1 was elevated in untreated P301S TG mice compared with WT mice with or without BFT. DRP1 immunoreactivity was robustly decreased by BFT treatment. Scale bar: 100 μm at low magnification and 25 μm at high magnification.
Figure 5.
Figure 5.
Exposure to BFT prevents the formation of AGEs. CML immunoreactivity in the cerebral cortex (A), hippocampus (B) and spinal cord (C) of WT and TG mice with or without BFT treatment. There was a substantial decrease in the percent area occupied by CML-immunoreactive cells following BFT exposure in P301S TG mice. WT, n = 3–5; TG, n = 7–10. ***P < 0.001 and *P < 0.05 versus WT CTL. ###P < 0.001 and ##P < 0.01 compared with WT BFT. ***P < 0.001 relative to TG CTL (two-way ANOVA followed by Tukey multiple comparisons test). Scale bar: 100 μm.
Figure 6.
Figure 6.
Dietary administration of BFT reduces oxidative and nitrosative stress. Representative ×40 confocal images for 3-NT and 4-HNE immunostaining in spinal cord sections (A). BFT treatment resulted in a significant decrease in the immunoreactivity of 3-NT and 4-HNE in P301S TG mice compared with TG mice on a control diet (A2A3 versus A6A7, respectively). Quantification of fluorescence intensity for 3-NT (B) and 4-HNE (C). Histograms are representative of the average of 250–300 motor neurons corresponding to four to five sections per animal. Results are expressed as the mean ± S.E.M. of four to five mice per group. **P < 0.01 and *P < 0.05 compared with TG CTL (unpaired t-test). Scale bar: 25 μm. Immunofluorescent micrographs at ×40 depicted an enhanced expression of SOD-1 in TG mice treated with BFT relative to TG CTL mice (D). The mean fluorescence intensity signal for each ROI was determined in spinal cord sections, with data representing the average of 250–300 motor neurons corresponding to four to five sections per animal (E). Each group was comprised of four to five mice. *P < 0.05 relative to TG CTL (unpaired t-test). Scale bar: 25 μm. Chronic administration of BFT upregulated mRNA levels of TRX-1 (F) and NQO1 (G) in P301S TG mice. A total of five to six mice from each genotype were used for quantitative analyses. **P < 0.01 and *P < 0.05 compared with TG CTL (two-way ANOVA followed by Tukey multiple comparisons test).
Figure 7.
Figure 7.
BFT treatment alleviates inflammation. (A) Confocal images depicted a marked iNOS immunoreactivity in TG CTL mice but oral administration of BFT significantly downregulated iNOS levels (A2 versus A5). (B) Quantification of fluorescence levels of iNOS representative of the average of 250–300 motor neurons corresponding to four to five sections per animal. Results are expressed as the mean ± S.E.M. of four to five mice per group. **P < 0.01 versus TG CTL (unpaired t-test). Scale bar: 25 μm. (C) Gene expression levels of iNOS in WT and TG mice fed either a control or BFT diet. Exposure to BFT caused a robust reduction in iNOS mRNA levels in P301S TG mice relative to TG CTL mice. **P < 0.01 compared with WT CTL. ##P < 0.01 versus WT BFT. **P < 0.01 versus TG CTL (two-way ANOVA followed by Tukey multiple comparisons test). (D) Representative immunofluorescence confocal images at 40× for COX-2 and TNF-α in spinal cord sections. The immunoreactivity of COX-2 and TNF-α was significantly diminished in BFT-treated P301S TG mice relative to TG mice on a control diet (D2D3 versus D6D7). Quantification of fluorescence intensity for COX-2 levels (E) and TNF-α (F). Each bar represents the mean ± S.E.M. of 250–300 motor neurons from four to five sections per animal. Each group was comprised of 4–5 mice. *P < 0.05 compared with TG CTL (unpaired t-test). Scale bar: 25 μm. (G) Confocal micrographs at ×40 revealed that TG CTL mice displayed higher IL-1β and NF-κB p65 fluorescence intensity, which was substantially reduced following BFT treatment (G2G3 versus G6G7). Quantification of immunofluorescence for IL-1β (H) and NF-κB p65 (I). All measurements are the average ± S.E.M. of 250–300 motor neurons from four to five sections per animal. Each group was comprised of four to five mice. **P < 0.01 and *P < 0.05 versus TG CTL (unpaired t-test). Scale bar: 50 μm at low magnification and 25 μm at high magnification.
Figure 8.
Figure 8.
BFT and its metabolites activate the Nrf2/ARE pathway. BFT treatment induced transcription of Nrf2/ARE genes in WT but not Nrf2 KO MEFs. Nrf2 WT/KO MEFs were treated with solvent (Control, 1:1 pyridine:water) or 50 μM (50) or 100 μM (100) of either BFT (A) or thiamine (B). GSR and HO1 mRNA was measured after 3 h incubation with the drugs, where as GCLM and NQO1 were measured after 8 h of incubation. Thiamine did not have any effect on the genes examined except for GSR at the highest dose (100 μM) after 8 h treatment. Experiments were conducted in three biological replicates, each in six technical replicates. *P < 0.05 when compared with WT control. (C) BFT, its metabolites and thiamine were tested for Neh2-luc activation (C) in Neh2-luc expressing SH-SY5Y cells and in ODD-luc assay (D) at two different concentrations (50 and 100 µM). BFT and its metabolites but not thiamine showed Neh2-luc activation whereas none of the compounds activated ODD-luc. The luciferase activity was measured and depicted as percentage fold activity. Data are mean ± S.E.M. from three independent experiments. *P < 0.05 compared with control. #P < 0.05 relative to 50 µM of respective drug. (E) Effects of BFT and its metabolites on GCLM, NQO1 and HO1 ARE genes in Nrf2 WT and KO MEFs. The levels of mRNA were measured after 4 h of incubation with control (1:1, pyridine:water) or 100 µM of either thiamine, BFT, s-BT, o-BT or z-BT. Measurements were conducted at least three times for all conditions. *P <0.05 compared with WT control. (F) WT C57BL/6 mice were treated for 3 h with either vehicle or 1250 mg/kg of thiamine, BFT, s-BT, o-BT or z-BT through oral gavage. Gene expression changes were assessed by quantitative RT-PCR. All measurements are the averages ± S.E.M. from n = five to six mice per group. ***P < 0.001, **P < 0.01 and *P < 0.05 relative to control. Statistical analyses were performed by two-way ANOVA with post hoc analysis by Dunnett’s multiple comparison test.

References

    1. Bettendorff L., Wins P. (2009) Thiamin diphosphate in biological chemistry: new aspects of thiamin metabolism, especially triphosphate derivatives acting other than as cofactors. FEBS J., 276, 2917–2925. - PubMed
    1. Bettendorff L. (1995) Thiamine homeostasis in neuroblastoma cells. Neurochem. Int., 26, 295–302. - PubMed
    1. Bettendorff L., Mastrogiacomo F., Kish S.J., Grisar T. (2002) Thiamine, thiamine phosphates, and their metabolizing enzymes in human brain. J. Neurochem., 66, 250–258. - PubMed
    1. Gangolf M., Czerniecki J., Radermecker M., Detry O., Nisolle M., Jouan C., Martin D., Chantraine F., Lakaye B., Wins P. (2010) Thiamine status in humans and content of phosphorylated thiamine derivatives in biopsies and cultured cells. PLoS One, 5, e13616.. - PMC - PubMed
    1. Gibson G.E., Sheu K.F., Blass J.P., Baker A., Carlson K.C., Harding B., Perrino P. (1988) Reduced activities of thiamine-dependent enzymes in the brains and peripheral tissues of patients with Alzheimer’s disease. Arch. Neurol., 45, 836–840. - PubMed

Publication types

MeSH terms