. 2018 Aug 1;141(8):2329-2342.
doi: 10.1093/brain/awy127.

Impaired plasticity of macrophages in X-linked adrenoleukodystrophy

Affiliations

Impaired plasticity of macrophages in X-linked adrenoleukodystrophy

Isabelle Weinhofer et al. Brain. .

Abstract

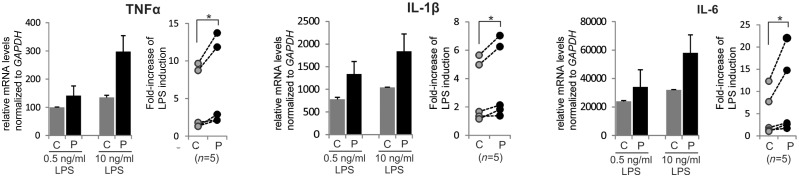
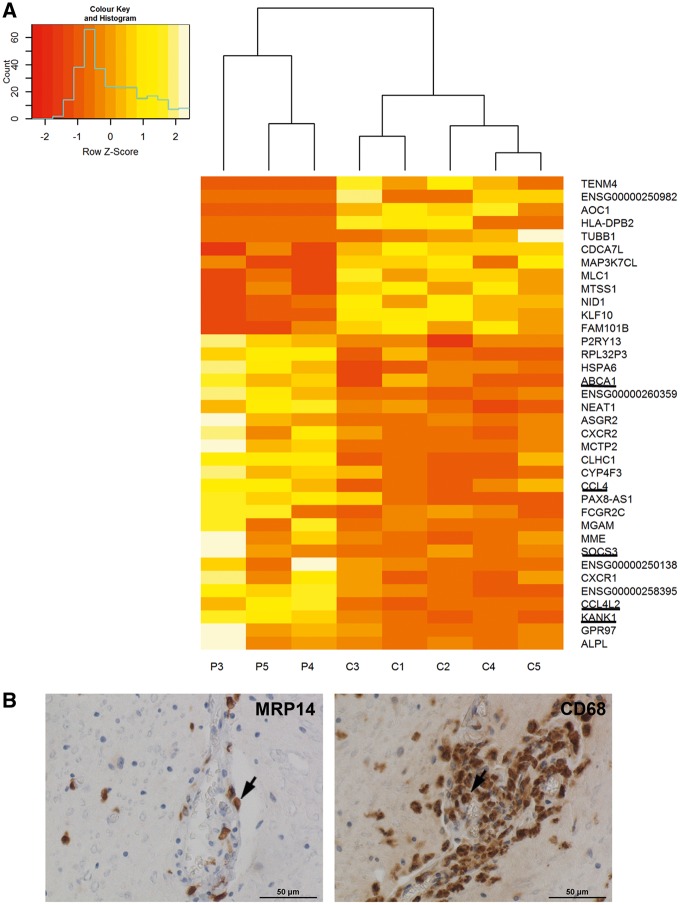
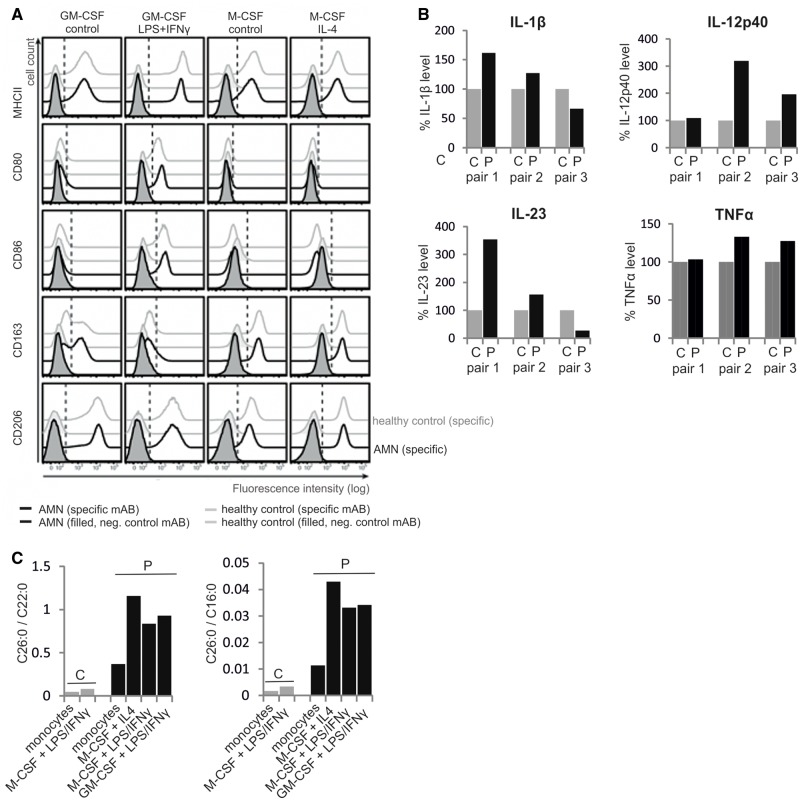
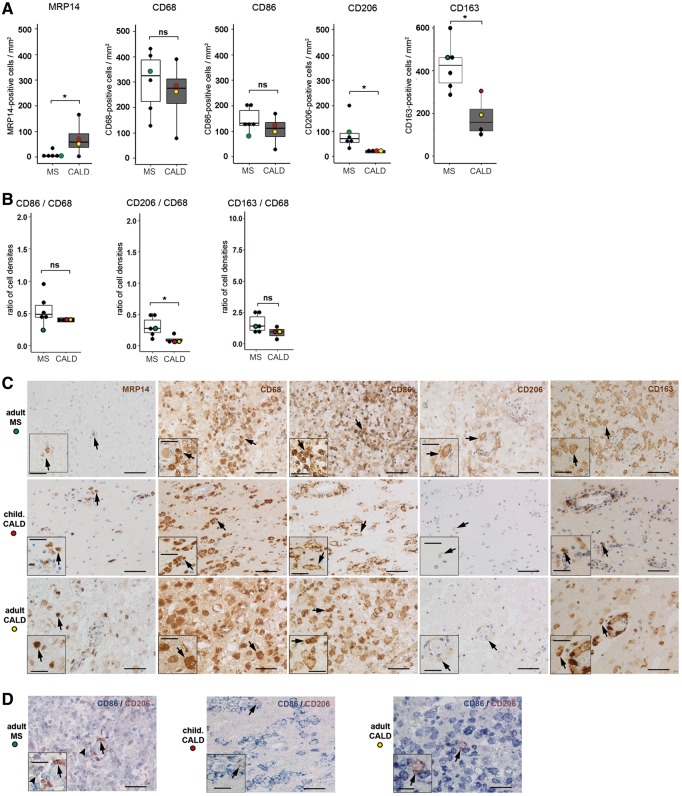
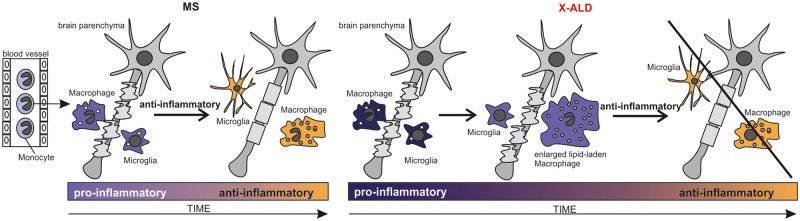
X-linked adrenoleukodystrophy is caused by ATP-binding cassette transporter D1 (ABCD1) mutations and manifests by default as slowly progressive spinal cord axonopathy with associated demyelination (adrenomyloneuropathy). In 60% of male cases, however, X-linked adrenoleukodystrophy converts to devastating cerebral inflammation and demyelination (cerebral adrenoleukodystrophy) with infiltrating blood-derived monocytes and macrophages and cytotoxic T cells that can only be stopped by allogeneic haematopoietic stem cell transplantation or gene therapy at an early stage of the disease. Recently, we identified monocytes/macrophages but not T cells to be severely affected metabolically by ABCD1 deficiency. Here we found by whole transcriptome analysis that, although monocytes of patients with X-linked adrenoleukodystrophy have normal capacity for macrophage differentiation and phagocytosis, they are pro-inflammatory skewed also in patients with adrenomyloneuropathy in the absence of cerebral inflammation. Following lipopolysaccharide activation, the ingestion of myelin debris, normally triggering anti-inflammatory polarization, did not fully reverse the pro-inflammatory status of X-linked adrenoleukodystrophy macrophages. Immunohistochemistry on post-mortem cerebral adrenoleukodystrophy lesions reflected the activation pattern by prominent presence of enlarged lipid-laden macrophages strongly positive for the pro-inflammatory marker co-stimulatory molecule CD86. Comparative analyses of lesions with matching macrophage density in cases of cerebral adrenoleukodystrophy and acute multiple sclerosis showed a similar extent of pro-inflammatory activation but a striking reduction of anti-inflammatory mannose receptor (CD206) and haemoglobin-haptoglobin receptor (CD163) expression on cerebral adrenoleukodystrophy macrophages. Accordingly, ABCD1-deficiency leads to an impaired plasticity of macrophages that is reflected in incomplete establishment of anti-inflammatory responses, thus possibly contributing to the devastating rapidly progressive demyelination in cerebral adrenoleukodystrophy that only in rare cases arrests spontaneously. These findings emphasize monocytes/macrophages as crucial therapeutic targets for preventing or stopping myelin destruction in patients with X-linked adrenoleukodystrophy.


Figures

Figure 1
Figure 1
Transcriptome analysis reveals dysregulation of inflammatory pathways in monocytes of AMN patients. The complete transcriptome of primary CD14+ monocytes from AMN patients and healthy controls was obtained by RNA-Seq. RT-qPCR analysis of pro-inflammatory cytokine (TNFA, IL1B and IL6) expression in AMN and control monocytes cultured for 6 h with either 0.5 or 10 ng/ml LPS. See also Table 1. Left: Representative results of monocytes derived from one AMN patient and a matched healthy control, isolated and treated in parallel. Each bar represents the mean of two independent LPS treatments each measured in two technical replicates. Right: Pairwise comparisons (indicated by lines) of the response to LPS of AMN and corresponding healthy control monocytes isolated and treated in parallel (n = 5 each). The induction is depicted as the fold-increase in relative mRNA levels of TNFA, IL1B and IL6 obtained by high LPS (10 ng/ml) relative to low LPS (0.5 ng/ml) concentration. The mRNA levels were normalized to GAPDH, which is not induced by LPS. *P ≤ 0.05 (Wilcoxon-signed rank test); error bars = standard deviation; P = AMN patient; C = healthy control.
Figure 2
Figure 2
Deregulated gene expression pathways in AMN monocytes are reflected by recruitment of monocytes to perivascular cuffs in AMN spinal cord areas affected by myelopathy. (A) Heatmap of normalized read counts for genes found to be significantly deregulated in these cells. This list includes all genes with an adjusted P-value < 0.1 as determined by either edgeR or DESeq. Genes that were also deregulated in activated monocytes from AMN Patients P1 and P2 are underlined. P = AMN patient; C = healthy control. (B) Light microscopy images taken from the centre of cervical demyelinating lesions in post-mortem AMN spinal cord tissue. Left: Immunohistochemistry for MRP14 (early marker for activated monocytes/macrophages) detects infiltrating monocytes/macrophages. Right: Staining for the phagocytosis marker CD68 reveals the presence of macrophages and microglial cells. See also Table 1.
Figure 3
Figure 3
ABCD1 deficiency does not impair in vitro differentiation and pro- or anti-inflammatory polarization of monocyte-derived macrophages. (A) CD14+ monocytes isolated from the blood of AMN patients or healthy controls were differentiated with either GM-CSF or M-CSF for 7 days and subsequently either activated with LPS plus IFN-γ or IL-4, resulting in pro- or anti-inflammatory activation, respectively, or left untreated for additional 2 days. Pro-inflammatory (MHCII, CD80 and CD86) and anti-inflammatory (CD163, CD206) cell surface marker expression was assessed by flow cytometry. The dashed, vertical line represents the 1% threshold of the isotype control staining of AMN-derived macrophages. Histograms represent one out of three experiments with independent AMN and healthy control donor pairs. (B) Secreted levels of pro-inflammatory cytokines (TNFα, IL-1β, IL12p40 and IL-23) were measured in cell culture supernatants of LPS/IFN-γ activated GM-CSF differentiated macrophages, derived from blood monocytes isolated from three pairs of AMN patients and matched healthy controls and treated in parallel. The results are depicted with the level in patient samples relative to the matched controls (= 100%). (C) The concentrations of C26:0, C22:0 and C16:0 were determined by GC–MS in monocytes and in vitro differentiated and activated macrophages from one AMN patient and a matched healthy control. The relative amounts of C26:0 displayed as ratio to either C22:0 or C16:0 are shown. P = AMN patient; C = healthy control.
Figure 4
Figure 4
Macrophages derived from AMN patients only partially downregulate LPS-induced pro-inflammatory genes upon myelin phagocytosis. CD14+ bloodstream monocytes isolated from AMN patients or healthy controls were differentiated in vitro with M-CSF and subsequently activated with LPS for 24 h before incubation with or without myelin for additional 24 h. (A) The efficiency of myelin phagocytosis in AMN and healthy control macrophages was determined by FACS analysis after incubation with pHrodo®-Red labelled myelin for 6 h or 24 h. The mean fluorescence intensity of macrophages derived from isolated blood monocytes of three AMN patients and three healthy controls is depicted. *P ≤ 0.05, n.s. = not significant (two-tailed unpaired Student’s t-test). (B and C) The relative expression of IL12B/IL-12p40 and TNFA induced by LPS activation was measured by RT-qPCR without (B) or with (C) added myelin. The mRNA levels were normalized to the geometric mean of two reference genes, HPRT and HMG20B, which are not induced by LPS. In C, the normalized mRNA levels of control macrophages without myelin addition was set as 100%. For statistical analyses, logarithmic transformation was used to normalize the IL12B/IL-12p40 dataset. *P ≤ 0.05 (two-tailed unpaired Student’s t-test). P = AMN patient; C = healthy control.
Figure 5
Figure 5
Comparison of pro- and anti-inflammatory polarization markers on monocytes/macrophages and microglia in primary demyelinating CNS lesions in CALD and multiple sclerosis. (A) Primary CALD (Cases 1 and 3, one tissue section per patient; Case 2, two tissue sections; Case 4, three tissue sections; n = 4 cases) and multiple sclerosis brain lesions (one tissue section per patient, n = 6 cases) were stained with antibodies directed against the early activation marker MRP14, the macrophage/microglia phagocytosis marker CD68, the pro-inflammatory surface marker CD86 and the anti-inflammatory surface markers CD206 and CD163. The number of positively stained cells in the centre of primary lesions was counted manually under the light microscope. The cell density is depicted as boxplot (median ± interquartile range) comparisons between multiple sclerosis and CALD. For cases where more than one tissue section was counted, the mean was used for calculation. For statistical analysis, logarithmic transformation was used to normalize the distribution of MRP14 and CD206 positive data sets. *P ≤ 0.05 (two-tailed unpaired Student’s t-test). Coloured dots indicate the cases used for immunohistochemistry in C: red dot = childhood CALD Case 2; yellow dot = adult CALD Case 4; green dot = multiple sclerosis Case 9. (B) Number of cells expressing the activation markers CD86, CD206 and CD163, respectively, in relation to the total number of CD68 positive macrophages in the counted fields. For statistical analysis, logarithmic transformation was used to normalize the ratio data. *P ≤ 0.05 (two-tailed unpaired Student’s t-test). (C) Top row: Classical active multiple sclerosis brain lesion (Case 9); middle row: primary inflammatory childhood CALD brain lesion (Case 2); bottom row: primary inflammatory adult CALD spinal cord lesion (Case 4). The columns show immunohistochemical single staining for MRP14, CD68, CD86, CD206 and CD163, as used for the quantification in A. Arrows point to positive cells for which magnified views are shown in the insets. (D) Double immunohistochemistry for CD86 and CD206 in the same regions as shown in C. Arrowhead points to a double-positive macrophage, representing an intermediate inflammatory phenotype, which was observed in multiple sclerosis but hardly present in the CALD cases. Arrows point to the few CD206-single-positive cells detected in multiple sclerosis and CALD. Scale bars = 50 µm; inset scale bars = 25 µm.
Figure 6
Figure 6
Hypothetical model of the progression of CALD when compared to multiple sclerosis. In CALD, a reinforced destruction of myelin occurs that could be caused by a reduced capacity of pro-inflammatory enlarged lipid-laden macrophages to clear the injured site and induce remyelination.

References

    1. Anders S, Pyl PT, Huber W. HTSeq–a Python framework to work with high-throughput sequencing data. Bioinformatics 2015; 31: 166–9. - PMC - PubMed
    1. Berger J, Forss-Petter S, Eichler FS. Pathophysiology of X-linked adrenoleukodystrophy. Biochimie 2014; 98: 135–42. - PMC - PubMed
    1. Boven LA, Van Meurs M, Van Zwam M, Wierenga-Wolf A, Hintzen RQ, Boot RG et al. . Myelin-laden macrophages are anti-inflammatory, consistent with foam cells in multiple sclerosis. Brain 2006; 129 (Pt 2): 517–26. - PubMed
    1. Brück W, Porada P, Poser S, Rieckmann P, Hanefeld F, Kretzschmar HA et al. . Monocyte/macrophage differentiation in early multiple sclerosis lesions. Ann Neurol 1995; 38: 788–96. - PubMed
    1. Budka H, Sluga E, Heiss WD. Spastic paraplegia associated with Addison's disease: adult variant of adreno-leukodystrophy. J Neurol 1976; 213: 237–50. - PubMed

Publication types

MeSH terms

Substances