. 2018 Dec 15;84(12):867-880.
doi: 10.1016/j.biopsych.2018.04.009. Epub 2018 Apr 25.

Cocaine Self-administration Alters Transcriptome-wide Responses in the Brain's Reward Circuitry

Affiliations

Cocaine Self-administration Alters Transcriptome-wide Responses in the Brain's Reward Circuitry

Deena M Walker et al. Biol Psychiatry. .

Abstract

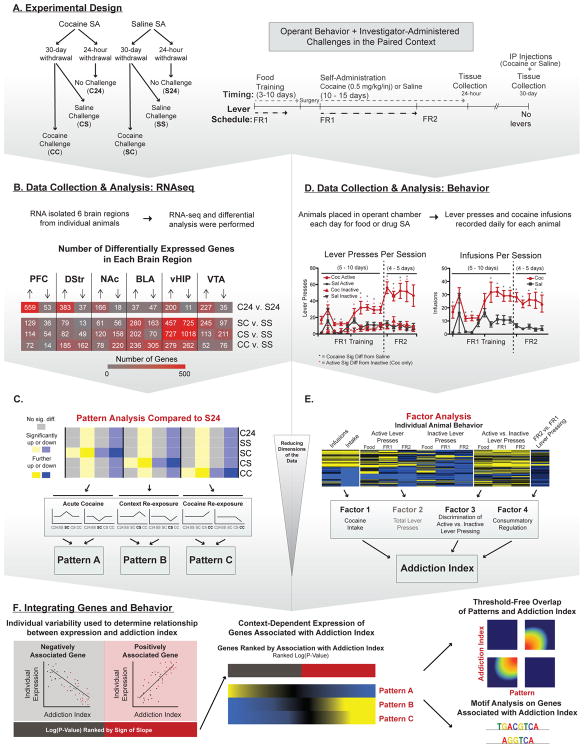
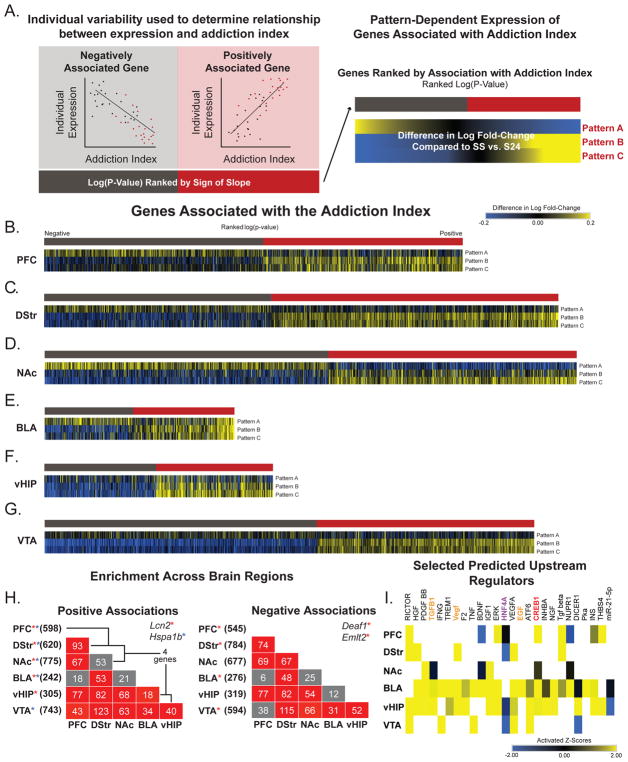
Background: Global changes in gene expression underlying circuit and behavioral dysregulation associated with cocaine addiction remain incompletely understood. Here, we show how a history of cocaine self-administration (SA) reprograms transcriptome-wide responses throughout the brain's reward circuitry at baseline and in response to context and/or cocaine re-exposure after prolonged withdrawal (WD).

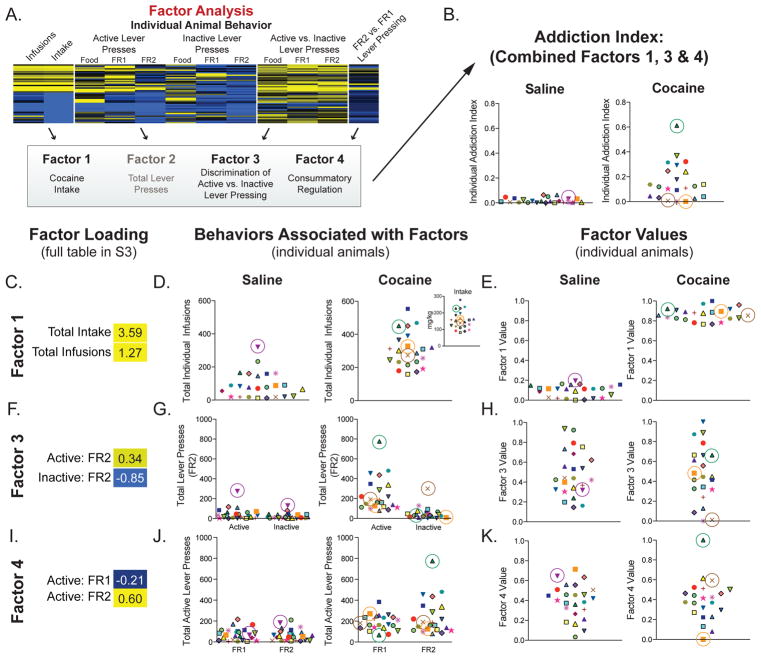
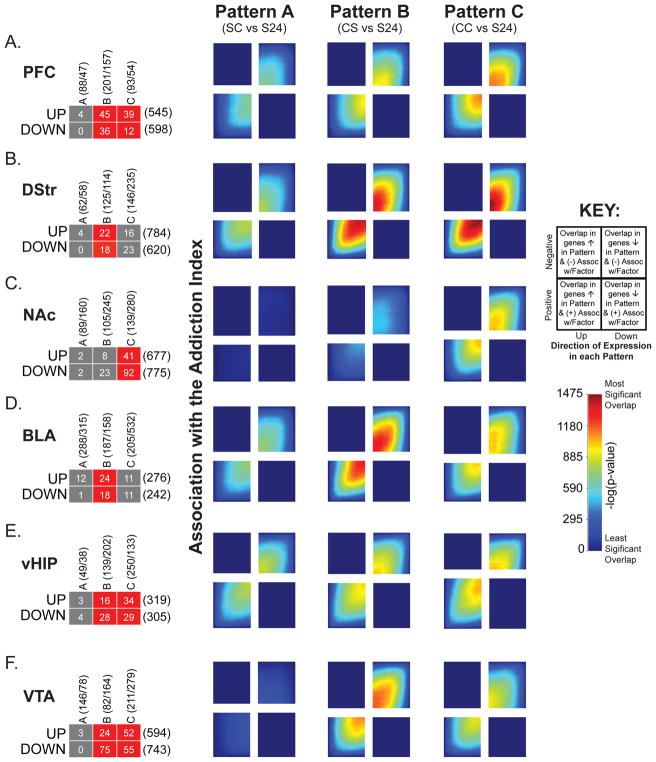
Methods: We assigned male mice to one of six groups: saline/cocaine SA + 24-hour WD or saline/cocaine SA + 30-day WD + an acute saline/cocaine challenge within the previous drug-paired context. RNA sequencing was conducted on six interconnected brain reward regions. Using pattern analysis of gene expression and factor analysis of behavior, we identified genes that are strongly associated with addiction-related behaviors and uniquely altered by a history of cocaine SA. We then identified potential upstream regulators of these genes.

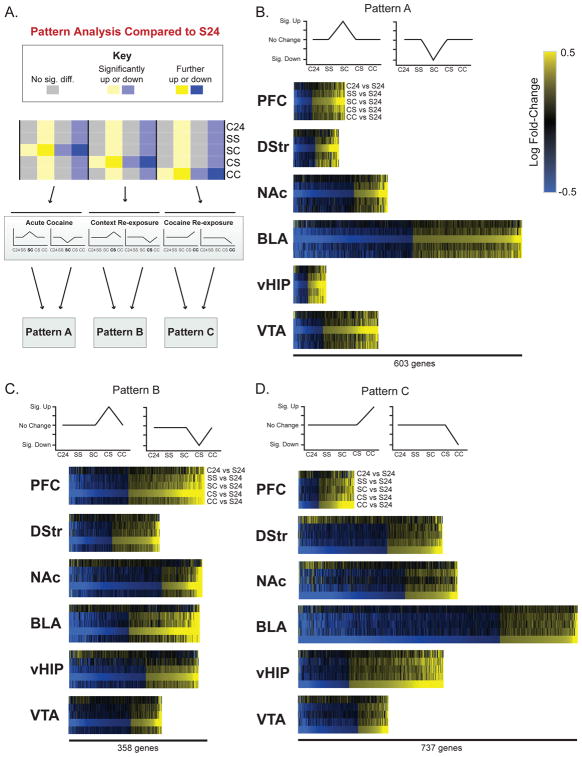
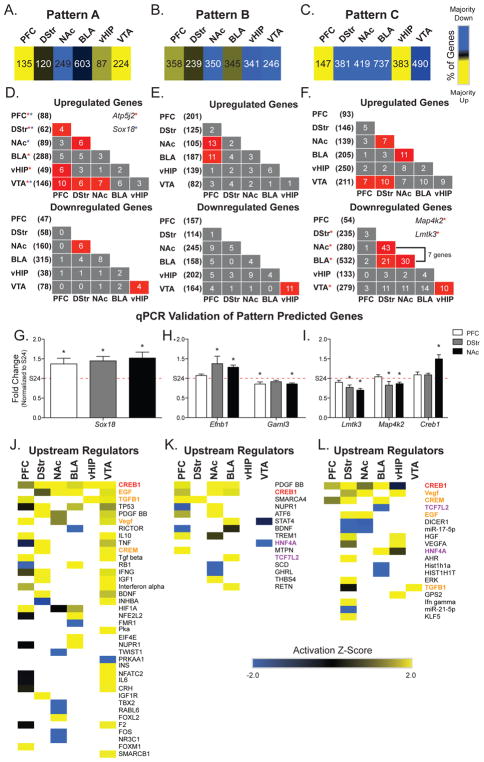
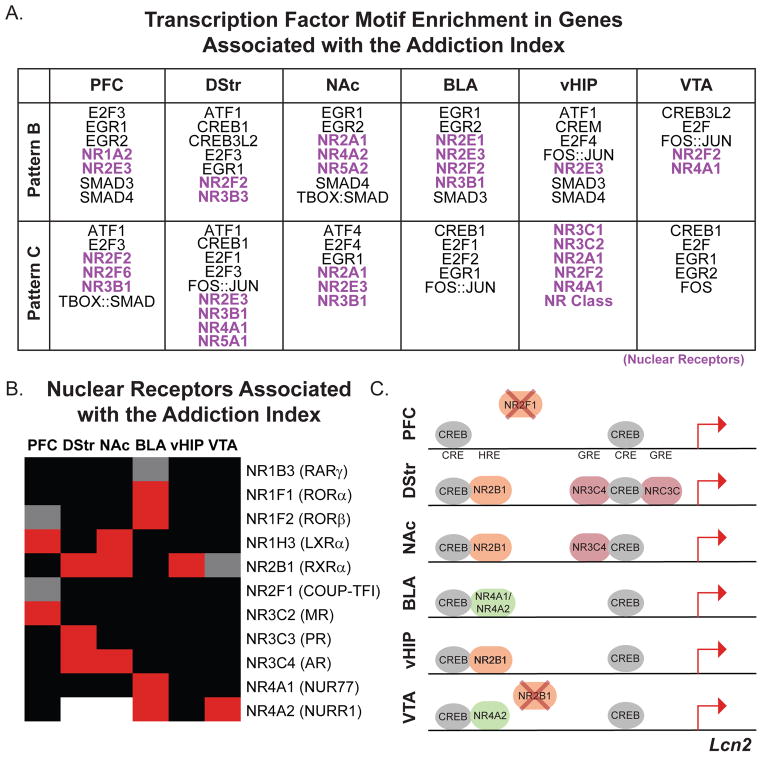
Results: We focused on three patterns of gene expression that reflect responses to 1) acute cocaine, 2) context re-exposure, and 3) drug + context re-exposure. These patterns revealed region-specific regulation of gene expression. Further analysis revealed that each of these gene expression patterns correlated with an addiction index-a composite score of several addiction-like behaviors during cocaine SA-in a region-specific manner. Cyclic adenosine monophosphate response element binding protein and nuclear receptor families were identified as key upstream regulators of genes associated with such behaviors.

Conclusions: This comprehensive picture of transcriptome-wide regulation in the brain's reward circuitry by cocaine SA and prolonged WD provides new insight into the molecular basis of cocaine addiction, which will guide future studies of the key molecular pathways involved.

Keywords: Basolateral amygdala; Dorsal striatum; Gene expression; Nucleus accumbens; Prefrontal cortex; RNA sequencing; Ventral hippocampus.


Figures

Figure 1
Figure 1. Outline of Experimental Approach and Bioinformatic Analyses
(A) Experimental design and summary of groups. Mice were food trained followed by 5–10 d of FR1 scheduling and 4–5 d of FR2. One group was euthanized 24 h after their last SA session while another cohort of animals were group housed in their home cage for 30 d. After WD, animals were given an injection of saline or cocaine and re-exposed to their original SA chamber for 1 h and euthanized immediately. (B) Data collection and RNA-seq data analysis. RNA-seq was performed on micro-dissections of 6 reward-associated brain regions. Differential expression analysis was performed to identify DEGs compared to their control group (S24 or SS). Number of DEGs per brain region are indicated (Red = greatest; Gray = least). (C) In an effort to identify genes that were uniquely altered by cocaine re-exposure we used pattern analysis and compared all groups to the same baseline (S24). Three patterns were investigated: Pattern A: genes uniquely altered by an initial dose of cocaine (SC; 1 h post-injection); Pattern B: genes uniquely altered by re-exposure to cocaine-paired context (CS); and Pattern C: genes uniquely altered by cocaine re-exposure (CC; 1 h post-injection). (D) Data collection and analysis of cocaine SA behavioral data. Because all animals (saline included), underwent varying numbers of SA trials at FR1, behavioral data was aligned to the day each animal transitioned onto an FR2 schedule (i.e., the last day on FR1). Therefore, data for days 5 - 10 of FR1, but not 1 -4, includes a majority of the animals in the study. In self-administering animals, cocaine (red) acted as a reinforcer as shown by increased active lever (solid line) vs. inactive lever (dotted line) responding on day 3 of FR1 (indicated by *). This did not occur for saline animals (black). Cocaine SA animals began pressing the active lever significantly more than saline (indicated by *) beginning on day 6 of FR1, which continued throughout FR2. Cocaine SA animals (red) received more infusions than their saline counterparts (black) and maintained the same number of infusions after switching to an FR2 schedule, indicating that cocaine was reinforcing lever pressing in these mice. (E) We generated an “addiction index” using exploratory factor analysis to reduce the multi-dimensional behavioral data to “factors” associated with components of cocaine SA behavior. We then combined the 3 factors most strongly associated with an addicted-like phenotype to differentiate between individual animals with high performance across multiple behavioral endpoints. (F) Integration of genes and behaviors to identify transcripts important for the addicted-like phenotype. Enrichment testing reveals transcripts regulated across multiple brain regions. In silico analysis of potential upstream regulators of the enriched genes. Rank-rank hypergeometric overlap used to determine if gene expression Patterns are associated with the addiction index within a brain region. Behavioral data were analyzed using Kruskal Wallis followed by Mann-Whitney Nonparametric Test; *p<0.05; **p<0.01; data are presented as mean ± SEM.
Figure 2
Figure 2. Gene expression Patterns associated with cocaine exposure
(A) To reduce the dimensions of our RNA-seq data and identify genes that were uniquely changed by a specific exposure paradigm, we used pattern analysis to categorize genes into Patterns of expression when compared to the same S24 baseline. Categorization of genes affected uniquely by: (B) an initial dose of cocaine (Pattern A); (C) re-exposure to the cocaine-paired context after 30 d WD from cocaine SA (Pattern B); (D) re-exposure to cocaine in the cocaine-paired context after 30 d WD from cocaine SA (Pattern C). Heatmaps show that, for all brain regions, expression of genes categorized in each Pattern is, by definition, most pronounced in the comparison that represents that Pattern (e.g., Pattern A most pronounced in SC vs S24 when compared to other groups).
Figure 3
Figure 3. Gene expression patterns associated with cocaine exposure reveal circuit-wide transcriptional changes and upstream regulators
(A–C) Number and percentage of genes up- and downregulated (yellow=>60% up; blue=>60% down) in each brain region for each of the three Patterns defined in Figure 2. (D–F) Overlap across brain regions of upregulated (top) and downregulated (bottom) genes, color-coded for significance. Total number of regulated genes in each region is shown in parentheses. Examples of transcripts up- or downregulated across more than two brain regions are listed in the insets. (G–I) Patterns were validated using qPCR on technical replicates. Patterns were validated for 8 transcripts across 3 brain regions. Representative transcripts from each pattern are presented. Fold-changes of at least 15% in the RNA-seq data were validated using qPCR across all patterns analyzed, supporting use of this fold-change in all analyses. (J–L) Upstream regulator analysis was conducted across brain regions for each Pattern. Five upstream regulators were consistently predicted to regulate genes across brain regions: CREB1 (highlighted in red) is a predicted upstream regulator of all Patterns. Regulators overlapping between Patterns A and C are highlighted in orange and are likely indicative of those important for regulating the response to acute cocaine exposure independent of a history of cocaine SA. Regulators overlapping between Patterns B and C are highlighted in purple and are likely indicative of those important for regulating the response to a cocaine-paired context after a history of cocaine SA. Activation Z-Scores in heatmaps: positive (yellow) = overrepresentation of targets activated by regulator; negative (blue) = overrepresentation of targets repressed by regulator; no direction (black) = no significant enrichment of activated versus repressed targets; white = not a predicted upstream regulator. *p<0.05; **p<0.01; * * = transcripts overlap across multiple brain regions.
Figure 4
Figure 4. Generation of an “addiction index” for individual animals
(A–B) Exploratory factor analysis on multiple behavioral endpoints reduced multi-dimensional behavioral data to 8 “factors.” A composite score, or “addiction index (AI),” of those factors most strongly associated with behaviors reflective of an addicted-like phenotype was generated using the individual transformed data for Factors 1, 3, & 4. (C–K) Data for individual animals for each behavior and each factor are presented. Each animal is represented by the same unique shape and color. (C, F, I) Factor loading, or associations, of Factors 1, 3, & 4 with SA behaviors (yellow = positive; blue = negative) are presented. (D, G, J) Individual data presented for the behaviors associated with each factor. (D) Factor 1 associated with intake and infusions; (G) Factor 3 is positively associated with active lever and negatively associated with inactive lever under an FR2 schedule; (J) Factor 4 is positively associated with FR2 lever presses and negatively associated with lever pressing on an FR1 schedule. (E, H, K) Individual transformed data for Factors 1 (E), 3 (H) and 4 (K). The product of these values was calculated to generate an AI for each individual. An animal must display high performance on all three factors (▲) to have a high AI. By contrast, if an animal performs poorly on one of the behaviors (× or ■) their AI is lower.
Figure 5
Figure 5. Genes associated with the AI are reprogrammed by cocaine SA to be responsive to drug or cocaine-paired context
(A) Linear modeling was used to identify genes associated with the AI within each brain region. Only genes with a slope of at least ±15% and a nominal p<0.05 were investigated. Similar to the gene expression Patterns (Figure 2), we observed that directional changes in expression were similar across all re-exposure comparisons (SS, SC, CS & CC vs. S24). Genes that were negatively associated with AI (gray bar) were downregulated and genes positively associated with AI (red bar) were upregulated (Supplemental Table S4). (B–G) Heatmaps were transformed to indicate change in expression from SS controls. Blue = fold change in the negative direction from SS vs. S24 and yellow = fold change in the positive direction from SS vs. S24. Cocaine SA programs those transcripts associated with AI to be hyper-response to context either with or without drug. (H) Overlap of genes positively (left) or negatively (right) associated with AI across brain regions, color-coded for significance. Total number of genes in each brain region listed in parentheses and total number of genes overlapping between regions indicated in corresponding boxes. There is significant overlap of genes associated with the AI across most brain regions. (I) Upstream regulator analysis reveals similar putative transcriptional regulators in genes associated with AI as those associated with specific gene expression Patterns. Colors correspond to regulators overlapping in multiple Patterns (see Figure 3). Activation Z-Scores: positive (yellow) = overrepresentation of targets activated by regulator; negative (blue) = overrepresentation of targets repressed by regulator; no direction (black) = no significant enrichment of activated or repressed targets; white = not a predicted upstream regulator.
Figure 6
Figure 6. Overlap of transcriptional profiles related to the AI and gene expression Patterns reveals which Pattern contributes most to AI
A–F) Overlap of genes positively or negatively associated with AI and also up- or downregulated within each gene expression Pattern within the gene lists filtered for significance (Fisher’s exact test; left) or transcriptome-wide expression profiles (RRHO plots; right). Overlap of genes associated with AI are specific to brain regions. For example, significant overlap of up- and downregulated genes across Patterns B & C with AI are observed in PFC and VTA. vHIP. BLA and DStr are enriched in genes in Pattern B and NAc only shows enrichment of genes in Pattern C. RRHO plots to the right of each panel reveal significance of overlap between region-specific transcriptional profiles associated with AI for Patterns A–C. A key for these plots is shown to the right.
Figure 7
Figure 7. Motif analysis reveals putative role for NRs in controlling region-specific cocaine-induced gene expression
(A) HOMER motif analysis was conducted on genes defined as either Pattern B or C and significantly associated with the AI (lists from Figure 6 enrichment tests). Table of putative transcription factor families whose motifs were enriched in at least 4 of 6 brain regions. Members of the NR family were predicted upstream regulators in all brain regions and were Pattern-specific. (B) NR family members are positively (red) and negatively (gray) associated with the AI in a region-specific manner. Black indicates no association and white indicates no detectable expression. Only NRs with a significant association in at least one brain region are displayed. (C) Hypothetical model of transcriptional co-regulation by CREB and NRs in a gene positively associated with AI across all brain regions (VTA = trend). In silico analysis of transcription factor binding sites, identified using MatInspector, indicate motifs in close proximity to each other (less than 50 bp), and binding data from the MatInspector database indicate binding of specific NRs within the Lcn2 promoter. Based on our AI data, we extrapolated possible region-specific binding states that could be regulating the transcriptional response to drug or context re-exposure. Color indicates subfamily of NRs: orange = NR2 subfamily; pink = NR3 subfamily; green = NR4 subfamily. X = negative association with AI.

Comment in

References

    1. Hyman SE, Malenka RC, Nestler EJ. Neural mechanisms of addiction: the role of reward-related learning and memory. Annu Rev Neurosci. 2006;29:565–598. - PubMed
    1. Koob GF, Volkow ND. Neurobiology of addiction: a neurocircuitry analysis. Lancet Psychiatry. 2016;3:760–773. - PMC - PubMed
    1. Koob GF, Caine SB, Parsons L, Markou A, Weiss F. Opponent process model and psychostimulant addiction. Pharmacol Biochem Behav. 1997;57:513–521. - PubMed
    1. Wang JQ, McGinty JF. Glutamate-dopamine interactions mediate the effects of psychostimulant drugs. Addict Biol. 1999;4:141–150. - PubMed
    1. White FJ, Kalivas PW. Neuroadaptations involved in amphetamine and cocaine addiction. Drug Alcohol Depend. 1998;51:141–153. - PubMed

Publication types