. 2018 Jun 7;70(5):842-853.e7.
doi: 10.1016/j.molcel.2018.04.023. Epub 2018 May 31.

Heterochromatin-Encoded Satellite RNAs Induce Breast Cancer

Affiliations

Heterochromatin-Encoded Satellite RNAs Induce Breast Cancer

Quan Zhu et al. Mol Cell. .

Abstract

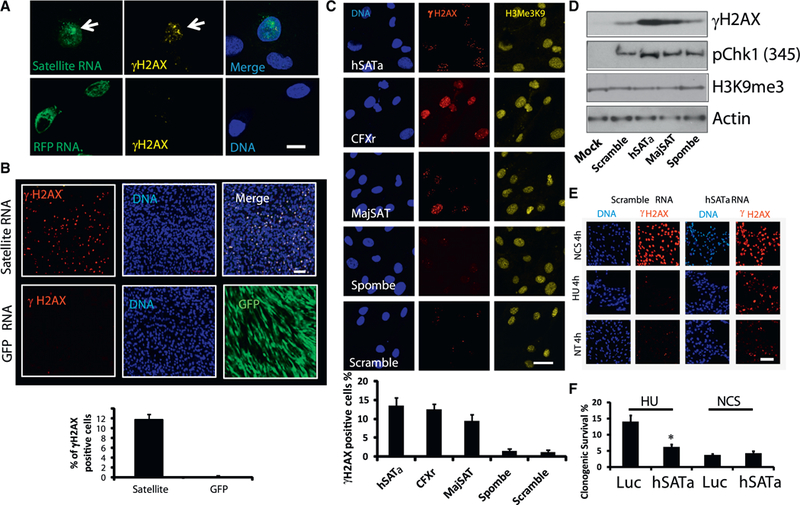
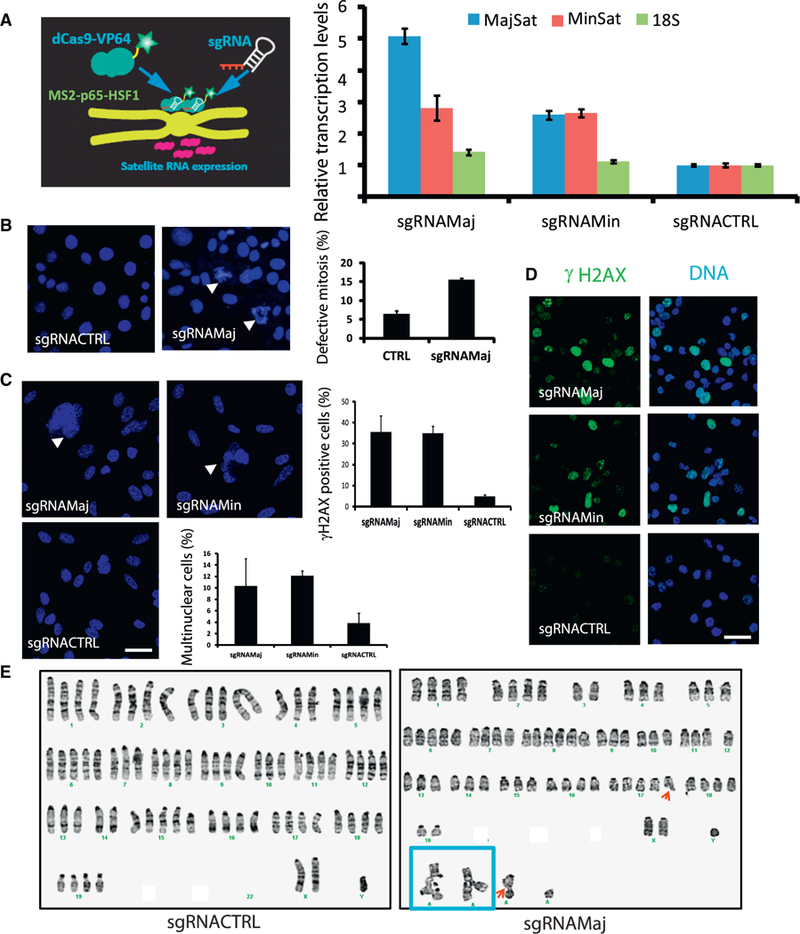
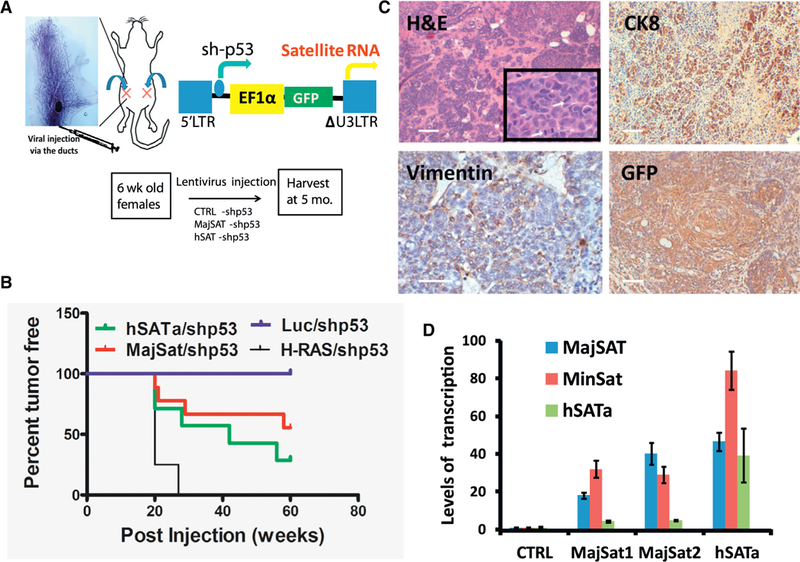
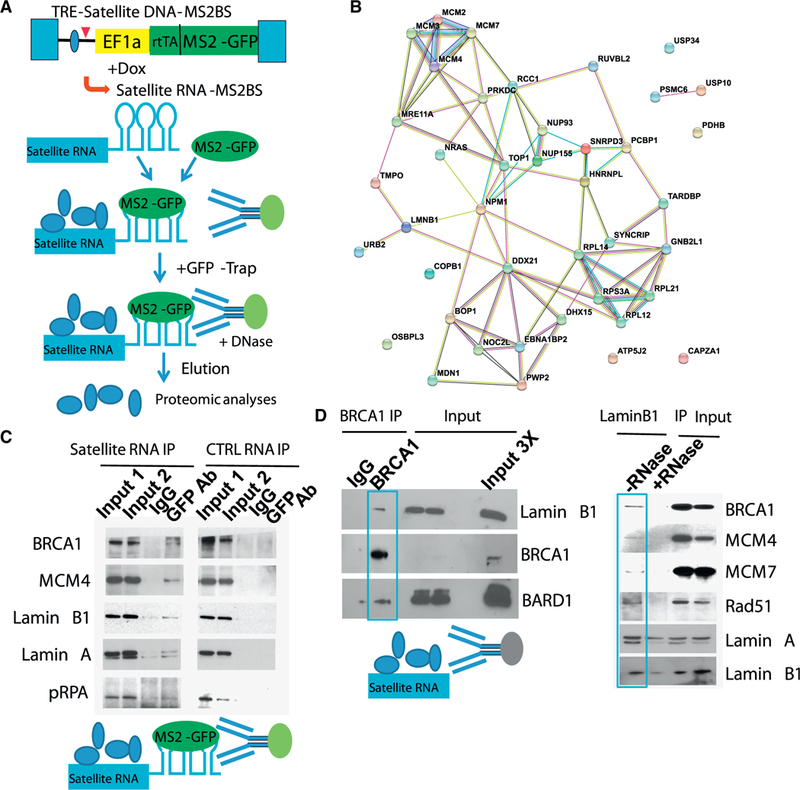
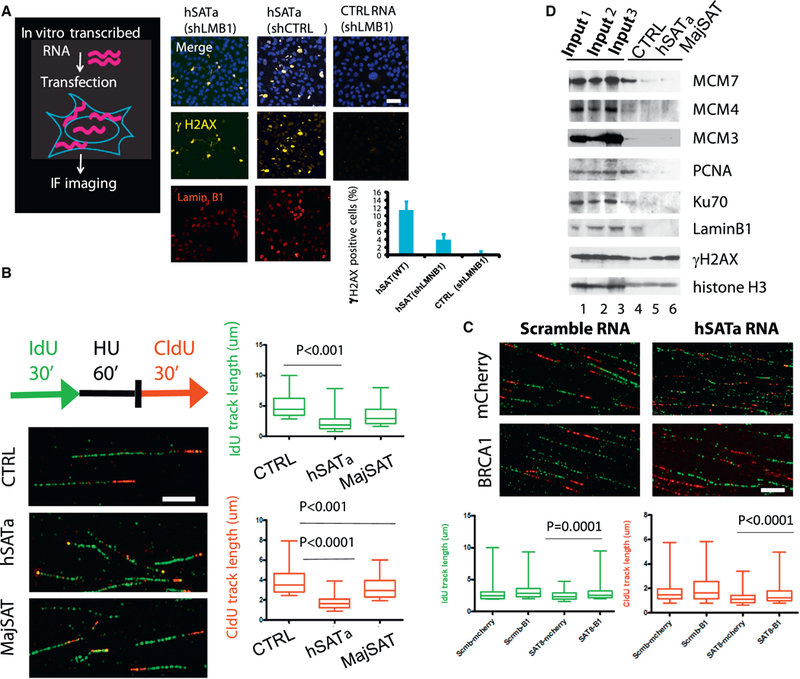
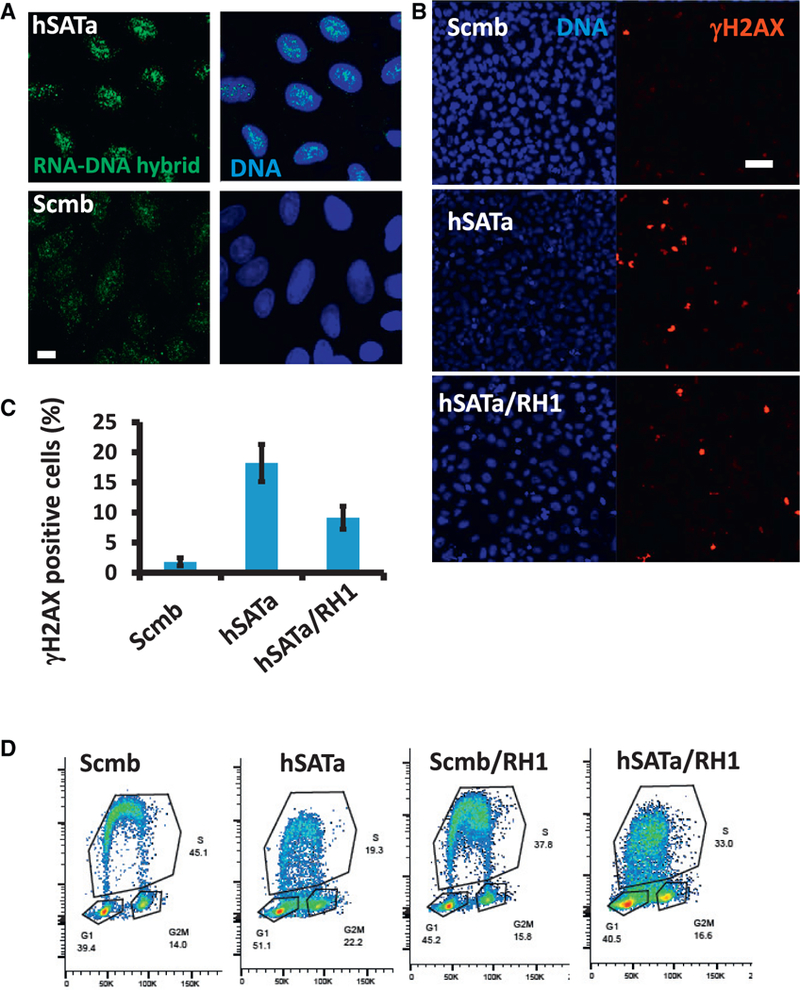
Heterochromatic repetitive satellite RNAs are extensively transcribed in a variety of human cancers, including BRCA1 mutant breast cancer. Aberrant expression of satellite RNAs in cultured cells induces the DNA damage response, activates cell cycle checkpoints, and causes defects in chromosome segregation. However, the mechanism by which satellite RNA expression leads to genomic instability is not well understood. Here we provide evidence that increased levels of satellite RNAs in mammary glands induce tumor formation in mice. Using mass spectrometry, we further show that genomic instability induced by satellite RNAs occurs through interactions with BRCA1-associated protein networks required for the stabilization of DNA replication forks. Additionally, de-stabilized replication forks likely promote the formation of RNA-DNA hybrids in cells expressing satellite RNAs. These studies lay the foundation for developing novel therapeutic strategies that block the effects of non-coding satellite RNAs in cancer cells.

Keywords: BRCA1-associated proteins; DNA damage response; breast tumor formation; heterochromatic RNAs; satellite RNAs.


Figures

Figure 1.
Figure 1.. Satellite RNA Is Sufficient to Induce a DNA Damage Response
(A) Microinjection of in vitro-synthesized satellite RNA into primary human fibroblasts induces the accumulation of γH2AX. Seven hr after injection of fluorescein isothiocyanate (FITC)-labeled satellite RNA hSATa (top) or RFP RNA (bottom), the cells were fixed, immunostained, and imaged. Green, RNA; yellow, γH2AX; blue, DAPI. Scale bar, 10 γm. (B) Transfection of in vitro-synthesized satellite RNA into primary human fibroblasts induces accumulation of γH2AX. Sixteen hr after transfection of satellite RNA hSATa (top) or GFP RNA (bottom), the cells were fixed, immunostained, and imaged. Green, GFP; red, γH2AX. Scale bar, 50 μm. (C) The effect of satellite RNAs with different sequences on γH2AX accumulation. Transfected RNAs are indicated. Scale bar, 10 μm. (D) Western blot analyses of protein lysates after RNA transfection. (E and F) Satellite RNA-overexpressing cells are more sensitive to DNA replication stress (HU treatment) than to DNA DSBs (NCS treatment). (E) Immunofluorescence staining of satellite RNA-transfected human osteosarcoma cells (U2OS). Red, γH2AX. Scale bar, 50 μm. (F) Clonogenic survival assay of U2OS cells infected with lentiviruses expressing either satellite RNAs or a control RNA. Cells were treated with 3 mM HU or 1 μg/mL NCS for 24 hr and then grown into colonies for 8 to 10 days. Clonogenic survival is shown as the percentage of respective untreated cells. Values represent the mean of three independent experiments, and error bars represent the SEM. The asterisk indicates the significance level in two-tailed t tests (*p < 0.01). See also Figures S1–S3 and Table S1.
Figure 2.
Figure 2.. CRISPR-Mediated Activation of Satellite RNA Expression Induces Chromosomal Instability
(A) Left: a diagram demonstrating that dCas9 mediates activation of endogenous satellite RNAs. Right: qRT-PCR experiments show that the expression of satellite RNAs is activated in cells expressing guide RNAs targeting mouse satellite RNAs. (B–D) Activation of satellite RNAs induces(B) mitotic defects, (C) formation of multi-nucleated cells and micronuclei, and (D) γH2AX accumulation, as shown by representative fluorescence images. Bar graphs (left) represent the mean values from three randomly chosen fields of view; more than 50 cells were quantified per field of view. Data shown are representative of 3 independent experiments. (A–D) Error bars represent the SEM. Mouse breast cancer cell line 67 NR was used in (A)–(D). (E) chromosomal abnormalities as determined by karyotyping analysis in a mouse lung cancer cell line (Xia et al., 2014). Left: sgRNACTRL. Right: sgRNAMaj. Red arrows, chromosome breaks; blue box, chromosome radial formation. Scale bars, 10 μm. See also Figure S3.
Figure 3.
Figure 3.. Ductal Injection of Lentiviruses Overexpressing Satellite RNA Induces Tumor Formation in the Mammary Gland
We injected 1 × 10⁶ virus particles in 10 μL of PBS and 0.2% of trypan blue with a Hamilton syringe into the duct of the number 4 mammary gland in a 6-to8-week-old female mouse according to the protocol described previously (Krause et al., 2013). (A) Top: the ductal injection of lentiviruses into the number 4 mammary glands. Bottom left: the lentiviral vector for overexpressing satellite RNA. Bottom right: representative image of mammary glands or tumors harvested from mice 5 months after the injection. (B) Kaplan-Meier survival curves in mice injected with lentivirus-overexpressing satellite RNAs or control RNA using a log rank (Mantel-Cox) test. p < 0.0001. (C) H&E (top) and IHC staining (bottom) of tumor sections. Tumors resulted from the infection of satellite RNA-expressing lentiviruses. (D) qRT-PCR analysis of tumors from mice injected with satellite RNA-expressing lentiviruses. Error bars represent SEM. Scale bars, 100 μm. See also Table S2.
Figure 4.
Figure 4.. Mass Spectrometry Experiments Identified Proteins that Bind Satellite RNAs
(A) A diagram of the workflow. (B) The protein-protein interaction network pulled down using satellite RNA is positively correlated with BRCA1 function (visualized with StringDB). (C) RNA IP followed by western blotting confirmed the binding of satellite RNA to the proteins, as indicated, but not a control RNA. (D) Co-IP followed by western blotting revealed (left) interaction between BRCA1 and Lamin B1, as shown by BRCA1 IP. BARD1 is shown as a positive control for BRCA1 interaction. Right: interactions between Lamin B1 and the indicated factors. GFP-Trap was used to pull down Lamin B1 in a LaminB1-GFP knockin U2OS cell line (the controls are IgG proteins from rabbits, mice, or rats instead of alpaca, from which the GFP antibody is derived). See also Figure S4 and Table S3.
Figure 5.
Figure 5.. Satellite RNA Overexpression-Induced Genomic Instability Is Mediated through Protein-Binding Partners
(A) Lamin B1 is required for the satellite RNA-mediated DNA damage response. U2OS cells were stably infected with lentiviruses expressing shRNA targeting Lamin B1 (shLMB1) or non-targeting shRNA (shCTRL) prior to transfection of satellite RNA or a control scrambled RNA. Sixteen hr after transfection, cells were fixed, immunostained, and imaged. Yellow, γH2AX; red, Lamin B1. Scale bar, 50 μm. (B) The DNA fiber assay was used to analyze the stability of DNA replication forks. Replication forks were labeled in U2OS cells infected with lentiviruses overexpressing hSATa or MajSAT or a control Luc RNA, respectively, with IdU and CldU before (green) and after (red) HU stalling (3 mM, 1 hr), as indicated in the scheme. DNA fibers were prepared on glass slides, and tracks of labeled DNA were detected by immunofluorescent staining. Replication track lengths (n > 100) were measured and are shown as boxplots. Green tracks of control (CTRL): 4.950 μm ± 0.07980, n = 523; hSATa: 2.365 μm ± 0.08680, n = 297; MajSAT: 3.475 μm ± 0.07494, n = 523. Red tracks of CTRL: 3.902 μm ± 0.06607, n = 393; hSATa 1.799 mm ± 0.07122, n = 103; MajSAT: 3.278 μm ± 0.05516, n = 393. The p values from unpaired two-tailed t test are shown. Scale bar, 5 μm. (C) Overexpression of BRCA1 (B1) by transient transfection rescued DNA replication fork defects in satellite RNA-overexpressing cells. The DNA fiber assay was performed as in (B), but a plasmid overexpressing human BRCA1 protein or an mCherry protein as CTRL was transfected into U2OS cells 8hr before satellite RNA or a scrambled RNA transfection prior to HU treatment and DNA fiber preparation. Replication track lengths (n > 100)were measured and are shown as boxplots. The p values from two-tailed t test are shown. Scale bar, 10 μm. (D) iPOND assay followed by western blotting showed that satellite RNA overexpression significantly reduced the amount of proteins bound to DNA replication forks. Fork-associated proteins were purified from CTRL or hSATa- or MajSAT-overexpressing U2OS cells by iPOND after stalling with HUfor1 hr. Western blots from EdU pull-down were probed with the indicated antibodies. 1% of each cell lysate was loaded as input (1, 2, and 3 in lanes 1, 2, and 3, respectively) of each captured sample (CTRL, hSATa, and MajSAT in lanes 4, 5, and 6, respectively). See also Figure S5
Figure 6.
Figure 6.. Satellite RNA-Mediated RNA-DNA Hybrid Formation and γH2AX Accumulation Are Sensitive to RNase H Treatment.
U2OS cells were infected with Dox-inducible RNase H1-expressing lentiviruses prior to RNA transfection with either satellite RNA or a scrambled RNA. (A) Increased levels of RNA-DNA hybrids in hSATa-transfected cells as shown by S9.6 antibody staining and imaged by confocal microscopy. Scale bar, 10 μm. (B and C) Cells were fixed and immunostained with γH2AX antibody (B). The number of γH2AX staining foci were quantified with Imaris software and are plotted in (C). Scale bar, 50 μm. (D) Cell cycle analysis of satellite RNA-transfected U2OS cells as stained by Click-IT chemistry and DAPI in flow cytometry. The boxed S phase areas indicate differences compared with hSATa RNA transfection. See also Figure S6.

References

    1. Aguilera A, and Gómez-González B (2008). Genome instability: a mechanistic view of its causes and consequences. Nat. Rev. Genet. 9, 204–217. - PubMed
    1. Altemose N, Miga KH, Maggioni M, and Willard HF (2014). Genomic characterization of large heterochromatic gaps in the human genome assembly. PLoS Comput. Biol. 10, e1003628. - PMC - PubMed
    1. Bersani F, Lee E, Kharchenko PV, Xu AW, Liu M, Xega K, MacKenzie OC, Brannigan BW, Wittner BS, Jung H, et al. (2015). Pericentromeric satellite repeat expansions through RNA-derived DNA intermediates in cancer. Proc. Natl. Acad. Sci. USA 112, 15148–15153. - PMC - PubMed
    1. Bertone P, Stolc V, Royce TE, Rozowsky JS, Urban AE, Zhu X, Rinn JL, Tongprasit W, Samanta M, Weissman S, et al. (2004). Global identification of human transcribed sequences with genome tiling arrays. Science 306,2242–2246. - PubMed
    1. Birney E, Stamatoyannopoulos JA, Dutta A, Guigó R, Gingeras TR, Margulies EH, Weng Z, Snyder M, Dermitzakis ET, Thurman RE, et al.; ENCODE Project Consortium; NISC Comparative Sequencing Program; Baylor College of Medicine Human Genome Sequencing Center; Washington University Genome Sequencing Center; Broad Institute; Children’s Hospital Oakland Research Institute (2007). Identification and analysis of functional elements in 1% of the human genome by the ENCODE pilot project. Nature 447, 799–816. - PMC - PubMed

Publication types

MeSH terms