. 2018 Jun 11;33(6):1128-1141.e7.
doi: 10.1016/j.ccell.2018.05.002. Epub 2018 May 31.

The SS18-SSX Fusion Oncoprotein Hijacks BAF Complex Targeting and Function to Drive Synovial Sarcoma

Affiliations

The SS18-SSX Fusion Oncoprotein Hijacks BAF Complex Targeting and Function to Drive Synovial Sarcoma

Matthew J McBride et al. Cancer Cell. .

Abstract

Synovial sarcoma (SS) is defined by the hallmark SS18-SSX fusion oncoprotein, which renders BAF complexes aberrant in two manners: gain of SSX to the SS18 subunit and concomitant loss of BAF47 subunit assembly. Here we demonstrate that SS18-SSX globally hijacks BAF complexes on chromatin to activate an SS transcriptional signature that we define using primary tumors and cell lines. Specifically, SS18-SSX retargets BAF complexes from enhancers to broad polycomb domains to oppose PRC2-mediated repression and activate bivalent genes. Upon suppression of SS18-SSX, reassembly of BAF47 restores enhancer activation, but is not required for proliferative arrest. These results establish a global hijacking mechanism for SS18-SSX on chromatin, and define the distinct contributions of two concurrent BAF complex perturbations.

Keywords: ATP-dependent chromatin remodeling; SWI/SNF (BAF) complexes; bivalency; chromatin; enhancers; fusion oncoprotein; pediatric cancer; polycomb; synovial sarcoma.


Figures

Figure 1.
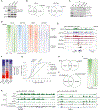
Figure 1.. SS18-SSX Drives Genome-Wide Retargeting of BAF Complexes to Broad Domains
(A) Immunoblot for BRG1, BAF155, SS18, BAF47, and GAPDH performed on Aska SS cell whole-cell extracts in shCt and shSSX conditions (using two distinct shRNAs targeting SSX). (B) Venn diagram of SS18 (left) and BAF155 (right) ChIP-seq peaks in shCt and shSSX conditions in Aska cells. (C) IPs for BRG1, BAF250A (BAF complex-specific), and BAF200 (PBAF complex-specific) using nuclear extracts from Aska cells. (D) Heatmaps of SS18, BAF155, BRG1, and BAF200 occupancy in Aska shCt and shSSX conditions over all SS18 peaks in shCt or shSSX conditions (32,077),ranked by log2(fold change) in SS18 occupancy. (E) Example SS18, BAF155, BRG1, BAF200, RNA Pol II, ChIP-seq, and RNA-seq tracks at the FOXC1 locus in Aska cells in shCt and shSSX conditions. (F) Distance to TSS graph for shCt-only (shSSX-lost), shCt-shSSX shared, and shSSX-only (shSSX-gained) SS18 peaks in Aska cells. (G) Cumulative distribution function of ChIP-seq peak widths for shCt-only, shCt-shSSX shared, and shSSX-only SS18 peaks in Aska cells, and SS18 peaks in CRL7250 cells. (H) Venn diagram of SS18 peaks in shCt and shSSX conditions in SYO1 SS cells. (I) Heatmaps of SS18 occupancy in SYO1 shCt and shSSX conditions over all SS18 peaks in shCt or shSSX conditions (17,111), ranked by log2(fold change) in SS18 occupancy. (J) Venn diagram of V5 peaks in V5-SS18 WT and V5-SS18-SSX1 expressing conditions in CRL7250 fibroblast cells. (K) Example SS18 and V5 tracks at the SOX8 and CAV1 loci in Aska and SYO1 shCt and shSSX conditions, as well as CRL7250 in V5-SS18 WT and V5-SS18-SSX1 conditions. See also Figure S1.
Figure 2.
Figure 2.. Concordant Direct Regulation by SS18-SSX-Containing BAF Complexes across SS Cell Lines
(A) Immunoblot for SS18, BAF47, and GAPDH performed on whole-cell extracts from Aska (biphasic, SS18-SSX1), SYO1 (biphasic, SS18-SSX2), and HSSY2 (monophasic, SS18-SSX1) cells in shCt and shSSX conditions. (B) Venn diagram of significantly changed genes in Aska, SYO1, and HSSY2 cells by RNA-seq upon SS18-SSX knockdown. (C) Hierarchical clustering of log2(fold change) in gene expression (RNA-seq) for Aska, SYO1, and HSSY2 cells in shCt and shSSX conditions over the shared 568 significantly changed genes, as shown in (B). n = 2 biological duplicates for each condition. Significantly upregulated (n = 351) or downregulated (n = 177) genes across all three cell lines are noted. (D and E) Log2(fold change) (log2FC) in expression of genes that are consistently regulated (D) and differentially regulated (E) across Aska, SYO1, and HSSY2 cells in shCt and shSSX conditions. n = 2 biological duplicates for each condition. (F) GO term analysis of shared upregulated genes (red) and downregulated genes (blue) following SS18-SSX knockdown. Number of genes in each category indicated in parentheses. (G) Plot of –log10(p value) versus log2FC in gene expression in Aska shCt versus shSSX conditions. Significantly changed shCt-only SS18 targets (blue) and shSSX-only SS18 targets (red) are labeled with density plot (right) reflecting SS18 ChIP-seq density in each condition. (H) Pie chart of significantly downregulated genes upon SS18-SSX knockdown in Aska cells (n = 830) showing the proportion of downregulated genes that are unique shCt-only SS18 (SS18-SSX) targets (blue) and downstream secondary targets (grey) in Aska cells. (I) GO term analysis of SS18-SSX primary target genes (n = 289) and secondary non-target genes (n = 541) downregulated upon SS18-SSX knockdown (n = 830) in Aska. Number of genes in each category indicated in parentheses. (J) Overlap of primary SS18-SSX targets in Aska and SYO1 cells significantly downregulated upon SS18-SSX knockdown. (K) Example SS18 ChIP-seq and RNA-seq tracks for Aska and SYO1 in shCt and shSSX conditions at the SOX8 and PAX3 loci. See also Figure S2.
Figure 3.
Figure 3.. SS Is Transcriptionally Distinct from Other Malignancies with Hallmark BAF Complex Perturbations
(A) Each dot represents a tumor-normal pair from whole-exome sequencing. The y-axis indicates the non-synonymous mutation frequency in each sample. Tumor types are ordered by their median mutation frequency, indicated by the horizontal yellow line. SS samples are highlighted in red. Abbreviations are for tumor samples in (Lawrence et al., 2014) and (Cancer Genome Atlas Research Network, 2011). (B) Tumor types characterized by BAF complex gene perturbations used in RNA-seq clustering analyses in (C–E). Subunit affected and numbers of cases analyzed are represented. (C) Principal component analysis of the top 5% most variable genes for tumor samples in (B) with SS highlighted in green. (D) Z score expression of genes correlated most (|PCC| > 0.5) positively (top, red, n = 346) or negatively (bottom, blue, n = 110) with PC1, from top 5% most variable genes, with samples ranked by PC1 scores. Example genes are labeled on the right. (E) GO term analysis of SS (346 genes, red) and other BAF-mutant tumor (110 genes, blue) gene signatures. Number of genes in each category indicated in parentheses. (F) NMF clustering of SS RNA-seq samples (n = 64) reveals two major transcriptional subgroups. (G) Box plot of gene expression levels (reads per kilobase million [RPKM]) for subgroup markers SOX2, MYC, PAX7, and PAX3, with groups corresponding to those in (F). ***p <0.001, **p <0.01, *p <0.05 by two-tailed t test. For boxplots, box represents interquartile range, the horizontal line inside the box represents the median, whiskers extend to extremes, and individual values are shown. (H) Scatterplots reflecting exclusivity of MYC and PAX7 gene expression in SS primary samples, with groups corresponding to those in (F). (I) Binary calls for TMA immunohistochemical staining (black, positive; gray, negative) for SOX2, MYC, PAX7, and PAX3 in SS TMA cases (n = 186). (J) Representative images of immunohistochemical stains for SOX2, MYC, PAX7, and PAX3 on SS TMA. Scale bar, 25 μm. See also Figures S3 and S4, Tables S1 and S2.
Figure 4.
Figure 4.. SS18-SSX Directs BAF Complexes to Broad Polycomb Domains to Activate Bivalent Genes
(A) Example tracks of co-occupancy of BAF complexes (SS18, BRG1, and BAF155) and PRC2 complexes (SUZ12 and H3K27me3), with activation marks (H3K4me3, RNA Pol II, and RNA-seq) at the PAX3 locus in Aska cells. (B) Venn diagram of SS18 peaks in shCt and shSSX conditions with SUZ12 peaks in shCt condition in Aska cells. (C) Venn diagram of V5 peaks in V5-SS18 WT and V5-SS18-SSX1 conditions with SUZ12 peaks in V5-SS18 WT condition in CRL7250 fibroblast cells. (D) Metagene plots of Aska shCt-only SS18 sites (n = 8,610) split by broad (≥10 kb width) and narrow (<10 kb width) in shCt and shSSX conditions for SS18, SUZ12, H3K27me3, and H3K4me3 occupancy. (E) Venn diagram of bivalent genes (dually marked by H3K4me3 and H3K27me3) in shCt and shSSX conditions in Aska cells. (F) Breakdown of SS18-SSX primary target genes and secondary non-target genes by promoter status in shCt and shSSX conditions in Aska cells. (G) Example SS18, BAF155, SUZ12, H3K27me3, H3K4me3, RNA Pol II, and RNA-seq tracks at the FOXC1, ZIC5, and ZIC2 loci shows SS18-SSX-mediated gene activation and that RNA Pol II recruitment is dependent on basal H3K4me3 levels. See also Figure S5.
Figure 5.
Figure 5.. BAF47 Reincorporation Restores Enhancer Activation but Is Dispensable for Proliferative Arrest
(A) Schematic depicting BAF complex perturbations in SS (SS18-SSX1/2/4) and malignant rhabdoid tumor (SMARCB1/). (B) Input blot of whole-cell extracts from Aska WT and BAF47-deficient (BAF47Δ) cells, in shCt and shSSX conditions. (C) Venn diagram of SS18 peaks in shCt and shSSX conditions in Aska WT and BAF47Δ cells. (D) Heatmaps of SS18 and H3K27ac ChIP-seq occupancy and ATAC-seq chromatin accessibility in Aska WT and BAF47Δ cells in shCt and shSSX conditions over all SS18 peaks in Aska WT cells (32,077) ranked by log2(fold change) in SS18 occupancy in Aska WT cells. (E) Example SS18, H3K27ac, and ATAC-seq tracks at the CAV1 locus in Aska WT and BAF47Δ cells in shCt and shSSX conditions. (F and G) Log2(fold change) in gene expression for Aska WT and two BAF47Δ clones in shCt and shSSX conditions over all significantly changed genes (2,350) in Aska WT day 7 (F) and highlighted example genes (G), ranked by mean fold change across all samples. (H) Example SS18 and RNA-seq tracks at the HOXC cluster in Aska WT and BAF47Δ cells in shCt and shSSX conditions. (I) Proliferation of Aska WT and BAF47Δ cells in shCt and shSSX conditions. Data are shown as means ±SD for n = 3 experiments: ***p <0.001 by two-tailed t test. See also Figure S6.
Figure 6.
Figure 6.. Model for SS18-SSX-Mediated Hijacking of BAF Complexes in SS
(A) SS18-SSX directs BAF complexes to broad polycomb domains at which they oppose polycomb-mediated repression to activate bivalent genes in a manner dependent on basal H3K4me3 levels. Upon suppression of the SS18-SSX fusion oncoprotein, BAF complexes return to distal sites, mediating enhancer (and corresponding gene) reactivation. (B) In the absence of BAF47, SS18-SSX suppression results in similar restoration of gene silencing at broad polycomb domains, as well as proliferative arrest;however, enhancer accessibility and activation are not restored.

Comment in

References

    1. Anders S, Pyl PT, and Huber W (2015). HTSeq – a Python framework to work with high-throughput sequencing data. Bioinformatics 31, 166–169. - PMC - PubMed
    1. Arnold MA, Arnold CA, Li G, Chae U, El-Etriby R, Lee CC, and Tsokos M (2013). A unique pattern of INI1 immunohistochemistry distinguishes synovial sarcoma from its histologic mimics. Hum. Pathol 44, 881–887. - PubMed
    1. Barrott JJ, Kafchinski LA, Jin H, Potter JW, Kannan SD, Kennedy R, Mosbruger T, Wang WL, Tsai JW, Araujo DM, et al. (2016). Modeling synovial sarcoma metastasis in the mouse: PI3’-lipid signaling and inflammation. J. Exp. Med 213, 2989–3005. - PMC - PubMed
    1. Bernstein BE, Mikkelsen TS, Xie X, Kamal M, Huebert DJ, Cuff J, Fry B, Meissner A, Wernig M, Plath K, et al. (2006). A bivalent chromatin structure marks key developmental genes in embryonic stem cells. Cell 125, 315–326. - PubMed
    1. Bolger AM, Lohse M, and Usadel B (2014). Trimmomatic: a flexible trimmer for Illumina sequence data. Bioinformatics 30, 2114–2120. - PMC - PubMed

Publication types

MeSH terms