

Why do water quality monitoring programs succeed or fail? A qualitative comparative analysis of regulated testing systems in sub-Saharan Africa
- PMID: 29861398
- PMCID: PMC6041725
- DOI: 10.1016/j.ijheh.2018.05.010
Why do water quality monitoring programs succeed or fail? A qualitative comparative analysis of regulated testing systems in sub-Saharan Africa
Abstract
Background: Water quality testing is critical for guiding water safety management and ensuring public health. In many settings, however, water suppliers and surveillance agencies do not meet regulatory requirements for testing frequencies. This study examines the conditions that promote successful water quality monitoring in Africa, with the goal of providing evidence for strengthening regulated water quality testing programs.
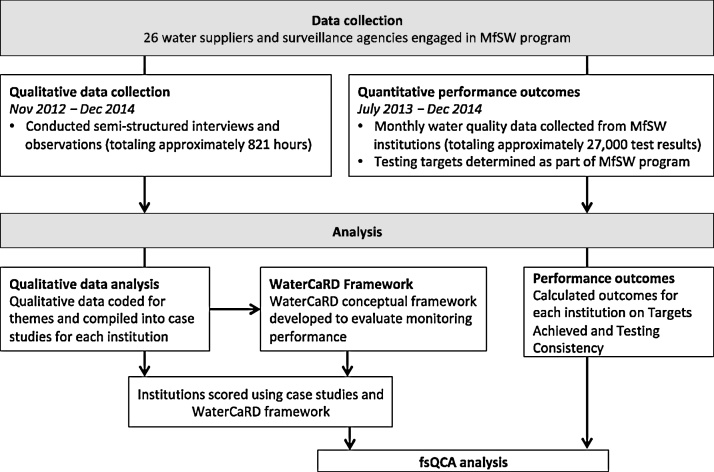
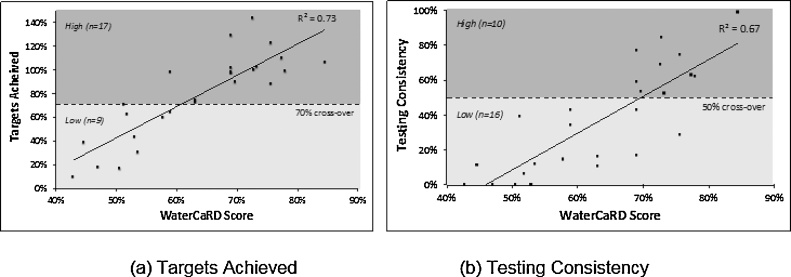
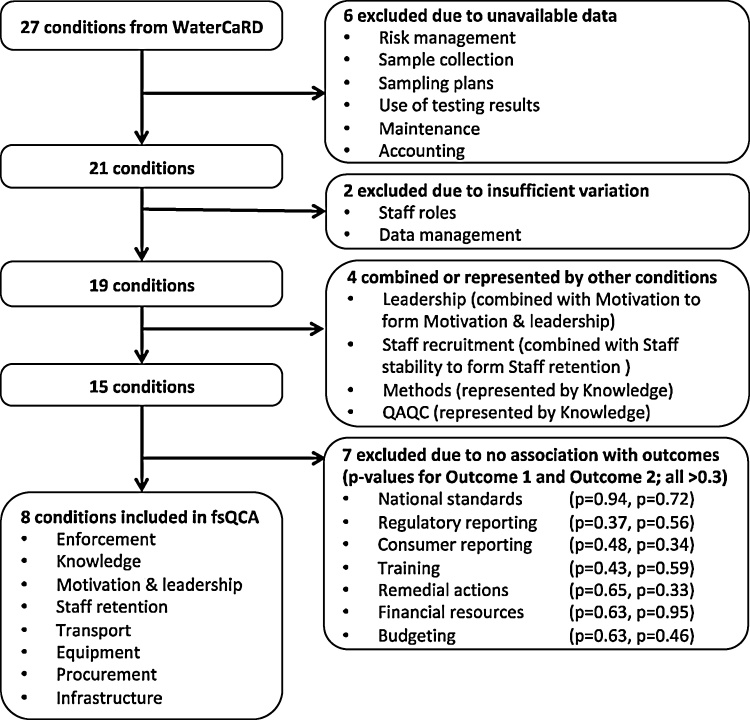
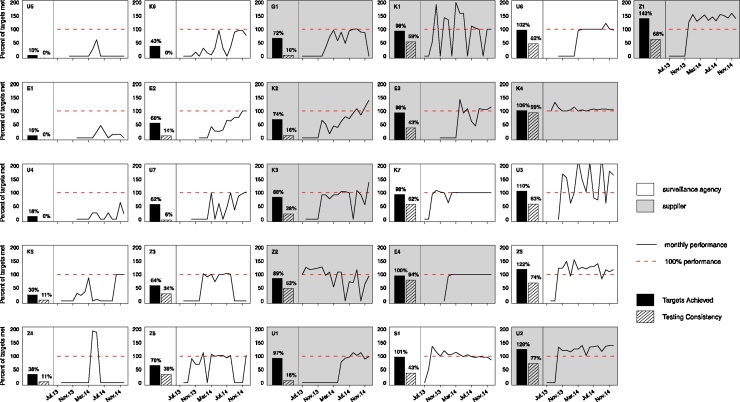
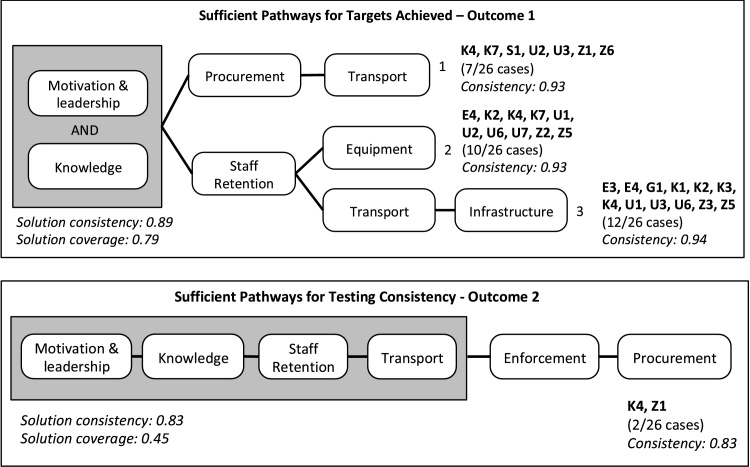
Methods and findings: We compared monitoring programs among 26 regulated water suppliers and surveillance agencies across six African countries. These institutions submitted monthly water quality testing results over 18 months. We also collected qualitative data on the conditions that influenced testing performance via approximately 821 h of semi-structured interviews and observations. Based on our qualitative data, we developed the Water Capacity Rating Diagnostic (WaterCaRD) to establish a scoring framework for evaluating the effects of the following conditions on testing performance: accountability, staffing, program structure, finances, and equipment & services. We summarized the qualitative data into case studies for each of the 26 institutions and then used the case studies to score the institutions against the conditions captured in WaterCaRD. Subsequently, we applied fuzzy-set Qualitative Comparative Analysis (fsQCA) to compare these scores against performance outcomes for water quality testing. We defined the performance outcomes as the proportion of testing Targets Achieved (outcome 1) and Testing Consistency (outcome 2) based on the monthly number of microbial water quality tests conducted by each institution. Our analysis identified motivation & leadership, knowledge, staff retention, and transport as institutional conditions that were necessary for achieving monitoring targets. In addition, equipment, procurement, infrastructure, and enforcement contributed to the pathways that resulted in strong monitoring performance.
Conclusions: Our identification of institutional commitment, comprising motivation & leadership, knowledge, and staff retention, as a key driver of monitoring performance was not surprising: in weak regulatory environments, individuals and their motivations take-on greater importance in determining institutional and programmatic outcomes. Nevertheless, efforts to build data collection capacity in low-resource settings largely focus on supply-side interventions: the provision of infrastructure, equipment, and training sessions. Our results indicate that these interventions will continue to have limited long-term impacts and sustainability without complementary strategies for motivating or incentivizing water supply and surveillance agency managers to achieve testing goals. More broadly, our research demonstrates both an experimental approach for diagnosing the systems that underlie service provision and an analytical strategy for identifying appropriate interventions.
Keywords: Institutional capacity; Monitoring; Qualitative comparative analysis; Water quality; Water testing.
Copyright © 2018 The Authors. Published by Elsevier GmbH.. All rights reserved.
Figures
References
-
- African Water Association . 2017. Water Quality: The ONEP Gets Equipped With a 1.7 Billion Fcfa Value Laboratory.http://www.afwa-hq.org/index.php/en/news/item/1079-water-quality-the-one... Available at: (Accessed June 19, 2017)
-
- AguaConsult . 2015. Sustainability Index Tool.
-
- American Chemical Society . 2015. White Paper on Proposed Capacity Development for Water Quality Assessment and Management in Nigeria.https://www.acs.org/content/dam/acsorg/global/international/resources/gi... Available at:
-
- Andrés L.A., Schwartz J., Guasch J.L. World Bank; Washington D.C: 2013. Uncovering the Drivers of Utility Performance: Lessons from Latin America and the Caribbean on the Role of the Private Sector, Regulation, and Governance in the Power, Water, and Telecommunication Sectors.http://elibrary.worldbank.org/doi/book/10.1596/978-0-8213-9660-5 Available at: - DOI
-
- Bain R. A summary catalogue of microbial drinking water tests for low and medium resource settings. Int. J. Environ. Res. Public Health. 2012;9(5):1609–1625. http://www.pubmedcentral.nih.gov/articlerender.fcgi?artid=3386575&tool=p... Available at: (Accessed December 5, 2012) - PMC - PubMed
Publication types
MeSH terms
LinkOut - more resources
Full Text Sources
Other Literature Sources
