. 2018 May 13:2018:1716246.
doi: 10.1155/2018/1716246. eCollection 2018.

Chronic Inflammation May Enhance Leiomyoma Development by the Involvement of Progenitor Cells

Affiliations

Chronic Inflammation May Enhance Leiomyoma Development by the Involvement of Progenitor Cells

Monia Orciani et al. Stem Cells Int. .

Abstract

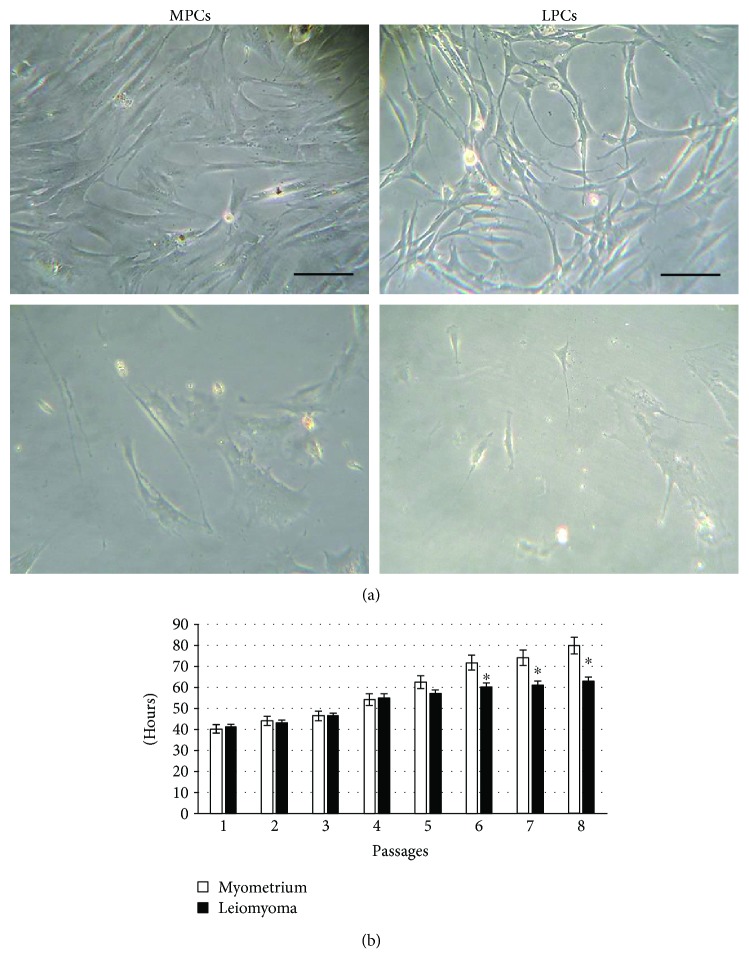
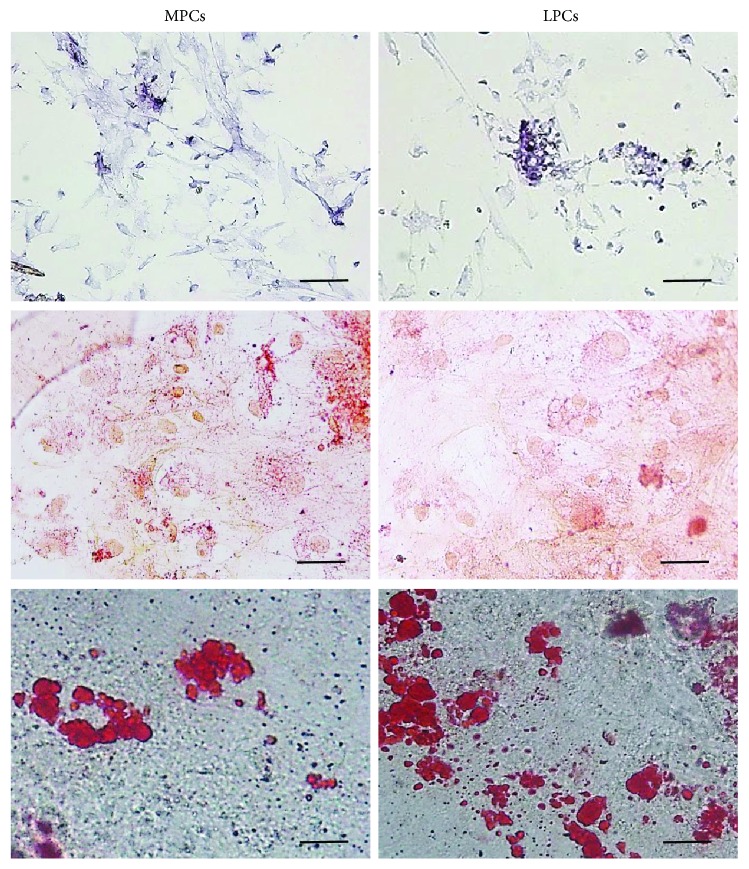
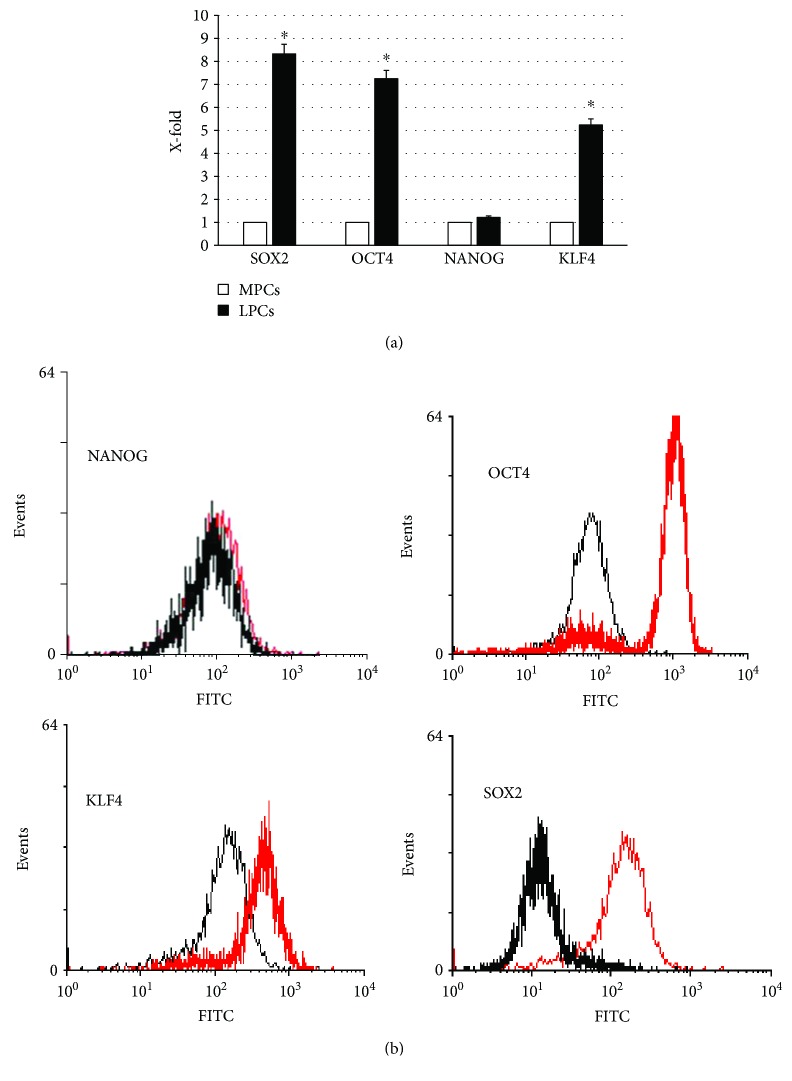
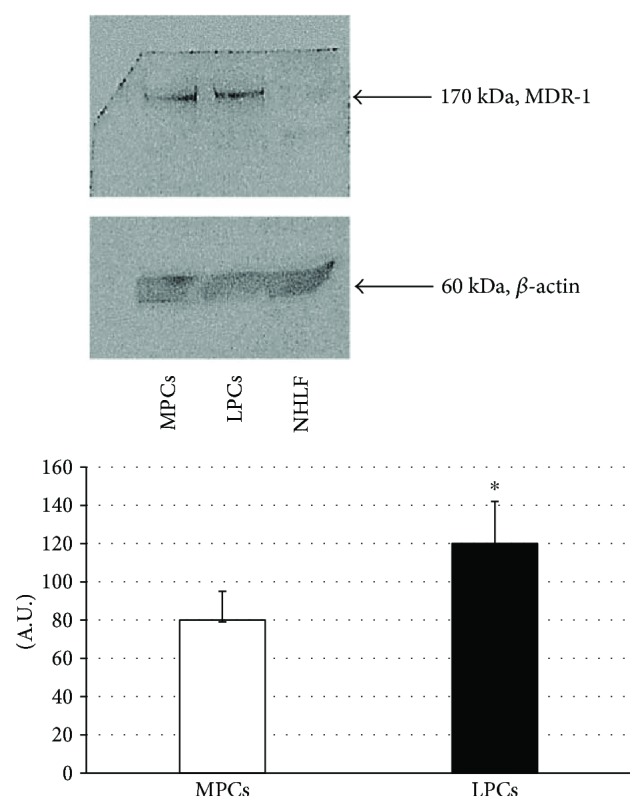
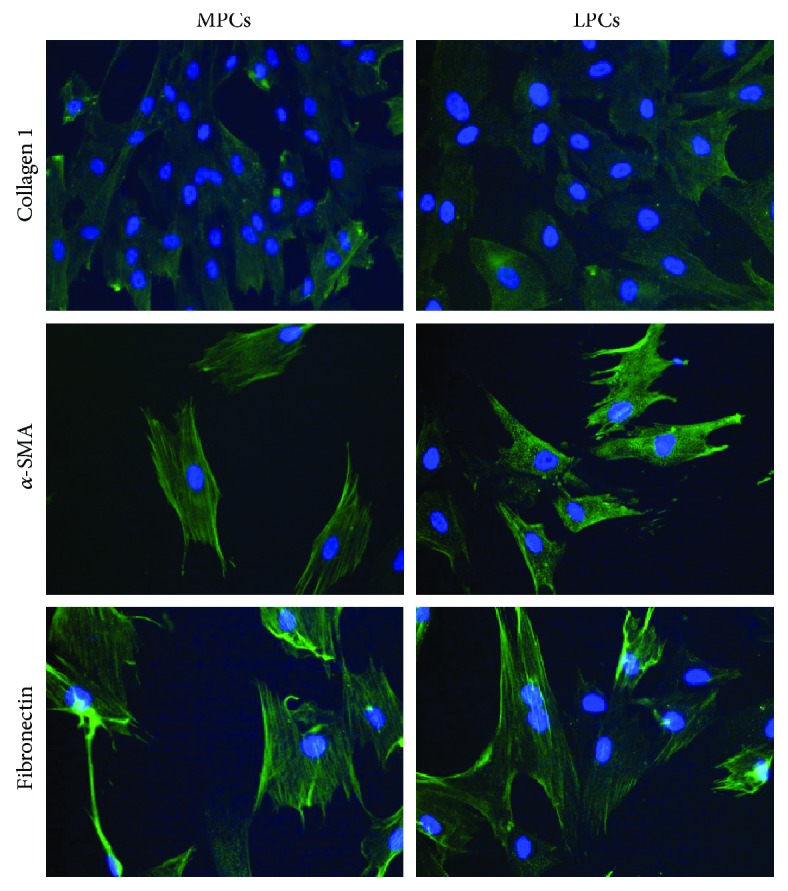
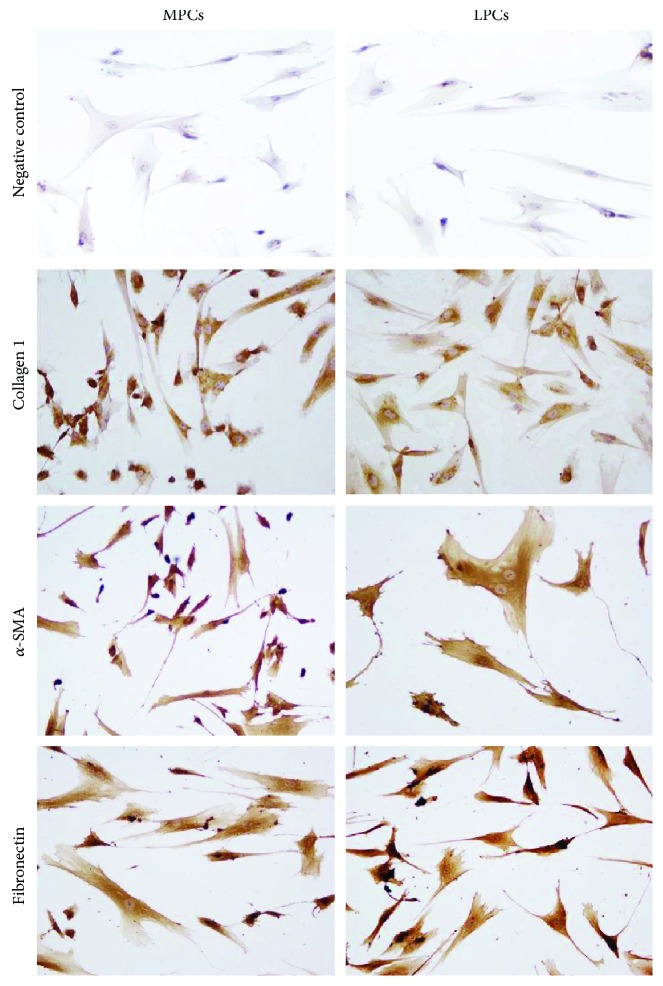
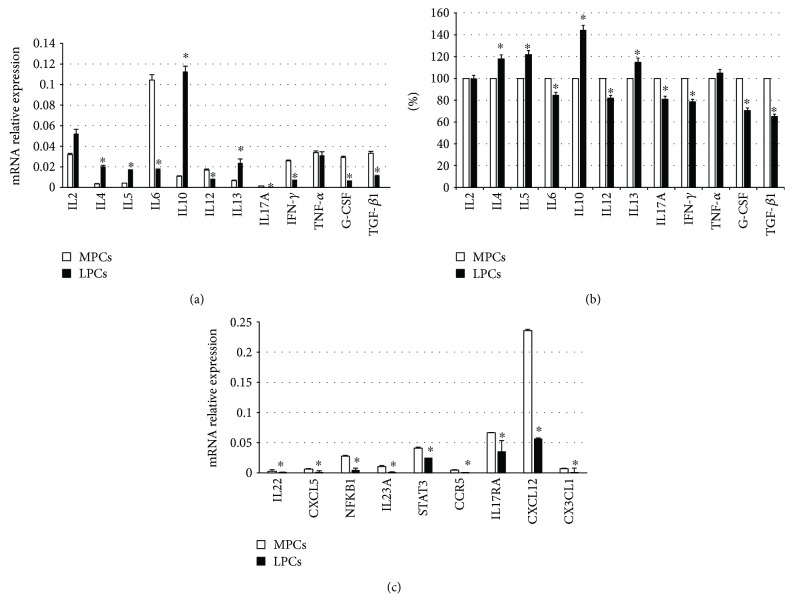
Although the etiology of leiomyoma is unclear, a progenitor/undifferentiated cell population has been described whose dysregulation may be involved in the onset of uterine conditions. Moreover, inflammation is involved in the development of several tumors. The aim of this work was to understand if progenitor cells sustain a chronic inflammatory microenvironment that enhances leiomyoma development. Cells from 12 human leiomyoma and 12 normal myometrium samples of the same patients were in vitro isolated and exhaustively characterized (morphology, proliferation, cytofluorometry, differentiation, RT-PCR, immunofluorescence, immunohistochemistry, and Western blotting assays). Selected cytokines (ELISA) and inflammation-related genes (RT-PCR) were analyzed to identify healthy myometrium progenitor cells (MPCs) and leiomyoma progenitor cells (LPCs). Results show that (i) MPCs and LPCs share stemness features, such as immunophenotype and multidifferentiation assay, (ii) LPCs have a significantly shorter doubling time and a significantly higher expression of stemness genes (p < 0.05), and (iii) LPCs secreted significantly higher levels (p < 0.05) of cytokines related to chronic inflammation and significantly lower amounts (p < 0.05) of cytokines related to acute inflammation. Despite the limited sample size, comparisons between leiomyoma and normal myometrium tissue from each patient allowed normalization of patient-specific differences. The evidenced cytokine expression pattern related to chronic inflammation in LPCs may play a role in the increased risk of adverse obstetric outcomes (infertility, spontaneous miscarriage, and preterm birth) in women affected by leiomyomas. These women should be recognized as "high risk" and subjected to specialized management both before and during pregnancy.


Figures

Figure 1
Figure 1
Cell morphology and doubling time. (a) Phase-contrast images of myometrium progenitor cells (MPCs, left) and leiomyoma progenitor cells (LPCs, right) at 2nd (top) and 4th (bottom) passage of culture. Scale bar = 100 μm. (b) Doubling time was calculated over 21 days (8th passage). Data are mean ± SD of experiments performed on 12 samples. p < 0.05 LPCs versus MPCs.
Figure 2
Figure 2
Multilineage differentiation of MPCs and LPCs. Representative images of differentiation experiments. Osteogenic differentiation: ALP staining (top); chondrogenic differentiation: acid mucopolysaccharide coloration with Safranin-O (center); adipocyte differentiation: Oil Red staining (bottom). No differences were noted among different leiomyoma and myometrium samples. Scale bar = 100 μm. MPCs: myometrium progenitor cells; LPCs: leiomyoma progenitor cells.
Figure 3
Figure 3
OCT4, SOX2, NANOG, and KLF4 expression. Selected markers of self-renewal and differentiation potential (OCT4, SOX2, NANOG, and KLF4) were evaluated by RT-PCR (a) and cytofluorometry (b). For PCR analysis, the expression levels measured in LPCs are considered as X-fold with respect to MPCs (considered as 1). Data are mean ± SD of analyses performed in 12 different MPC and LPC cultures, upon three independent experiments in triplicates. p < 0.05 LPCs versus MPCs. For cytofluorometric analysis, representative FACScan analyses of cell-surface antigen expression, as indicated. Black histograms refer to the MPCs and red histograms refer to LPCs.
Figure 4
Figure 4
Western blots and densitometric analyses of MDR1 expression. (Top) representative Western blot gels showing the bands of MDR1 and of the endogenous control β-actin. (Bottom) densitometric analyses of the immunoreactive bands (quantified as MDR1/β-actin bands in corresponding samples and expressed as arbitrary units, A.U.). Data are mean ± SD of analyses performed in MPCs and LPCs from the 12 patients. p < 0.05 LPCs versus MPCs. MPCs: myometrium progenitor cells; LPCs: leiomyoma progenitor cells.
Figure 5
Figure 5
Indirect immunofluorescence analysis of α-SMA, collagen type 1, and fibronectin. A secondary FITC-conjugated antibody was used after incubation with the primary antibodies. Nuclei were counterstained with Hoechst 33342. Myometrium progenitor cells (MPCs) and leiomyoma progenitor cells (LPCs) showed a similarly strong positivity for α-SMA and fibronectin, whereas collagen type 1 expression was fainter. Differences between MPCs and LPCs were not significant (×200 original magnification).
Figure 6
Figure 6
Immunocytochemical analysis of α-SMA, collagen type 1, and fibronectin. Compared to the negative control (secondary antibody alone), the primary antibodies induce brownish staining in myometrium progenitor cells (MPCs) and leiomyoma progenitor cells (LPCs). The reaction was weaker for collagen type 1 than for α-SMA and fibronectin. Differences between MPCs and LPCs were not significant (immunoperoxidase, ×400 original magnification).
Figure 7
Figure 7
Expression of selected cytokines in myometrium progenitor cells (MPCs) and leiomyoma progenitor cells (LPCs). (a) Quantification of mRNA expression in MPCs and LPCs was calculated with the 2−ΔCt method, where ΔCt = Ct (gene of interest) − Ct (housekeeping gene). ΔCt was calculated for the selected genes on 12 different cultures. Subsequently, mean ± SD from three independent experiments in triplicates was calculated for LPCs and displayed. p < 0.05 LPCs versus MPCs. (b) ELISA test; the levels measured in MPCs were considered as 100% and those detected in LPCs accordingly calculated; p < 0.05 LPCs versus MPCs. (c) Selected Th1/Th17 pathway molecules evaluated by RT-PCR. Quantification of mRNA expression in MPCs and LPCs was calculated with the 2−ΔCt method, where ΔCt = Ct (gene of interest) − Ct (housekeeping gene). ΔCt was calculated for the selected genes on 12 different cultures. Subsequently, mean ± SD from three independent experiments in triplicates was calculated for LPCs and displayed. p < 0.05.

Similar articles

Cited by

References

    1. Walker C. L., Stewart E. A. Uterine fibroids: the elephant in the room. 2005;308(5728):1589–1592. doi: 10.1126/science.1112063. - DOI - PubMed
    1. Okolo S. Incidence, aetiology and epidemiology of uterine fibroids. 2008;22(4):571–588. doi: 10.1016/j.bpobgyn.2008.04.002. - DOI - PubMed
    1. Stewart E. A. Uterine fibroids. 2001;357(9252):293–298. doi: 10.1016/S0140-6736(00)03622-9. - DOI - PubMed
    1. Parker W. H. Etiology, symptomatology, and diagnosis of uterine myomas. 2007;87(4):725–736. doi: 10.1016/j.fertnstert.2007.01.093. - DOI - PubMed
    1. Ciavattini A., Clemente N., Delli Carpini G., Di Giuseppe J., Giannubilo S. R., Tranquilli A. L. Number and size of uterine fibroids and obstetric outcomes. 2015;28(4):484–488. doi: 10.3109/14767058.2014.921675. - DOI - PubMed

LinkOut - more resources