

Sponge-supported cultures of primary head and neck tumors for an optimized preclinical model
- PMID: 29861851
- PMCID: PMC5982753
- DOI: 10.18632/oncotarget.25244
Sponge-supported cultures of primary head and neck tumors for an optimized preclinical model
Abstract
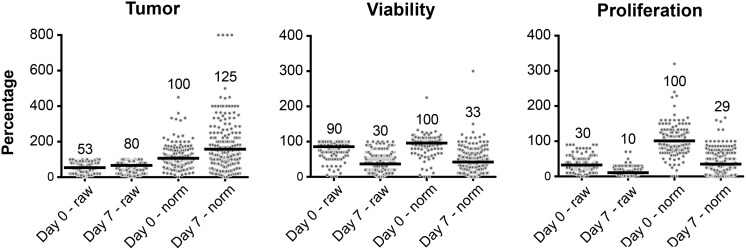
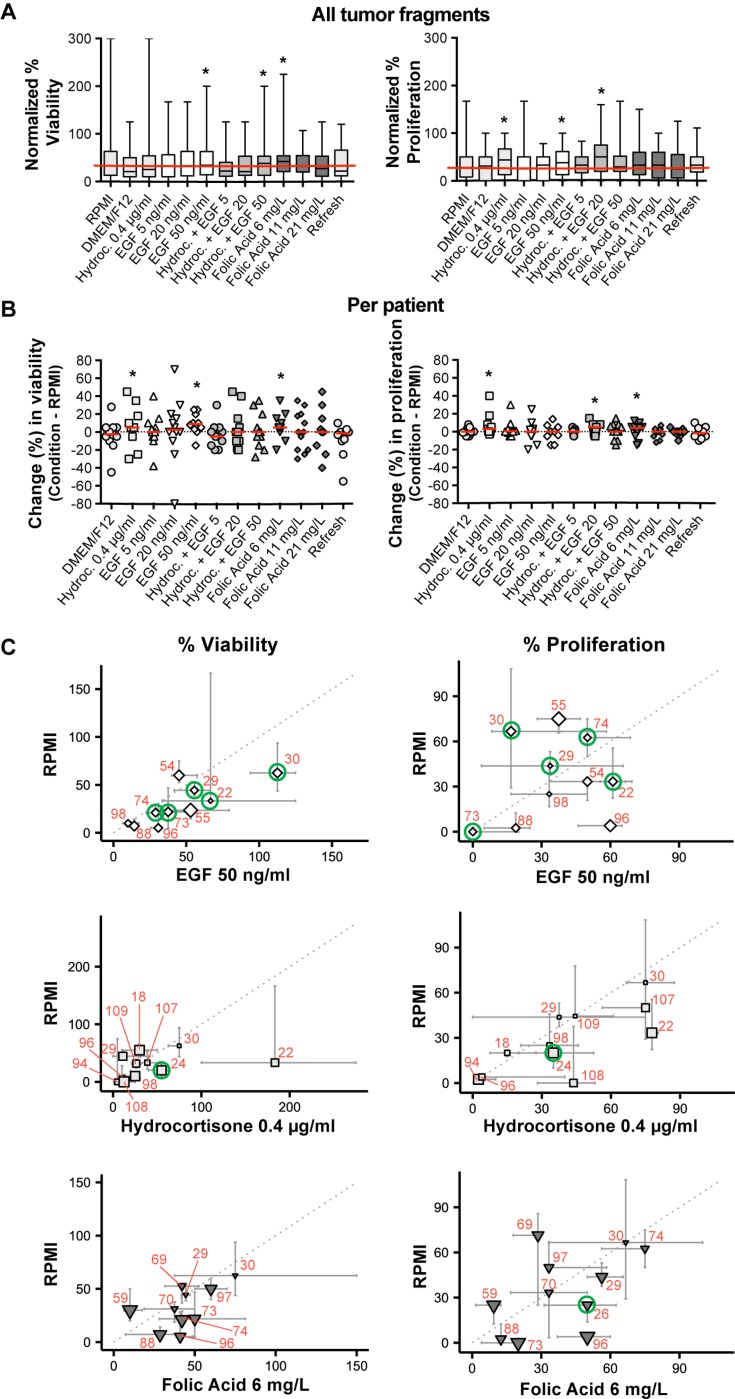
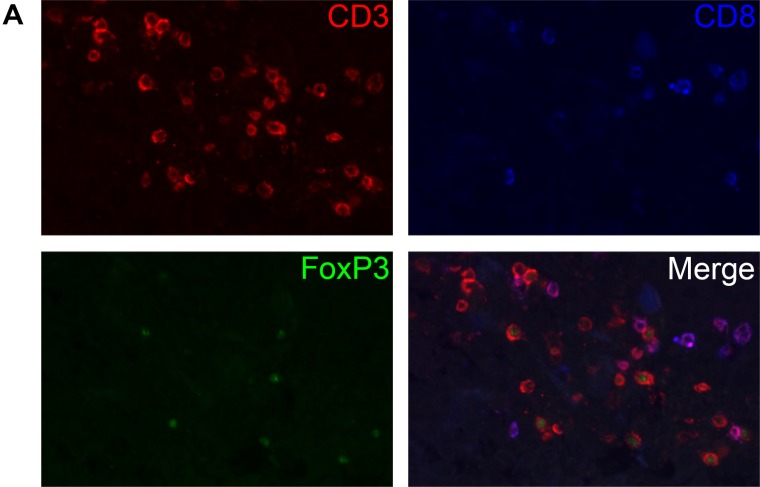
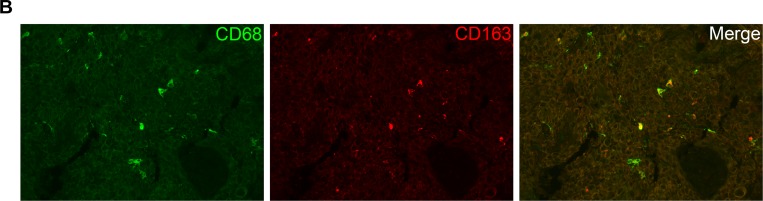
Treatment of advanced head and neck cancer is associated with low survival, high toxicity and a widely divergent individual response. The sponge-gel-supported histoculture model was previously developed to serve as a preclinical model for predicting individual treatment responses. We aimed to optimize the sponge-gel-supported histoculture model and provide more insight in cell specific behaviour by evaluating the tumor and its microenvironment using immunohistochemistry. We collected fresh tumor biopsies from 72 untreated patients and cultured them for 7 days. Biopsies from 57 patients (79%) were successfully cultured and 1451 tumor fragments (95.4%) were evaluated. Fragments were scored for percentage of tumor, tumor viability and proliferation, EGF-receptor expression and presence of T-cells and macrophages. Median tumor percentage increased from 53% at day 0 to 80% at day 7. Viability and proliferation decreased after 7 days, from 90% to 30% and from 30% to 10%, respectively. Addition of EGF, folic acid and hydrocortisone can lead to improved viability and proliferation, however this was not systematically observed. No patient subgroup could be identified with higher culture success rates. Immune cells were still present at day 7, illustrating that the tumor microenvironment is sustained. EGF supplementation did not increase viability and proliferation in patients overexpressing EGF-Receptor.
Keywords: cell culture; head and neck cancer; primary tissue; sponge gel supported histoculture; squamous cell carcinoma.
Conflict of interest statement
CONFLICTS OF INTEREST The authors declare no potential conflicts of interest.
Figures

Similar articles
-
Histoculture and the immunodeficient mouse come to the cancer clinic - rational approaches to individualizing cancer-therapy and new drug-evaluation (review).Int J Oncol. 1992 Sep;1(4):467-74. doi: 10.3892/ijo.1.4.467. Int J Oncol. 1992. PMID: 21584568
-
Production of Uniform 3D Microtumors in Hydrogel Microwell Arrays for Measurement of Viability, Morphology, and Signaling Pathway Activation.Assay Drug Dev Technol. 2015 Nov;13(9):570-83. doi: 10.1089/adt.2015.662. Epub 2015 Aug 14. Assay Drug Dev Technol. 2015. PMID: 26274587 Free PMC article.
-
Human-in-mouse modeling of primary head and neck squamous cell carcinoma.Laryngoscope. 2009 Dec;119(12):2315-23. doi: 10.1002/lary.20607. Laryngoscope. 2009. PMID: 19693929
-
3D Sponge-Matrix Histoculture: An Overview.Methods Mol Biol. 2018;1760:11-17. doi: 10.1007/978-1-4939-7745-1_2. Methods Mol Biol. 2018. PMID: 29572789 Review.
-
The EGF receptor system in head and neck carcinomas and normal tissues. Immunohistochemical and quantitative studies.Dan Med Bull. 1998 Apr;45(2):121-34. Dan Med Bull. 1998. PMID: 9587699 Review.
Cited by
-
Patient-derived three-dimensional culture techniques model tumor heterogeneity in head and neck cancer.Oral Oncol. 2023 Mar;138:106330. doi: 10.1016/j.oraloncology.2023.106330. Epub 2023 Feb 9. Oral Oncol. 2023. PMID: 36773387 Free PMC article. Review.
-
Precision Medicine Gains Momentum: Novel 3D Models and Stem Cell-Based Approaches in Head and Neck Cancer.Front Cell Dev Biol. 2021 Jul 8;9:666515. doi: 10.3389/fcell.2021.666515. eCollection 2021. Front Cell Dev Biol. 2021. PMID: 34307351 Free PMC article. Review.
-
Ex Vivo Culture Models to Indicate Therapy Response in Head and Neck Squamous Cell Carcinoma.Cells. 2020 Nov 23;9(11):2527. doi: 10.3390/cells9112527. Cells. 2020. PMID: 33238461 Free PMC article. Review.
-
In Vitro Models of Head and Neck Cancer: From Primitive to Most Advanced.J Pers Med. 2023 Nov 3;13(11):1575. doi: 10.3390/jpm13111575. J Pers Med. 2023. PMID: 38003890 Free PMC article. Review.
-
Making In Vitro Tumor Models Whole Again.Adv Healthc Mater. 2023 Jun;12(14):e2202279. doi: 10.1002/adhm.202202279. Epub 2023 Feb 22. Adv Healthc Mater. 2023. PMID: 36718949 Free PMC article. Review.
References
-
- Pulte D, Brenner H. Changes in survival in head and neck cancers in the late 20th and early 21st century: a period analysis. Oncologist. 2010;15:994–1001. https://doi.org/10.1634/theoncologist.2009-0289. - DOI - PMC - PubMed
-
- Epidemiology Surveillance End Results (SEER) Program. Oral Cavity and Pharynx Cancer.
-
- Epidemiology Surveillance End Results (SEER) Program. Larynx Cancer.
-
- Adelstein DJ, Li Y, Adams GL, Wagner H, Jr, Kish JA, Ensley JF, Schuller DE, Forastiere AA. An intergroup phase III comparison of standard radiation therapy and two schedules of concurrent chemoradiotherapy in patients with unresectable squamous cell head and neck cancer. J Clin Oncol. 2003;21:92–98. https://doi.org/10.1200/JCO.2003.01.008. - DOI - PubMed
-
- Pignon JP, le Maître A, Maillard E, Bourhis J, MACH-NC Collaborative Group Meta-analysis of chemotherapy in head and neck cancer (MACH-NC): an update on 93 randomised trials and 17,346 patients. Radiother Oncol. 2009;92:4–14. https://doi.org/10.1016/j.radonc.2009.04.014. - DOI - PubMed
LinkOut - more resources
Full Text Sources
Other Literature Sources
