. 2018 May 18;9(38):25075-25088.
doi: 10.18632/oncotarget.25308.

Characterization of HBV integration patterns and timing in liver cancer and HBV-infected livers

Affiliations

Characterization of HBV integration patterns and timing in liver cancer and HBV-infected livers

Mayuko Furuta et al. Oncotarget. .

Erratum in

Abstract

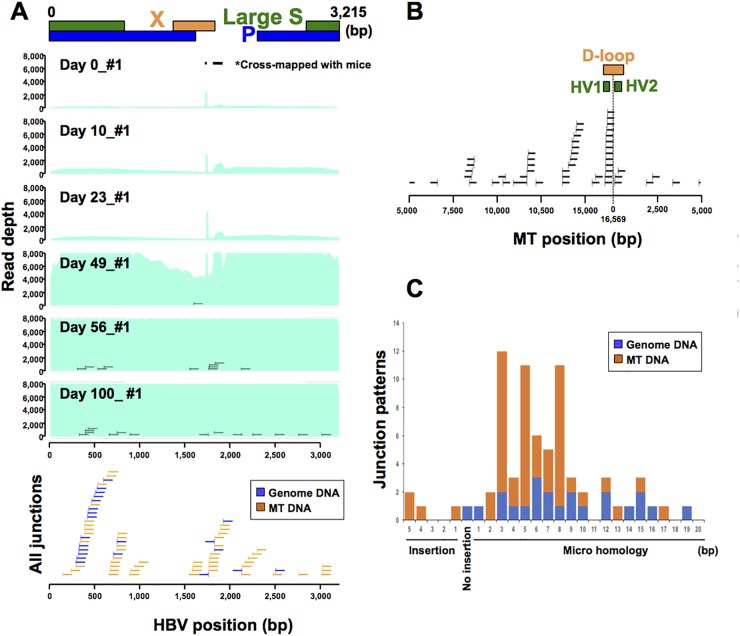
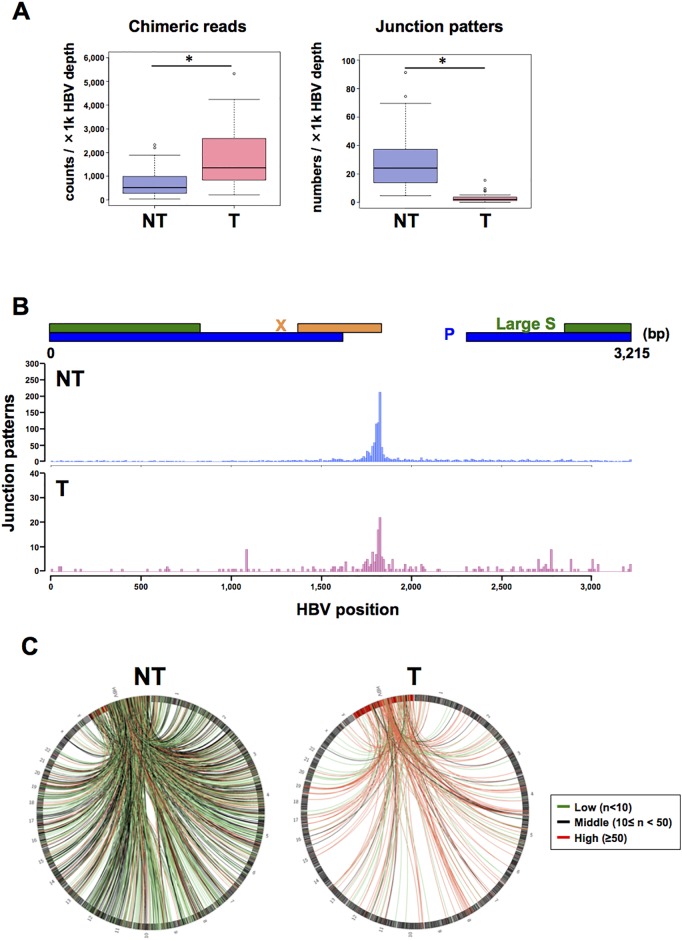
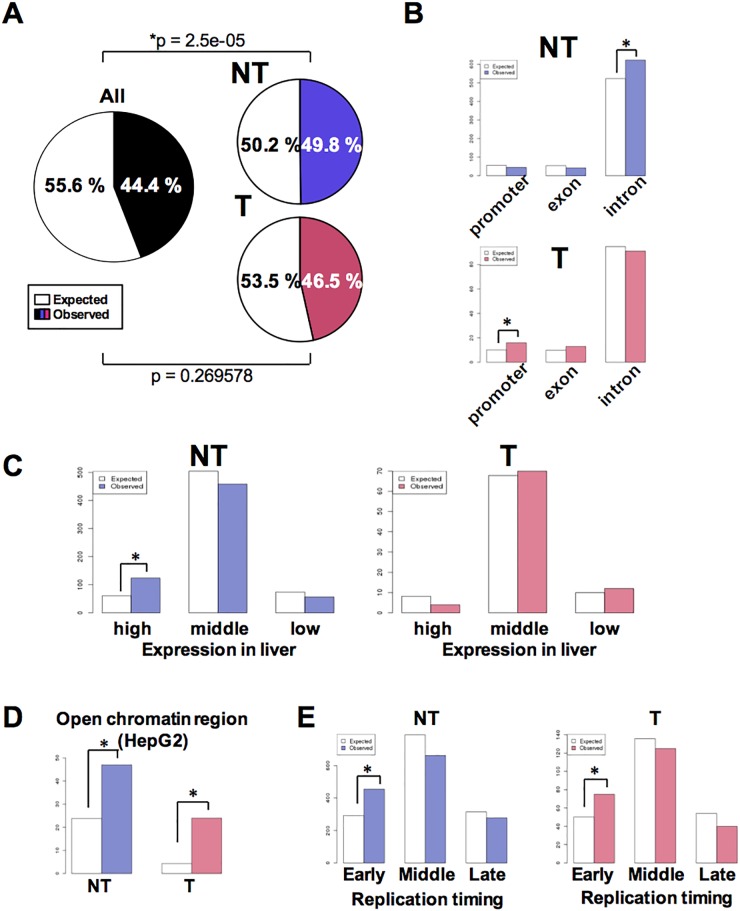
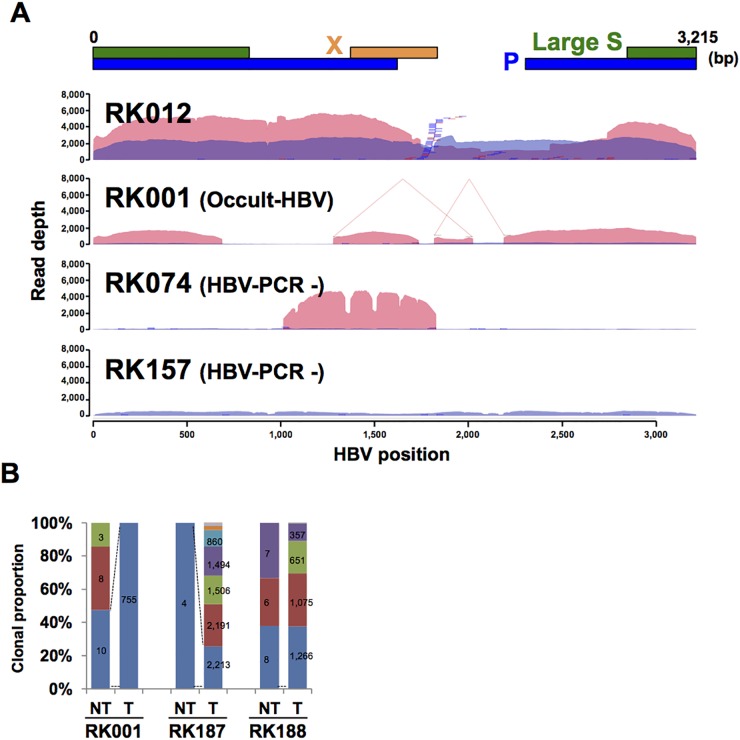
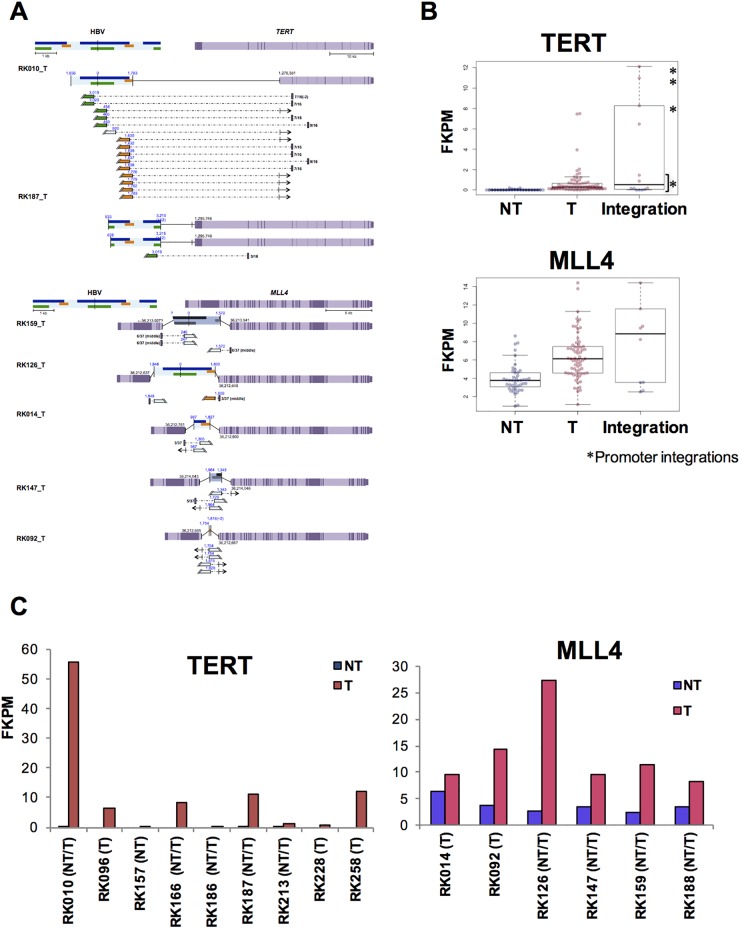
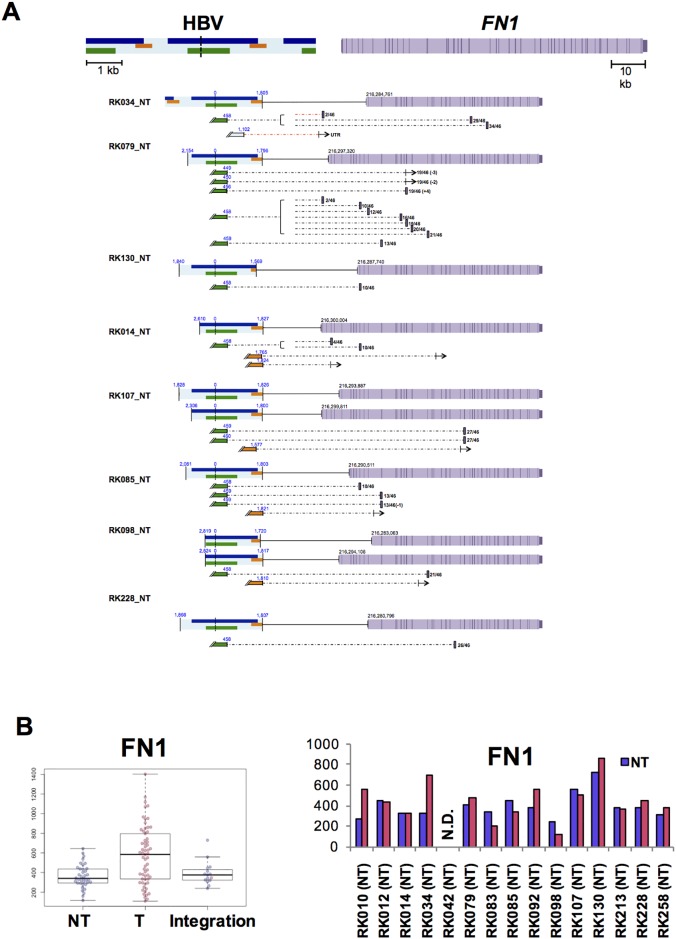
Integration of Hepatitis B virus (HBV) into the human genome can cause genetic instability, leading to selective advantages for HBV-induced liver cancer. Despite the large number of studies for HBV integration into liver cancer, little is known about the mechanism of initial HBV integration events owing to the limitations of materials and detection methods. We conducted an HBV sequence capture, followed by ultra-deep sequencing, to screen for HBV integrations in 111 liver samples from human-hepatocyte chimeric mice with HBV infection and human clinical samples containing 42 paired samples from non-tumorous and tumorous liver tissues. The HBV infection model using chimeric mice verified the efficiency of our HBV-capture analysis and demonstrated that HBV integration could occur 23 to 49 days after HBV infection via microhomology-mediated end joining and predominantly in mitochondrial DNA. Overall HBV integration sites in clinical samples were significantly enriched in regions annotated as exhibiting open chromatin, a high level of gene expression, and early replication timing in liver cells. These data indicate that HBV integration in liver tissue was biased according to chromatin accessibility, with additional selection pressures in the gene promoters of tumor samples. Moreover, an integrative analysis using paired non-tumorous and tumorous samples and HBV-related transcriptional change revealed the involvement of TERT and MLL4 in clonal selection. We also found frequent and non-tumorous liver-specific HBV integrations in FN1 and HBV-FN1 fusion transcript. Extensive survey of HBV integrations facilitates and improves the understanding of the timing and biology of HBV integration during infection and HBV-related hepatocarcinogenesis.

Keywords: HBV; genome integration; liver cancer; mitochondria; sequencing.


Conflict of interest statement

CONFLICTS OF INTEREST The authors declare no conflict of interest associated with this manuscript.

Figures

Figure 1
Figure 1. HBV infection model using human-hepatocyte chimera mice
(A) Representative image of depth of coverage of HBV genome and integration sites in chimera mouse model 0, 10, 23, 49, 56 and 100 days after HBV infection (upper). Light green coloration indicates the HBV coverage depth. HBV junctions are indicated by vertical bars, with remaining sections of the integrated sequence indicated by horizontal lines. All junction sites and sections of integrated sequences were shown in blue (genomic DNA) and yellow (mtDNA) lines (lower). Two peaks (*) in HBV depth were derived from cross-mapped sequences from DNA obtained from mouse cells. (B) Distribution of HBV integration sites in mtDNA. (C) HBV junction site analysis. Patterns of HBV junction sites with insertions or microhomology in their reference sequence were shown by their length (bp). Blue and yellow indicates HBV junctions with genomic and mtDNA.
Figure 2
Figure 2. Visualization of HBV integration sites in the HBV and human genomes
(A) The number of chimeric reads (left) and junction patterns (right) detected via HBV-CapSeq in non-tumorous (NT, blue) and tumor (T, pink) samples. *p < 0.05 (paired Student's t test). (B) The number of integration breakpoints at different sites in the HBV genome. (C) Circos plot showing the distribution of integration sites in the HBV genome (red bars) and in human chromosomes (black bars). Red, green, and black lines indicate junctions with >50, <10, and other read counts, respectively.
Figure 3
Figure 3. Characteristics associated with HBV integration of HBV into NT and T samples
(A) Pie charts showing the proportion of gene body and intergenic regions in the human genome. Gene body regions were defined as exons, introns, or gene promoters (i.e., spanning 5 kb upstream to the gene transcription start site). Colored and white sections indicate the comparative proportions of gene body and intergenic junctions. (B) The number of HBV integration sites in gene promoters, exons, or introns among all NT and T samples. White and colored bars indicate the expected and observed number of integration sites, respectively. *p < 0.05. (C) The number of HBV integration sites in genes found to be highly expressed in liver tissues. The expression status of the various genes in liver tissues was calculated as the mean expression level exhibited by 50 non-cancerous liver tissue samples previously described in [36]. After exclusion of genes with a Coefficient of Variation greater than 1.0, the 10% of genes that were most highly expressed and the 10% of genes that exhibited the lowest expression level were determined. *p < 0.05. (D) The expected (white) and observed (colored) number of HBV junctions in open chromatin regions in HepG2 cell. Open chromatin regions were defined using HepG2 DNase-Seq data (https://www.encodeproject.org, GEO: GSM816662). (E) The expected (white) and observed (colored) numbers of HBV junctions in regions classified as ‘early,’ ‘moderate,’ or ‘late’ with regards to replication timing (defined using HepG2 Repli-seq data (GEO:GSM923446)). The ‘early’ and ‘late’ junctions were defined as regions found to exhibit greater than 70 or less than 20 gene expression signals, while those found to exhibit 20–70 gene expression signals were defined as ‘mod’.
Figure 4
Figure 4. HBV integrations in paired NT and T samples
(A) Representative image showing the depth of coverage of the HBV genome, and the integration sites identified by HBV-Capture-Seq. Blue and pink coloration indicates the HBV coverage depth in non-tumor (NT) and tumor (T) samples. Blue and red bars indicate junctions in NT and T samples. HBV junctions are indicated by vertical bars, with remaining sections of the integrated sequence (35 bp) are indicated by horizontal lines. Positions of structural variations within HBVs are depicted by connected lines. (B) The clonal proportion of HBV junctions in an occult HBV case. The proportion of each junction detected in the NT sample is shown, and the identically colored block indicates the shared junction between the NT and T sample. Numbers indicate the supporting read counts for each junction.
Figure 5
Figure 5. Influence of HBV integrations on TERT and MLL4 expression in T samples
(A) Expected gene structure of HBV integrations and corresponding HBV fusion transcripts for TERT (upper) and MLL4 (lower). Corresponding HBV and human genomic structures are shown, including HBV genes encoding Large S (green), P (blue), and X (yellow) proteins, as well as gene exons (purple) and introns (light purple). Fusion transcripts that were determined to contain junctions via RNA-Seq are depicted (connected boxes), and the direction of gene expression (arrows) is indicated. (B) The expression status of TERT (upper) and MLL4 (lower), as determined by RNA-Seq. Samples include both HBV integrations and, in the control, non-integrated NT and T samples. Blue and pink plots indicate NT and T samples, respectively.*samples with integrations in promoter regions. (C) Expression status of TERT (left) and MLL4 (right) in integrated samples. Blue and pink bars indicate NT and T samples.
Figure 6
Figure 6. Influence of HBV integrations on FN1 in NT samples
(A) Expected FN1 gene structure of HBV integrations and HBV fusion transcripts. HBV genes encoding Large S (green), P (blue), and X (yellow) proteins, gene exons (purple) and introns (light purple). Fusion transcripts that were determined to contain junctions via RNA-Seq are depicted (connected boxes), and the direction of gene expression (arrows) is indicated. (B) Theexpression status of FN1, as determined by RNA-Seq. Samples include both HBV integrations and, in the control, non-integrated NT and T samples. Blue and pink plots indicate NT and T samples, respectively. (C) Expression status of FN1 in integrated samples. Blue and pink bars indicate NT and T samples.

References

    1. World Health Organization Hepatitis B. World Health Organization Fact Sheet. 204 (Revised July 2017) http://www.who.int/mediacentre/factsheets/fs204/en/
    1. Chen DS. From hepatitis to hepatoma: lessons from type B viral hepatitis. Science. 1993;262:369–70. - PubMed
    1. Tiollais P, Pourcel C, Dejean A. The hepatitis B virus. Nature. 1985;317:489–95. - PubMed
    1. Lucifora J, Arzberger S, Durantel D, Belloni L, Strubin M, Levrero M, Zoulim F, Hantz O, Protzer U. Hepatitis B virus X protein is essential to initiate and maintain virus replication after infection. J Hepatol. 2011(55):996–1003. - PubMed
    1. Hanahan D, Weinberg RA. Hallmarks of cancer: the next generation. Cell. 2011;144:646–74. - PubMed

LinkOut - more resources