. 2018 May 18;9(38):25225-25243.
doi: 10.18632/oncotarget.25396.

TRKB tyrosine kinase receptor is a potential therapeutic target for poorly differentiated oral squamous cell carcinoma

Affiliations

TRKB tyrosine kinase receptor is a potential therapeutic target for poorly differentiated oral squamous cell carcinoma

Kazumasa Moriwaki et al. Oncotarget. .

Abstract

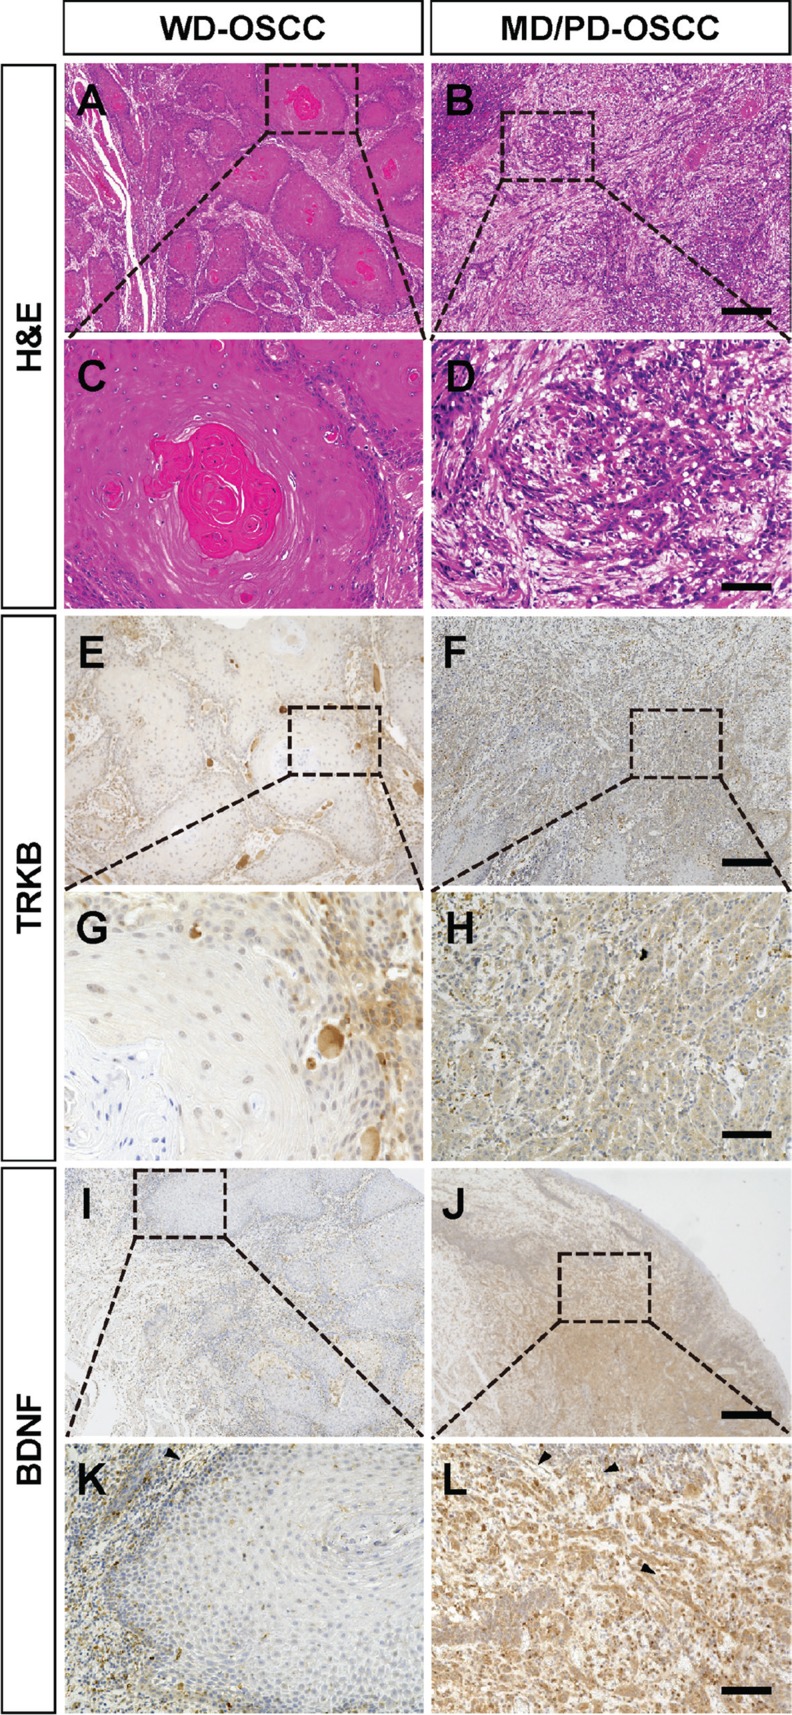
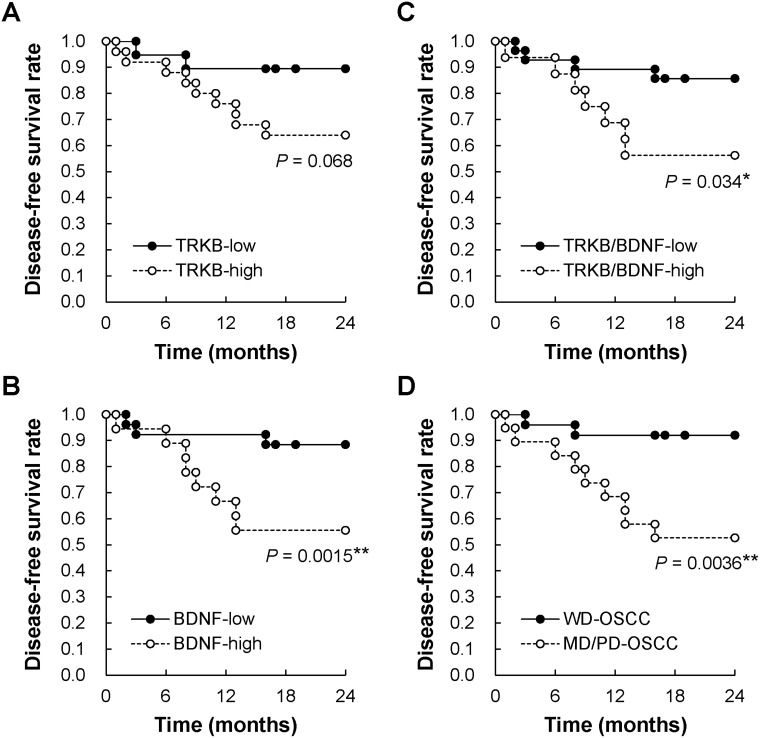
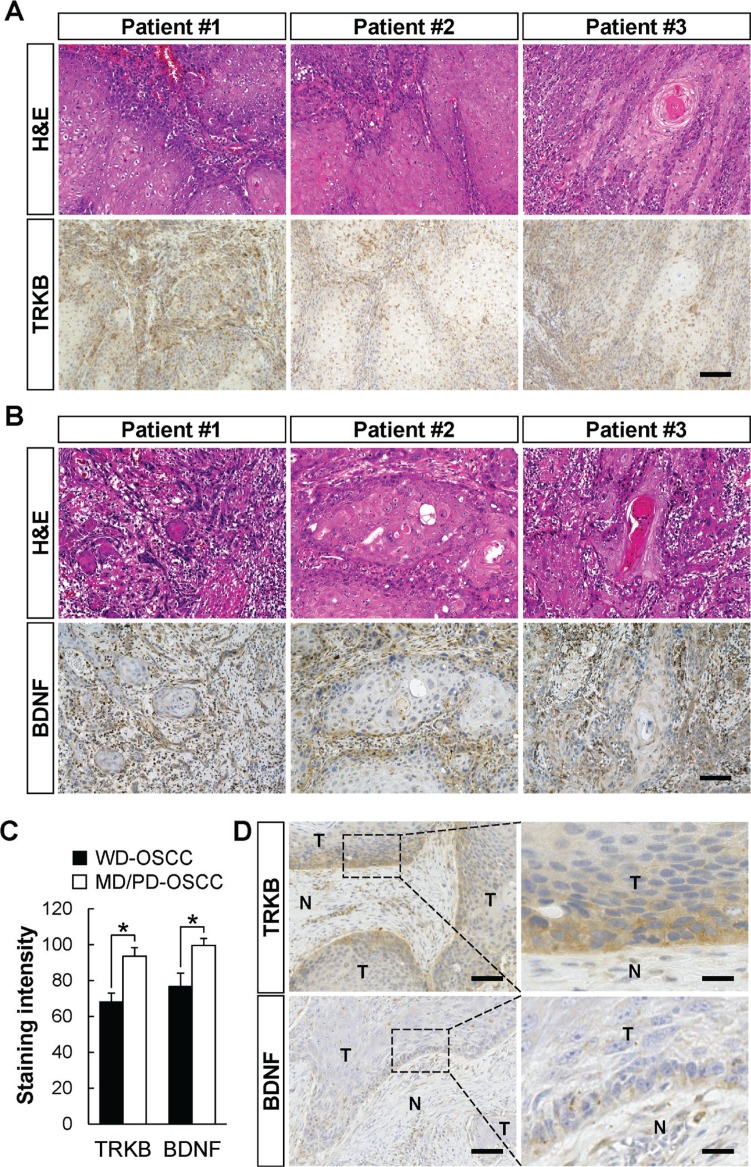
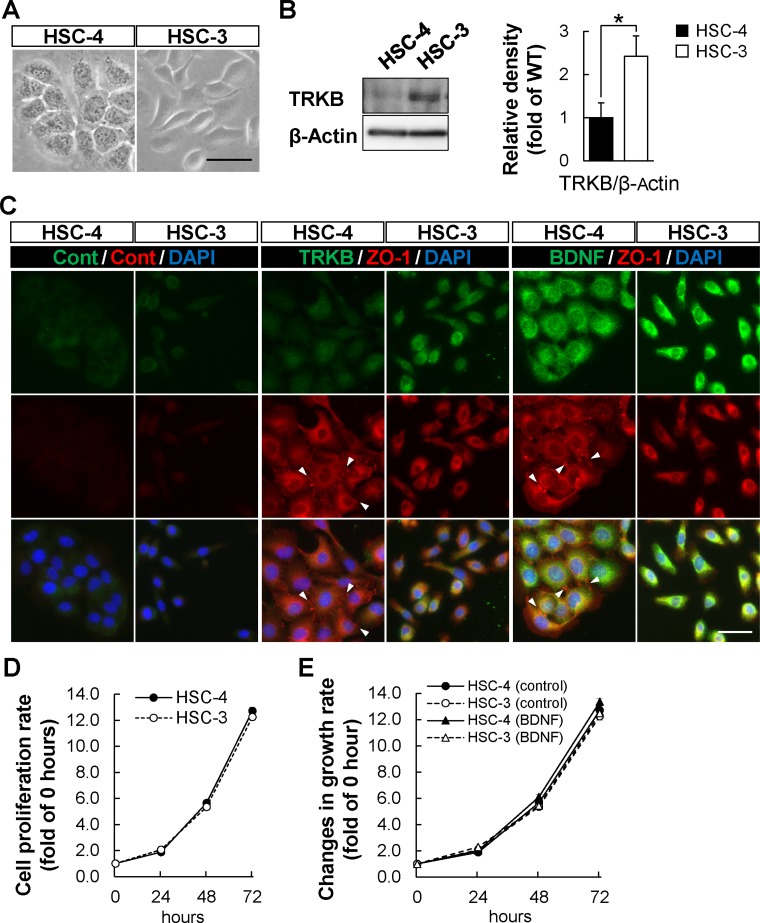
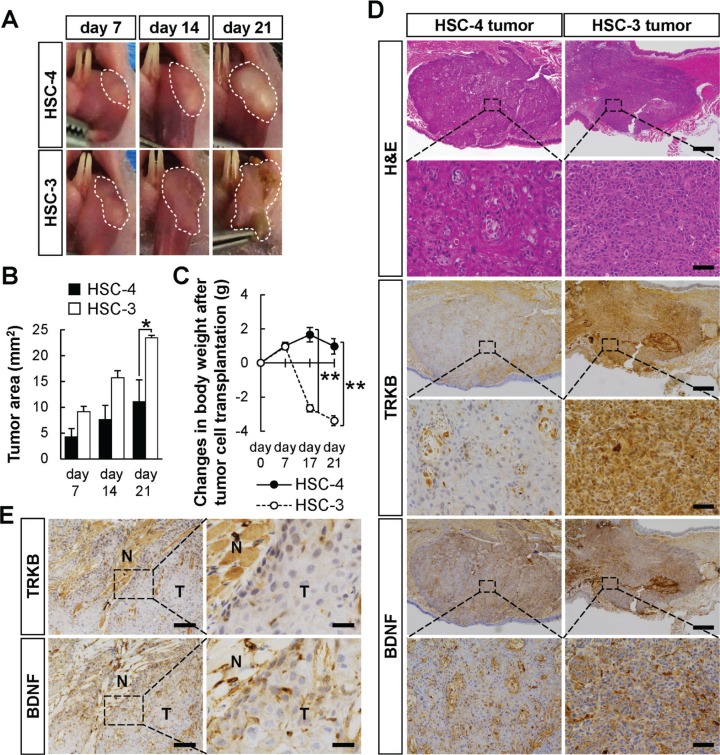
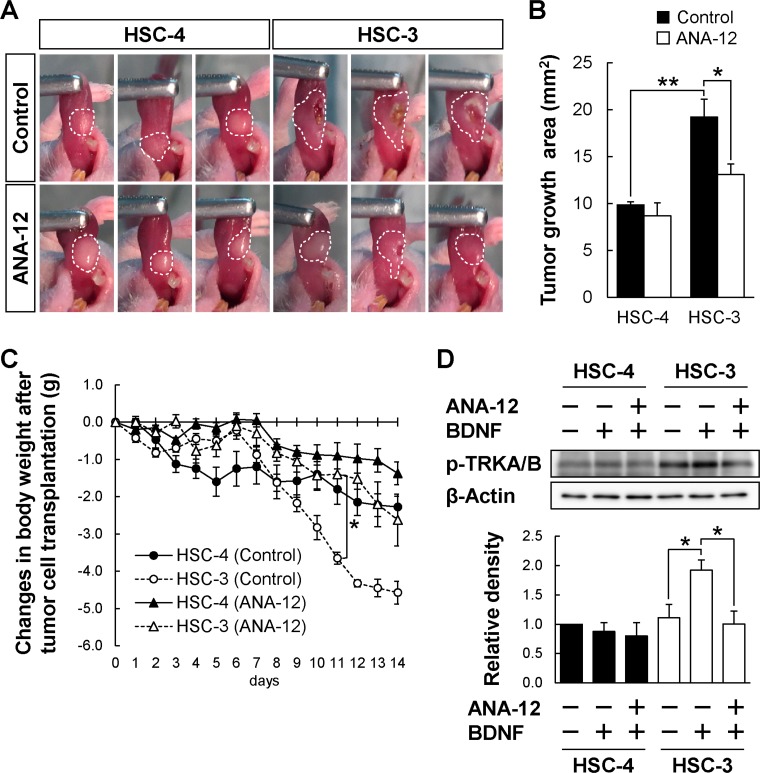
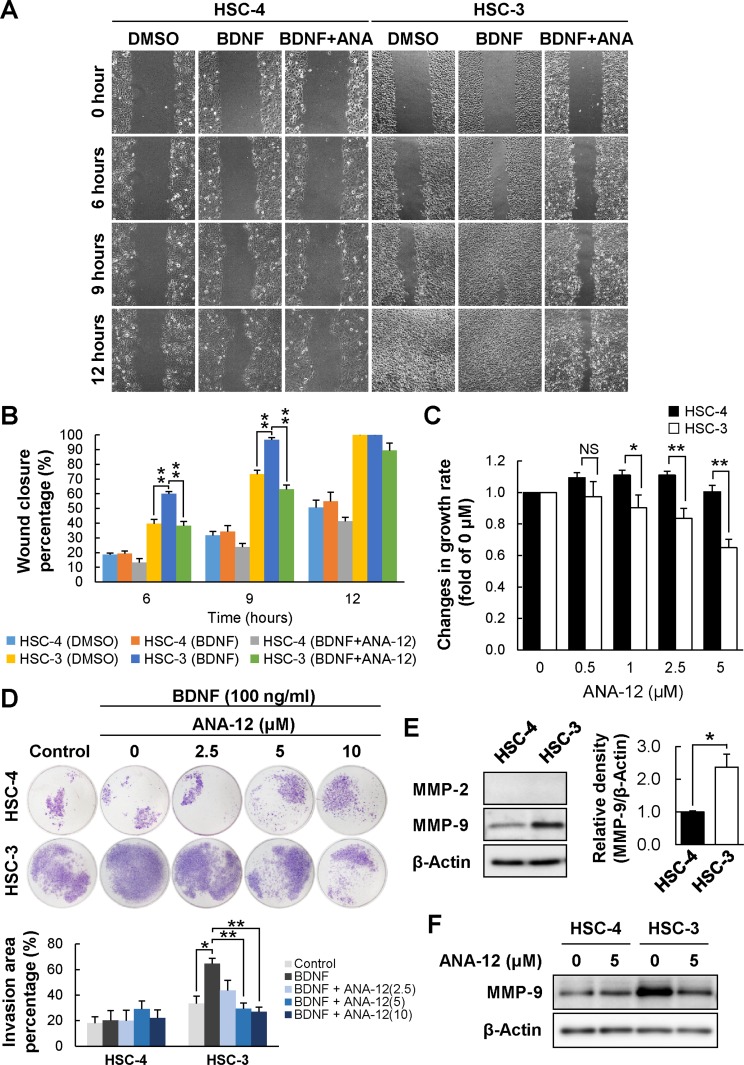
It has been reported that one of the neurotrophin receptors, tropomyosin receptor kinase B (TRKB), is frequently overexpressed in various tumor tissues including oral squamous cell carcinoma (OSCC), and that its upregulation promotes tumor progression in human cancers. However, the correlation between TRKB overexpression and clinicopathological characteristics is not fully elucidated. Here, we present the correlation between the expression levels of TRKB and/or its secreted ligand, brain-derived neurotrophic factor (BDNF), and clinicopathological characteristics, especially regarding tumor differentiation, tissue invasion, and disease-free survival in patients with OSCC. The results obtained through immunohistochemical analysis of human OSCC tumor specimens showed that the expression levels of TRKB and/or BDNF, were significantly higher in moderately and poorly differentiated OSCC (MD/PD-OSCC) tumor cells than in well differentiated cells (WD-OSCC). Moreover, the OSCC tumors highly expressing TRKB and/or BDNF exhibited promotion in tissue invasion and reduction in disease-free survival in the patients. In an orthotopic transplantation mouse model of human OSCC cell lines, administration of a TRKB-specific inhibitor significantly suppressed the tumor growth and invasion in PD-OSCC-derived tumor cells, but not in WD-OSCC-derived tumor cells. Moreover, the TRKB inhibitor selectively blocked BDNF-induced tumor cell proliferation and migration accompanied with the suppression of TRKB phosphorylation in PD-OSCC but not in WD-OSCC in vitro. Taken together, these data suggest that the BDNF/TRKB signaling pathway may regulate tumor progression in poorly differentiated OSCC. Expression levels of signal molecules may be an accurate prognosis marker for tumor aggressiveness, and the molecules may be an attractive target for new OSCC therapies.

Keywords: TRKB; anti-cancer drug; oral squamous cell carcinoma; prognostic factors; tumor differentiation.


Conflict of interest statement

CONFLICTS OF INTEREST The authors declare no potential conflicts of interest.

Figures

Figure 1
Figure 1. Higher expressions of TRKB and BDNF in moderately or poorly differentiated human OSCC
(AD) Representative H&E staining images of the tumor tissues from patients with OSCC. (EL) Immunohistochemical detection of TRKB (E–H) and BDNF (I–L) in the tumor tissues. Representative images of well differentiated (WD) and moderately/poorly differentiated (MD/PD) OSCC tumors are shown in the left and right panels, respectively. Bars represent 500 μm (A, B, E, F, I, and J) and 100 μm (C, D, G, H, K, and L).
Figure 2
Figure 2. Two-year disease-free survival rate of patients with OSCC
Relationships between 2-year disease-free survival and (A) TRKB overexpression, (B) BDNF overexpression, (C) TRKB/BDNF overexpression, and (D) tumor differentiation were analyzed using the Kaplan–Meier method. *P < 0.05.
Figure 3
Figure 3. Elevated expressions of TRKB and BDNF in moderately or poorly differentiated human OSCC cells
(A and B) H&E staining and immunohistochemical detection of TRKB (A) and BDNF (B) in well differentiated grade OSCC obtained from the same patients (TRKB, n = 6; BDNF, n = 4). The representative images from three cases are shown. Bars: 100 μm. (C) The staining intensities of TRKB and BDNF in the tumors are shown in histograms with means ± SEM. Open bars and filled bars show the WD-OSCC and MD/PD-OSCC tumors, respectively. *P < 0.05. (D) Representative images of immunohistochemical detection of TRKB and BDNF in the invasive front of WD-OSCC tumors. Tumoral (T) and non-tumoral (N) areas are indicated. Bars represent 100 μm (left panels) and 25 μm (right panels).
Figure 4
Figure 4. Higher expression of TRKB in HSC-3 poorly differentiated OSCC cell line
(A) Phase contrast images of HSC-4 (well differentiated) and HSC-3 (poorly differentiated) human OSCC cell lines. Bar: 50 μm. (B) TRKB expression levels in HSC-4 and HSC-3 cells were determined by Western blot analysis using anti-TRKB antibody. Histograms show the means ± SEM (n = 4 in each cell line) of the densitometry analyses of the blot (HSC-4, filled bar; HSC-3, open bar) as a ratio against control value. β-Actin was used as the loading control. *P < 0.05. (C) TRKB and BDNF expressions in HSC-4 and HSC-3 cells were analyzed by immunofluorescence using indicated antibodies. Arrowheads indicate cell-cell junctions visualized by ZO-1-staining. Bar: 50 μm. (D and E) Cell proliferation assays were performed using HSC-4 and HSC-3 cells cultured for 72 hours in the presence (E) or absence (D) of BDNF (500 ng/mL), following the manufacturer's protocol (see Materials and Methods). Histograms show growth curves of HSC-4 and HSC-3 cells. Data are means ± SEM of triplicated wells from three independent experiments. HSC-4, solid line with filled circle; HSC-3, dashed line with open circle; HSC-4 (BDNF), solid line with filled triangle; HSC-3 (BDNF), dashed line with open triangle.
Figure 5
Figure 5. Higher tumor growth of HSC-3 cells orthotopically transplanted in nude mice
The difference in tumor growth between HSC-4 and HSC-3 cells was examined by orthotopic transplantation into BALB/cSlc-nu/nu mice. (A and B) The tumor growth area in the tongues was photographed every week (A). Histograms show the means ± SEM (HSC-4, filled bar; HSC-3, open bar; n = 3 in each group) of the tumor growth area (mm2) (B). *P < 0.05. (C) Changes in body weight after the tumor cell transplantation. The body weights were measured at the indicated day points (HSC-4, solid line with filled circle, n = 4; HSC-3, dashed line with open circle, n = 6). **P < 0.01. (D) Representative H&E staining and immunohistochemical detection of TRKB and BDNF in the tumor tissues. Representative images of HSC-4 and HSC-3 tumors are shown. Bars represent 500 μm (low magnification) and 100 μm (high magnification). (E) Representative images of immunohistochemical detection of TRKB and BDNF in the invasive front of HSC-4-derived tumors. Tumoral (T) and non-tumoral (N) areas are indicated. Bars represent 100 μm (left panels) and 25 μm (right panels).
Figure 6
Figure 6. Reduced HSC-3 tumor growth in mice administrated a TRKB-specific inhibitor
(AC) The effect of ANA-12, a specific TRKB inhibitor, on the tumor growth of HSC-4 and HSC-3 tumor cells in vivo. BALB/cSlc-nu/nu mice were orthotopically transplanted with these two tumor cell lines and intraperitoneally administrated control (DMSO) or ANA-12 (0.5 mg/kg, every 12 hours) 24 hours after the transplantation. The tumor growth areas in the tongues were photographed at day 14 after the transplantation (A). Histograms show the means ± SEM (control, filled bar; ANA-12, open bar; n = 4 in each group) of the tumor growth area (mm2) (B). **P < 0.01 and *P < 0.05. (C) Changes in body weight after the tumor cell transplantation. The body weights were measured every day after the transplantation (control, solid line; ANA-12, dashed line; HSC-4, filled circle or triangle; HSC-3, open circle or triangle; n = 4 in each group). **P < 0.01. (D) The effect of ANA-12 on the BDNF-induced phosphorylation of TRKB was examined by Western blot analysis using anti-phospho-TRKA/B antibody. Cultured HSC-4 and HSC-3 cells were pre-treated with ANA-12 (10 μM) for 1 hour, and subsequently cultured for 20 minutes in the presence or absence of BDNF (100 ng/mL). β-Actin was used as the loading control. Histograms show the means ± SEM (three independent experiments) of the densitometry analyses of the blot (HSC-4, solid bar; HSC-3, filled bar) as a ratio against control value. Note: BDNF-induced TRKA/B phosphorylation and suppression of the phosphorylation were observed only in HSC-3 cells but not in HSC-4 cells. *P < 0.05.
Figure 7
Figure 7. Reduced cell migration and proliferation of HSC-3 following treatment with a TRKB-specific inhibitor
The effects of ANA-12 on cell migration and proliferation were examined by wound healing assay (A and B) and WST-8 cell proliferation assay (C), respectively. (A and B) Wound healing assays were performed using HSC-4 and HSC-3 treated with BDNF (100 ng/mL) in the presence or absence of ANA-12 (10 μM) for 12 hours. The migrating cells were photographed every 3 hours (A) and cell migration was estimated as wound closure percentage (B). Histograms show the means ± SEM of the percentages of wound closure at 6, 9, and 12 hours. **P < 0.01 and *P < 0.05. NS, not significant. (C) Cell proliferation assays were performed using HSC-4 and HSC-3 cells cultured for 72 hours in the presence or absence of ANA-12 (0, 0.5, 1, 2.5, and 5 μM), following the manufacturer's protocol (see Materials and Methods). Histograms show changes in growth rate relative to control (0 μM) as the means ± SEM of triplicated wells from at least three independent experiments (HSC-4, n = 6; HSC-3, n = 3). Filled bars and open bars show HSC-4 and HSC-3 cells, respectively. **P < 0.01 and *P < 0.05. NS, not significant. (D) Transwell Matrigel invasion assays were performed using HSC-4 and HSC-3 cells cultured for 24 hours in the presence or absence of ANA-12 (0, 2.5, 5, 10 μM). Histograms show the percentage of invasion area to filter as the means ± SEM of three independent experiments. **P < 0.01 and *P < 0.05. (E) Expression levels of MMP-2 and MMP-9 in these cells were determined by Western blot analysis. Histograms show the means ± SEM (n = 3 in each cell line) of the densitometry analyses of the blot (HSC-4, filled bar; HSC-3, open bar) as a ratio against control value. β-Actin was used as the loading control. *P < 0.05. (F) The cells were cultured for 24 hours in the presence or absence of ANA-12 (5 μM) and the effect of ANA-12 on MMP-9 expression in these cells were examined by Western blot analysis.

References

    1. Brown LM, Check DP, Devesa SS. Oral cavity and pharynx cancer incidence trends by subsite in the United States: changing gender patterns. J Oncol. 2012;2012:649498. https://doi.org/10.1155/2012/649498. - DOI - PMC - PubMed
    1. Patel SC, Carpenter WR, Tyree S, Couch ME, Weissler M, Hackman T, Hayes DN, Shores C, Chera BS. Increasing incidence of oral tongue squamous cell carcinoma in young white women, age 18 to 44 years. J Clin Oncol. 2011;29:1488–94. https://doi.org/10.1200/JCO.2010.31.7883. - DOI - PubMed
    1. Torre LA, Bray F, Siegel RL, Ferlay J, Lortet-Tieulent J, Jemal A. Global cancer statistics, 2012. CA Cancer J Clin. 2015;65:87–108. https://doi.org/10.3322/caac.21262. - DOI - PubMed
    1. Sano D, Myers JN. Metastasis of squamous cell carcinoma of the oral tongue. Cancer Metastasis Rev. 2007;26:645–62. https://doi.org/10.1007/s10555-007-9082-y. - DOI - PubMed
    1. Camisasca DR, Silami MA, Honorato J, Dias FL, de Faria PA, Lourenco Sde Q. Oral squamous cell carcinoma: clinicopathological features in patients with and without recurrence. ORL J Otorhinolaryngol Relat Spec. 2011;73:170–6. https://doi.org/10.1159/000328340. - DOI - PubMed

LinkOut - more resources