. 2015 Dec 1;6(12):6847-6864.
doi: 10.1039/c5sc02099a. Epub 2015 Aug 20.

Comparison of rhenium-porphyrin dyads for CO2 photoreduction: photocatalytic studies and charge separation dynamics studied by time-resolved IR spectroscopy

Affiliations

Comparison of rhenium-porphyrin dyads for CO2 photoreduction: photocatalytic studies and charge separation dynamics studied by time-resolved IR spectroscopy

Christopher D Windle et al. Chem Sci. .

Abstract

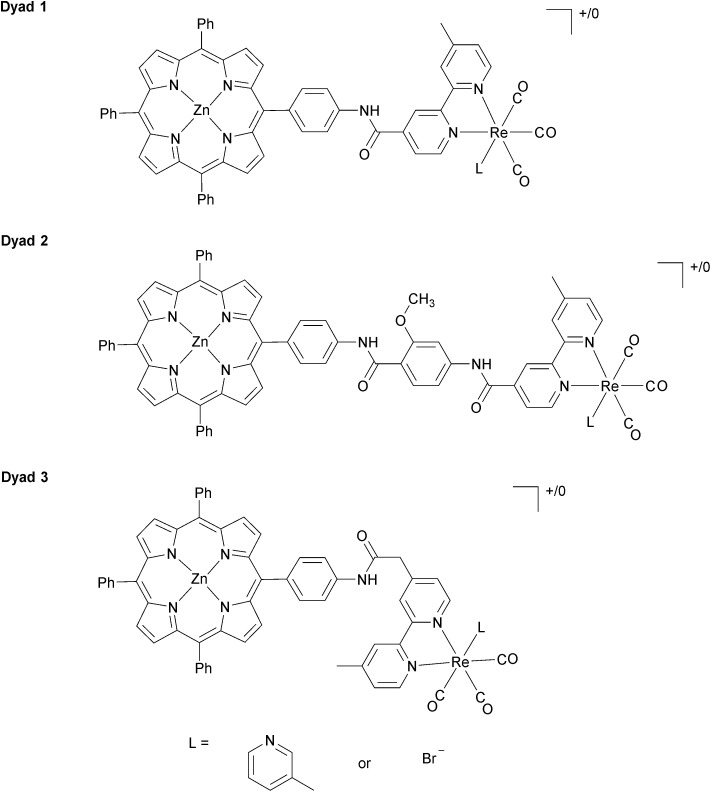
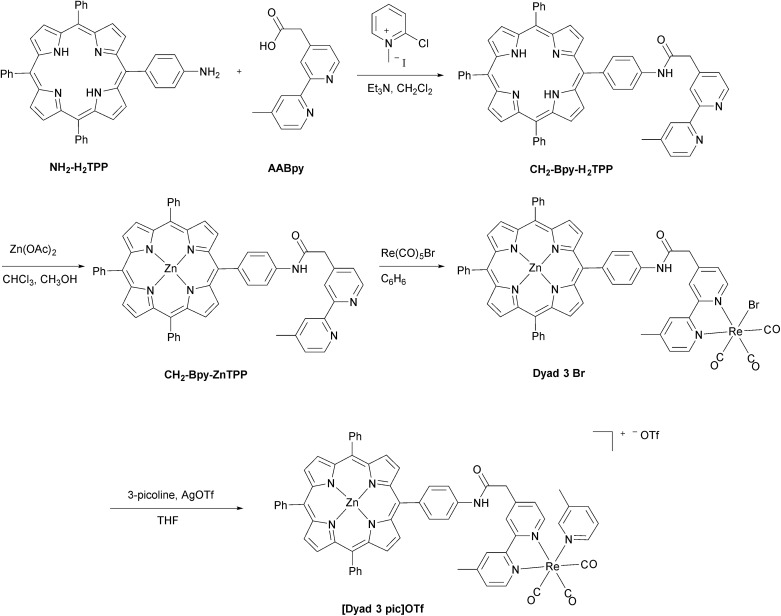
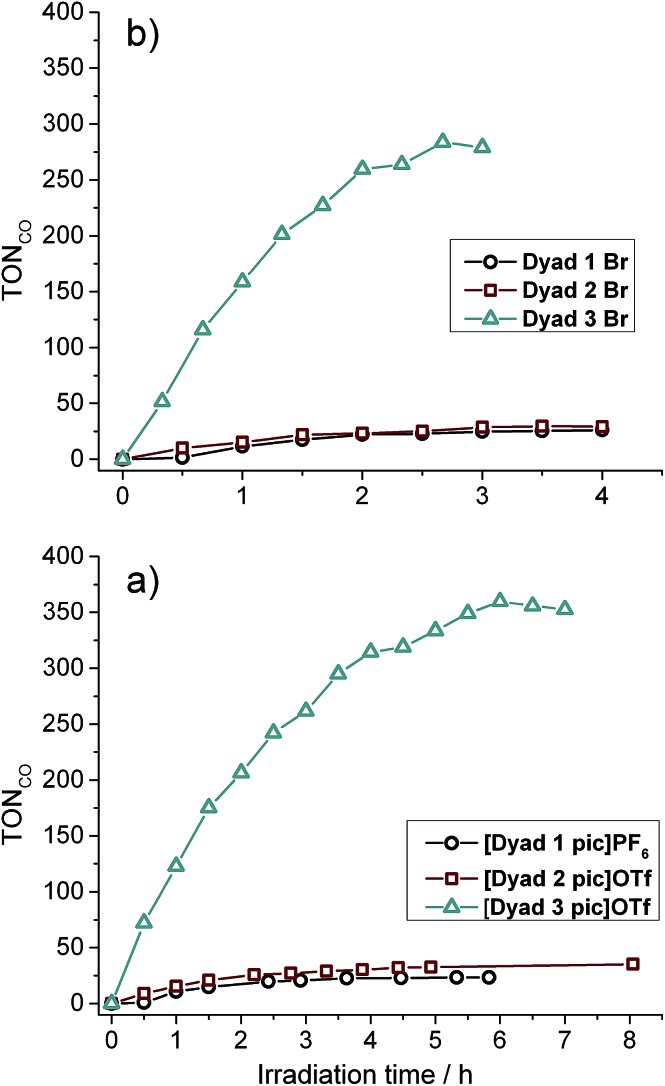
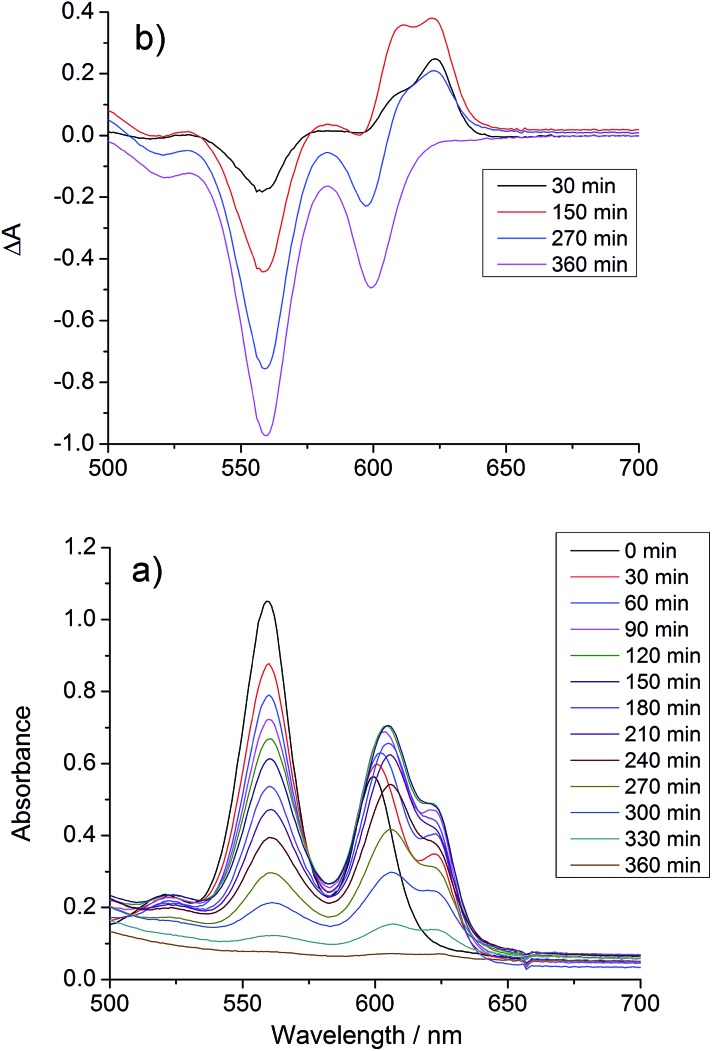
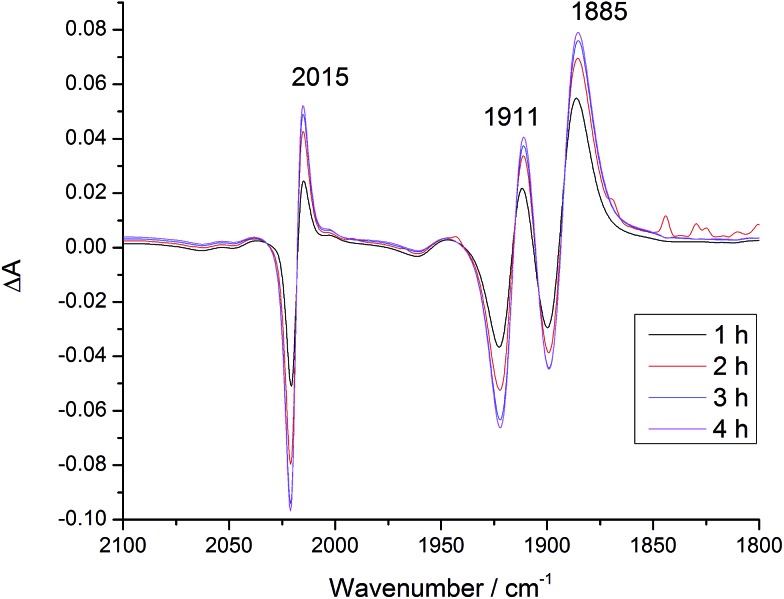
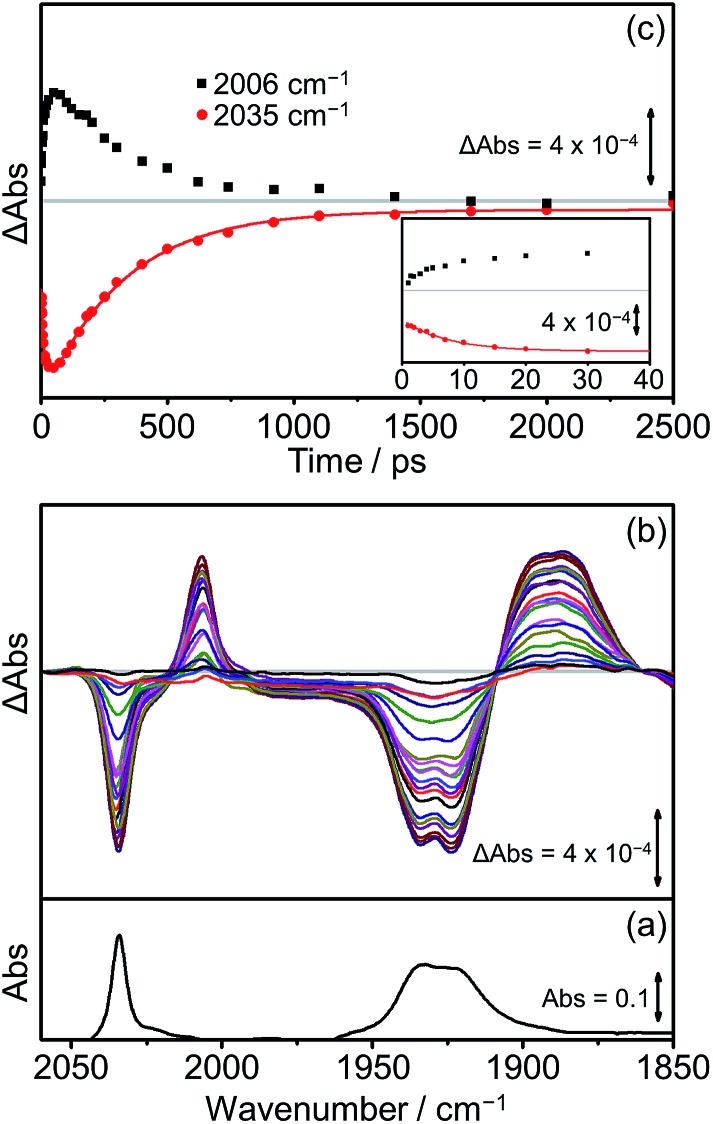
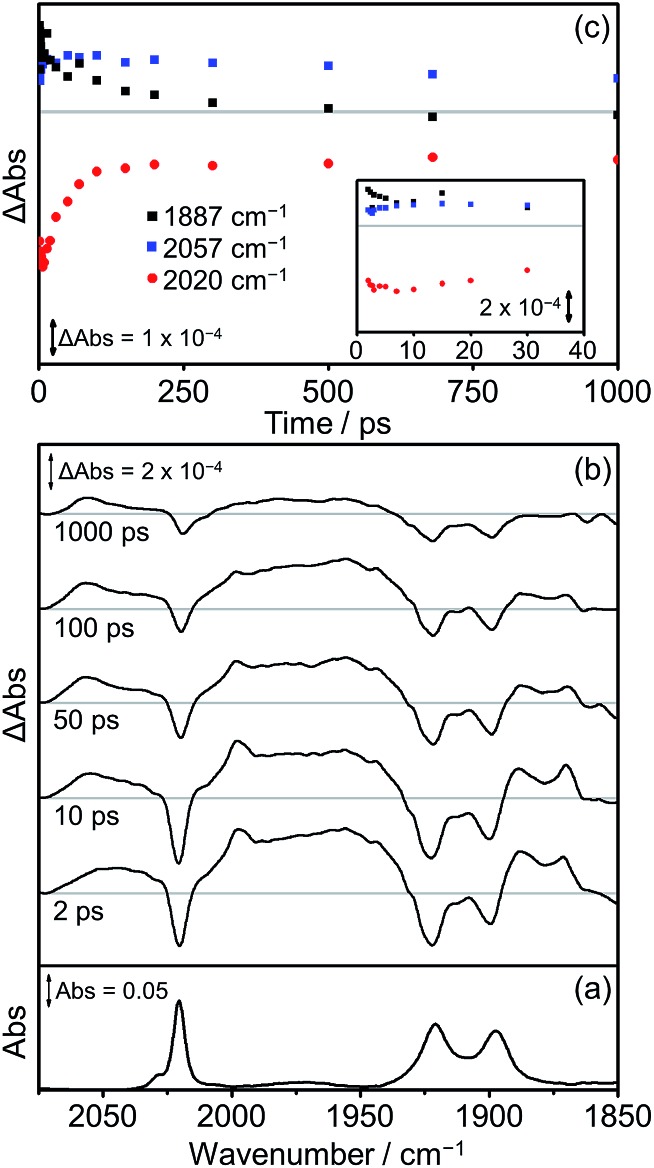
We report a study of the photocatalytic reduction of CO2 to CO by zinc porphyrins covalently linked to [ReI(2,2'-bipyridine)(CO)3L]+/0 moieties with visible light of wavelength >520 nm. Dyad 1 contains an amide C6H4NHC(O) link from porphyrin to bipyridine (Bpy), Dyad 2 contains an additional methoxybenzamide within the bridge C6H4NHC(O)C6H3(OMe)NHC(O), while Dyad 3 has a saturated bridge C6H4NHC(O)CH2; each dyad is studied with either L = Br or 3-picoline. The syntheses, spectroscopic characterisation and cyclic voltammetry of Dyad 3 Br and [Dyad 3 pic]OTf are described. The photocatalytic performance of [Dyad 3 pic]OTf in DMF/triethanolamine (5 : 1) is approximately an order of magnitude better than [Dyad 1 pic]PF6 or [Dyad 2 pic]OTf in turnover frequency and turnover number, reaching a turnover number of 360. The performance of the dyads with Re-Br units is very similar to that of the dyads with [Re-pic]+ units in spite of the adverse free energy of electron transfer. The dyads undergo reactions during photocatalysis: hydrogenation of the porphyrin to form chlorin and isobacteriochlorin units is detected by visible absorption spectroscopy, while IR spectroscopy reveals replacement of the axial ligand by a triethanolaminato group and insertion of CO2 into the latter to form a carbonate. Time-resolved IR spectra of [Dyad 2 pic]OTf and [Dyad 3 pic]OTf (560 nm excitation in CH2Cl2) demonstrated electron transfer from porphyrin to Re(Bpy) units resulting in a shift of ν(CO) bands to low wavenumbers. The rise time of the charge-separated species for [Dyad 3 pic]OTf is longest at 8 (±1) ps and its lifetime is also the longest at 320 (±15) ps. The TRIR spectra of Dyad 1 Br and Dyad 2 Br are quite different showing a mixture of 3MLCT, IL and charge-separated excited states. In the case of Dyad 3 Br, the charge-separated state is absent altogether. The TRIR spectra emphasize the very different excited states of the bromide complexes and the picoline complexes. Thus, the similarity of the photocatalytic data for bromide and picoline dyads suggests that they share common intermediates. Most likely, these involve hydrogenation of the porphyrin and substitution of the axial ligand at rhenium.


Figures

Fig. 1
Fig. 1. Structure of Dyads 1–3. When L = 3-picoline, the dyads are positively charged, and labelled [Dyad 1 pic]PF6, [Dyad 2 pic]OTf, and [Dyad 3 pic]OTf. The Br complexes are neutral and are labelled Dyad 1 Br, Dyad 2 Br, and Dyad 3 Br.
Fig. 2
Fig. 2. Preparation of [Dyad 3 pic]OTf.
Fig. 3
Fig. 3. X-ray crystal structure of [Dyad 1 pic]PF6 showing the asymmetric unit. Hydrogen atoms and disorder at one phenyl omitted for clarity. Thermal ellipsoids shown with probability of 50%. Two asymmetric units are linked head-to-tail to form a dimer bound through Zn–O(1) bonds (see Fig. S15†).
Fig. 4
Fig. 4. Catalytic activity of all dyads: (a) picoline complexes. (b) bromide complexes. Note the difference in abscissa scales.
Fig. 5
Fig. 5. Changes in the UV/vis spectrum of [Dyad 3 pic]OTf during CO2 photo-reduction: (a) absorption spectrum, (b) difference spectrum, relative to initial spectrum.
Fig. 6
Fig. 6. Photo-reduction of zinc porphyrin.
Fig. 7
Fig. 7. IR difference spectra of Dyad 2 Br in DMF after addition of TEOA (DMF : TEOA 5 : 1), under CO2 and with λ > 520 nm irradiation. Difference spectra relative to before addition of TEOA and CO2.
Fig. 8
Fig. 8. FTIR and TRIR spectra of [Dyad 2 pic]OTf in CH2Cl2: (a) FTIR ground state spectrum; (b) TRIR difference spectra taken between 1 and 2500 ps after flash photolysis at 560 nm; (c) TRIR single point kinetic traces for the formation and decay of the CS product (black squares, 2011 cm–1) and the depletion and reformation of the ground state bands (red dots, 2035 cm–1). The solid red line is a bi-exponential fit of the data. Inset shows expansion of the first 40 ps.
Fig. 9
Fig. 9. FTIR and TRIR spectra of [Dyad 3 pic]OTf in CH2Cl2: (a) FTIR ground state spectrum; (b) TRIR difference spectra taken between 1 and 2500 ps after flash photolysis at 560 nm; (c) TRIR single point kinetic traces for the formation and decay of the CS product (black squares, 2006 cm–1) and the depletion and reformation of the ground state bands (red dots, 2035 cm–1). The solid red lines are mono-exponential fits of the data. Inset shows expansion of the first 40 ps.
Fig. 10
Fig. 10. FTIR and TRIR spectra of Dyad 1 Br in THF: (a) FTIR ground state spectrum; (b) TRIR difference spectra taken at 2, 10, 50, 100 and 1000 ps after flash photolysis at 560 nm; (c) TRIR single point kinetic traces for the depletion and reformation of the ground state bands (red dots, 2022 cm–1) and the growth and decay of the 3MLCT excited state (blue squares, 2055 cm–1). Inset shows expansion of the first 40 ps.
Fig. 11
Fig. 11. FTIR and TRIR spectra of Dyad 2 Br in THF: (a) FTIR ground state spectrum; (b) TRIR difference spectra taken between 2, 10, 50, 100 and 1000 ps after flash photolysis at 560 nm; (c) TRIR single point kinetic traces for the CS product (black squares, 1887 cm–1), the ground state bands (red dots, 2020 cm–1) and the 3MLCT excited state (blue squares, 2057 cm–1). Inset shows expansion of the first 40 ps.
Fig. 12
Fig. 12. FTIR and TRIR spectra of Dyad 3 Br in THF: (a) FTIR ground state spectrum; (b) TRIR difference spectra taken 2, 10, 50, 100 and 1000 ps after flash photolysis at 560 nm; (c) TRIR single point kinetic traces for the ground state bands (red dots, 2020 cm–1) and the 3MLCT excited state (blue squares, 2055 cm–1). Inset shows expansion of the first 40 ps.

References

    1. Aresta M., Dibenedetto A. Dalton Trans. 2007:2975–2992. - PubMed
    1. Lewis N. S., Nocera D. G. Proc. Natl. Acad. Sci. U. S. A. 2006;103:15729–15735. - PMC - PubMed
    1. Kaveevivitchai N., Chitta R., Zong R., El Ojaimi M., Thummel R. P. J. Am. Chem. Soc. 2012;134:10721–10724. - PubMed
    1. Farràs P., Maji S., Benet-Buchholz J., Llobet A. Chem.–Eur. J. 2013;19:7162–7172. - PubMed
    1. Zhang P., Wang M., Li C., Li X., Dong J., Sun L. Chem. Commun. 2010;46:8806–8808. - PubMed