. 2018:2:17-26.
doi: 10.1038/s41551-017-0182-x. Epub 2018 Jan 10.

Targeted repair of heart injury by stem cells fused with platelet nanovesicles

Affiliations

Targeted repair of heart injury by stem cells fused with platelet nanovesicles

Junnan Tang et al. Nat Biomed Eng. 2018.

Abstract

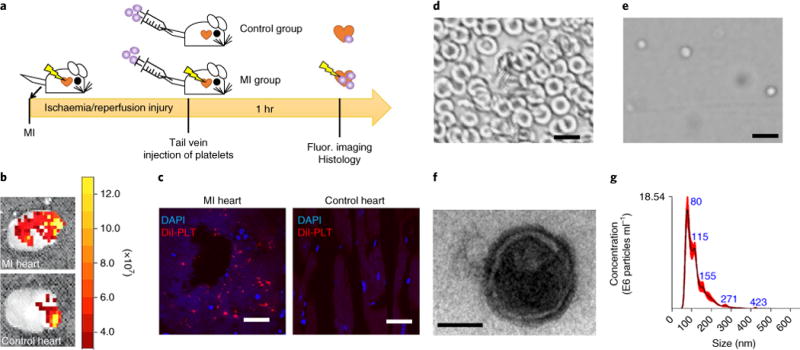
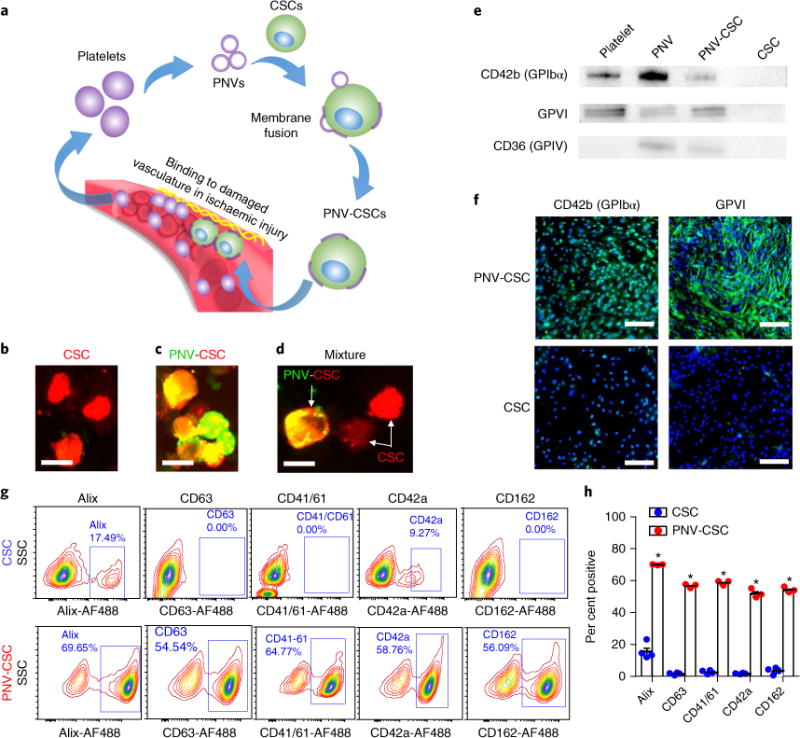
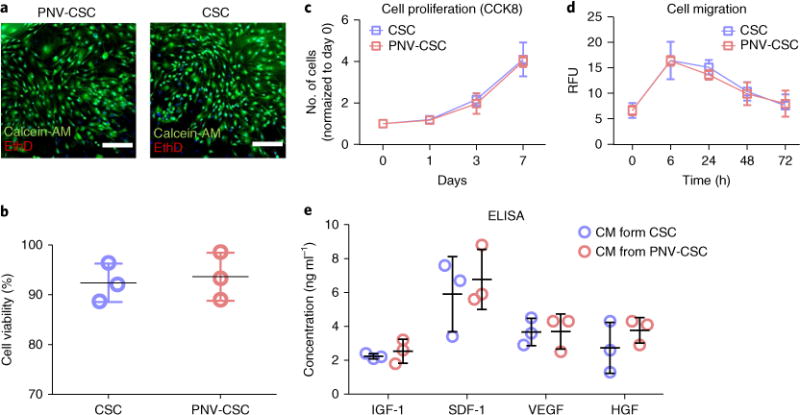
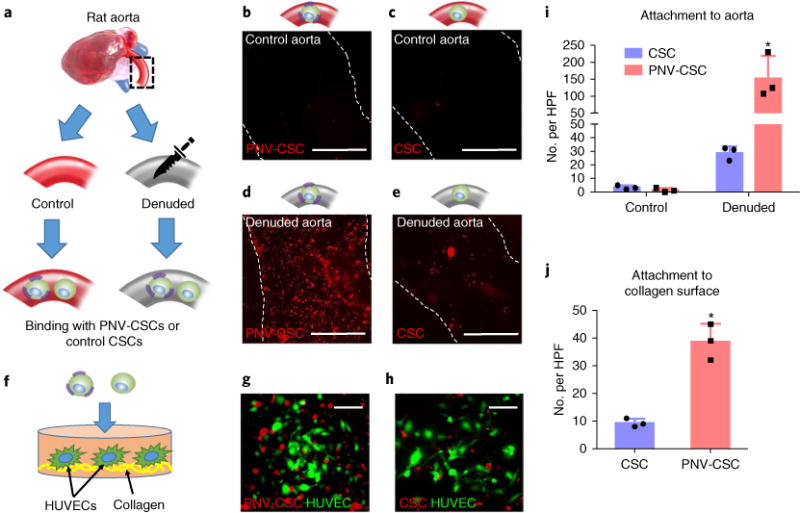
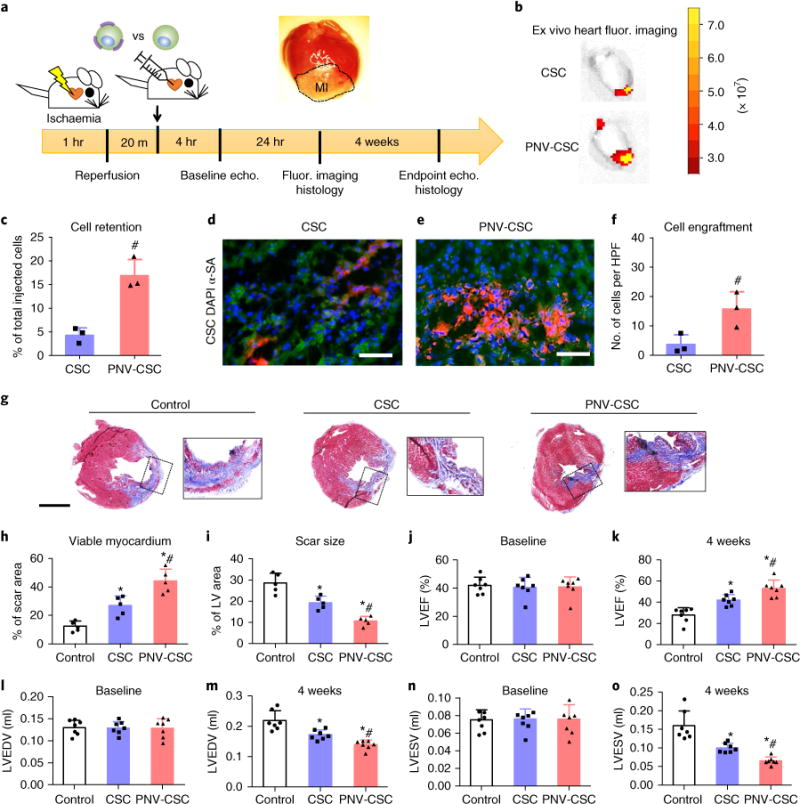
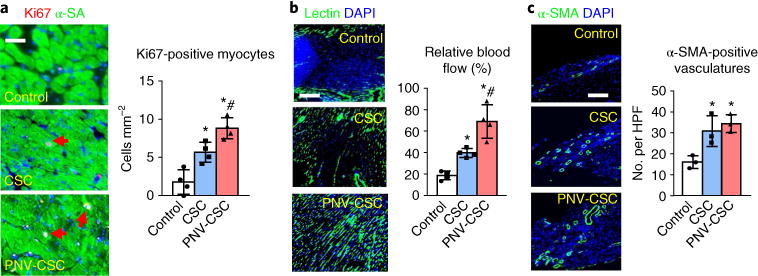
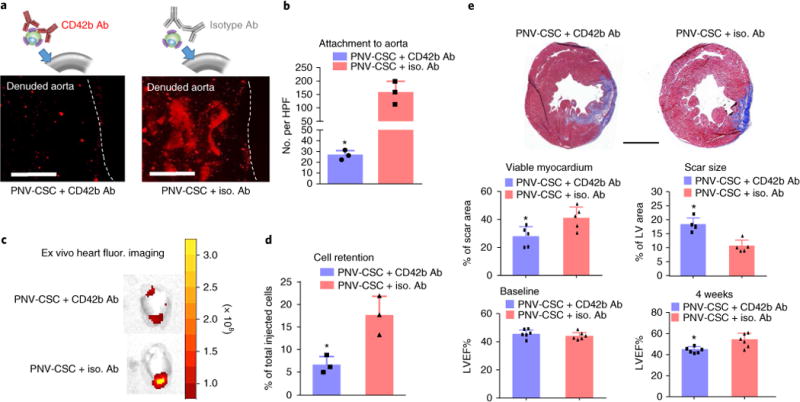
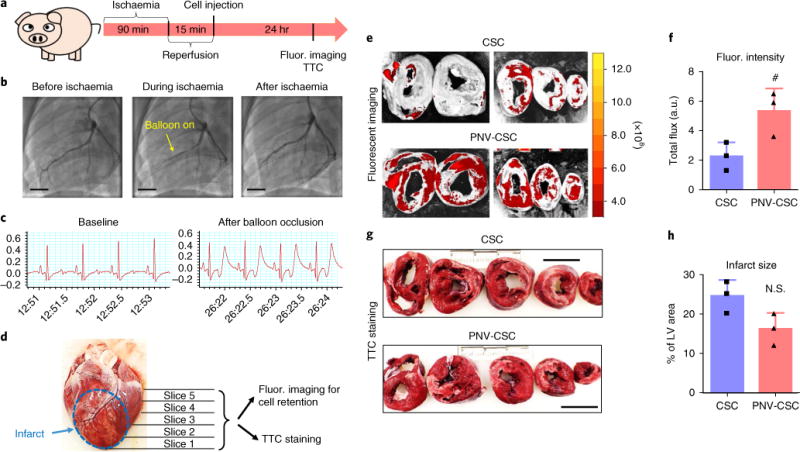
Stem cell transplantation, as used clinically, suffers from low retention and engraftment of the transplanted cells. Inspired by the ability of platelets to recruit stem cells to sites of injury on blood vessels, we hypothesized that platelets might enhance the vascular delivery of cardiac stem cells (CSCs) to sites of myocardial infarction injury. Here, we show that CSCs with platelet nanovesicles fused onto their surface membranes express platelet surface markers that are associated with platelet adhesion to injury sites. We also find that the modified CSCs selectively bind collagen-coated surfaces and endothelium-denuded rat aortas, and that in rat and porcine models of acute myocardial infarction the modified CSCs increase retention in the heart and reduce infarct size. Platelet-nanovesicle-fused CSCs thus possess the natural targeting and repairing ability of their parental cell types. This stem cell manipulation approach is fast, straightforward and safe, does not require genetic alteration of the cells, and should be generalizable to multiple cell types.


Conflict of interest statement

Competing interests The authors declare no competing interests.

Figures

Fig. 1
Fig. 1. Platelet binding to myocardial infarction sites and the derivation of platelet nanovesicles
a, A schematic showing the animal study design to test the innate binding ability of platelets to sites of myocardial infarction (MI). b, Representative ex vivo fluorescent imaging showing binding of intravenously injected DiI-labelled platelets in hearts with or without ischaemia/reperfusion (I/R) injury. c, Representative fluorescent microscopic images showing the targeting of Dil-labelled platelets (red) to the MI area (DAPI, nuclei). Scale bars, 100 μm. d,e, Collected rat red blood cells (d) as seen under a light microscope, demonstrating a distinctive morphology compared to platelets (e). Scale bars, 10 μm. f, A transmission electron micrograph of a platelet nanovesicle. Scale bar, 100 nm. g, Size examination of platelet membrane nanovesicles by NanoSight.
Fig. 2
Fig. 2. Generation and characterization of PNV-CSCs
a, A schematic showing the overview of PNV decoration and PNV-CSC therapy. b,c, Red fluorescent DiI-labelled CSCs (b) were fused with green fluorescent DiO-labelled PNVs to form PNV-CSCs (c). d, Co-incubation of CSCs (red) with PNV-CSCs (yellow). Scale bar, 20 μm. e, Western blot analysis revealed the expressions of platelet-specific markers including CD42b (GPIbα), GPVI and CD36 (GPIV) in platelets, PNVs and PNV-CSCs, but not in CSCs. Original western blot images can be found in Supplementary Figs. 2–4. f, Immunocytochemistry staining confirmed CD42b (GPIbα) and GPVI expression in PNV-CSCs (top), but not in CSCs (bottom). Scale bars, 200 μm. g,h, Flow cytometric analysis of platelet and exosome surface marker expressions on PNV-CSCs (n = 3) and CSCs (n = 4). *P< 0.05. All values are mean ± s.d. Two-tailed t-test for comparison.
Fig. 3
Fig. 3. The effects of PNV decoration on CSC viability and functions
a, Representative fluorescent micrographs showing live (calcein-AM, green) and dead (EthD, red) staining of PNV-CSCs and CSCs cultured on tissue culture plates for 7 d. Scale bars, 200 μm. b, Pooled data of cell viability (n = 3 per group). c, CCK8 assay measurement of proliferation of PNV-CSCs and CSCs cultured on tissue culture plates (n = 3 per group at each time point). d, Trans-well migration assay showing the migration potencies of PNV-CSCs or CSCs (n = 3 per group at each time point). e, Determination of the release of growth factors IGF-1, SDF-1, VEGF and HGF in the conditioned media (CM) from CSCs and PNV-CSCs (n = 3 per group) by ELISA. Values are mean ± s.d. Two-tailed t-test for comparison.
Fig. 4
Fig. 4. PNV decoration promotes CSC binding to damaged rodent vasculatures
a, A schematic showing the experimental design for denuded rat aorta binding. be, Representative fluorescent micrographs showing the adherence of DiI-labelled PNV-CSCs and CSCs on control (b,c) or denuded (d,e) aortas. Scale bars, 1 mm. f, A schematic showing PNV-CSCs (left) or CSCs (right) seeded on collagen-coated tissue culture slides. HUVECs, human umbilical vein endothelial cells. g,h, Representative fluorescent images showing the binding of DiI-labelled PNV-CSCs (g) or control CSCs (h) on HUVECs cultured on collagen surfaces. Scale bars, 50 μm. i,j, Quantitative analysis of cell binding (n = 3 experiments per group). *P< 0.05 when compared to CSC group. All values are mean ± s.d. Two-tailed t-test for comparison between the two groups. HPF, high-power field.
Fig. 5
Fig. 5. PNV decoration boosts CSC retention and therapeutic outcomes in rats with myocardial infarction
a, A schematic showing the animal study design. b, Representative ex vivo fluorescent imaging of ischaemia/reperfusion rat hearts 24 hrs after intracoronary infusion of DiI-labelled PNV-CSCs or CSCs. c, qPCR analysis revealed higher retention rates of PNV-CSCs as compared to those of CSCs (n = 3 animals/hearts per group). d,e, Representative fluorescent micrographs showing engrafted CSCs (d) or PNV-CSCs (e) in the post-MI hearts (green, α-SA antibody). Scale bars, 50 μm. f, Quantitative analysis of cell engraftment by histology (n = 3 animals/hearts per group). HPF, high-power field. g, Representative Masson’s trichrome-stained myocardial sections 4 weeks after treatment (blue, scar tissue; red, viable myocardium). Scale bar, 2 mm. h,i, Quantitative analyses of viable myocardium and scar size from the Masson’s trichrome images (n = 5 animals per group). LV, left ventricle. j,k, Left ventricular ejection fractions (LVEFs) measured by echocardiography at baseline (4 hrs post-MI) and 4 weeks later (n = 7 animals per group). l–o, Measurement of LV end-systolic (LVESV) and end-diastolic (LVEDV) volumes. *P<0.05 when compared to the control group; #P<0.05 when compared to the CSC groups. All values are mean ± s.d. Two-tailed t-test for comparison between two groups. One-way ANOVA with post-hoc Bonferroni test for comparisons that involve three or more groups.
Fig. 6
Fig. 6. PNV-CSC therapy promotes myocyte proliferation and angiogenesis
a, Representative images showing Ki67-positive cardiomyocyte nuclei (red, with red arrows) in control PBS-, CSC- or PNV-CSC-treated hearts at 4 weeks. Right: quantitative analysis of the numbers of Ki67-positive nuclei. n = 4 animals per group. Scale bar, 20 μm. b, Representative images indicating lectin-labelled blood vessels (green) in control PBS-, CSC- or PNV-CSC-treated hearts at 4 weeks. Right: quantification analysis of the lectin fluorescent intensities. n = 4 animals per group. Scale bar, 100 μm. c, Representative micrographs showing arterioles stained with antibody against α-smooth muscle actin (α-SMA, red) in PBS-, CSC- or PNV-CSC-treated hearts at 4 weeks. HPF, high-power field. The numbers of α-SMA-positive vasculatures were compared. n = 3 animals per group. Scale bar, 50 μm. *P< 0.05 when compared to the control group; #P< 0.05 when compared to the CSC group. All data are mean ± s.d. Comparisons were performed using one-way ANOVA followed by post-hoc Bonferroni test.
Fig. 7
Fig. 7. The role of CD42b in targeting PNV-CSCs to Mi injury
a, Representative fluorescent micrographs showing the adherence of anti-CD42b or isotype antibody pre-treated PNV-CSCs on denuded rat aortas. b, Quantitation of binding (n = 3 samples per group). HPF, high-power field. c, Representative ex vivo fluorescent imaging of ischaemia/reperfusion rat hearts 24 hrs after intracoronary infusion of anti-CD42b or isotype antibody pre-treated PNV-CSCs. d, Quantitation of cell retention by qPCR (n = 3 animals per group). e, Representative Masson’s trichrome-stained myocardial sections 4 weeks after treatment (blue, scar tissue; red, viable myocardium). Scale bar, 2 mm. Quantitative analyses of viable myocardium and scar size from the Masson’s trichrome images (n = 5 animals per group). Left ventricular ejection fractions (LVEFs) measured by echocardiography at baseline (4 hrs post-MI) and 4 weeks later (n = 6 animals per group). *P< 0.05 when compared to the PNV-CSC + iso. Ab group. All values are mean ± s.d. Two-tailed t-test for comparison.
Fig. 8
Fig. 8. PNV decoration augments CSC retention in a porcine model of ischaemia/reperfusion
a, A schematic showing the pig study design. b, Angiograms showing coronary flow and placement of balloon before, during and after ischaemia. Scale bars, 15 mm. c, Representative electrocardiograms at baseline and after balloon occlusion. d, A representative excised pig heart image showing the preparation of myocardium slices for ex vivo fluorescent imaging and TTC staining. e, Representative ex vivo fluorescent imaging of ischaemia/reperfusion pig hearts 24 hrs after intracoronary infusion of CM-DiI-labelled CSCs or PNV-CSCs. f, Quantitation of fluorescent signals in CSC- or PNV-CSC-treated hearts (n = 3 pigs per group). g, Representative TTC staining images showing infarct region (white). Scale bars, 4 cm. h, Quantitation of infarct size (n = 3 pigs per group). #P< 0.05 when compared to the CSC group. All values are mean ± s.d. Two-tailed t-test for comparison.

References

    1. Mozaffarian D, et al. Heart disease and stroke statistics—2015 update: a report from the American Heart Association. Circulation. 2015;131:29–322. - PubMed
    1. Madonna R, et al. Cell-based therapies for myocardial repair and regeneration in ischemic heart disease and heart failure. Eur Heart J. 2016;37:1789–1798. - PMC - PubMed
    1. Sepantafar M, et al. Stem cells and injectable hydrogels: synergistic therapeutics in myocardial repair. Biotechnol Adv. 2016;34:362–379. - PubMed
    1. Weissman IL. Translating stem and progenitor cell biology to the clinic: barriers and opportunities. Science. 2000;287:1442–1446. - PubMed
    1. Cheng K, et al. Magnetic antibody-linked nanomatchmakers for therapeutic cell targeting. Nat Commun. 2014;5:4880. - PMC - PubMed