. 2018 Mar 18:2018:9163052.
doi: 10.1155/2018/9163052. eCollection 2018.

Metformin Inhibits Mouse Islet Insulin Secretion and Alters Intracellular Calcium in a Concentration-Dependent and Duration-Dependent Manner near the Circulating Range

Affiliations

Metformin Inhibits Mouse Islet Insulin Secretion and Alters Intracellular Calcium in a Concentration-Dependent and Duration-Dependent Manner near the Circulating Range

Lindor Gelin et al. J Diabetes Res. .

Abstract

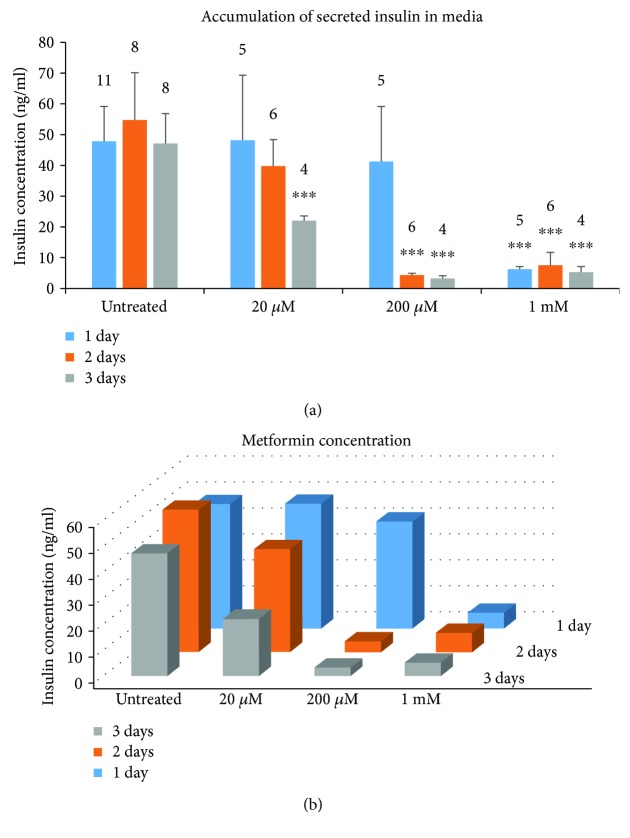
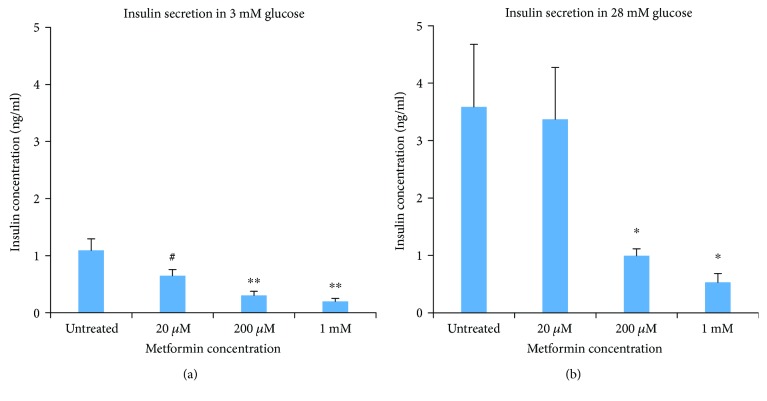
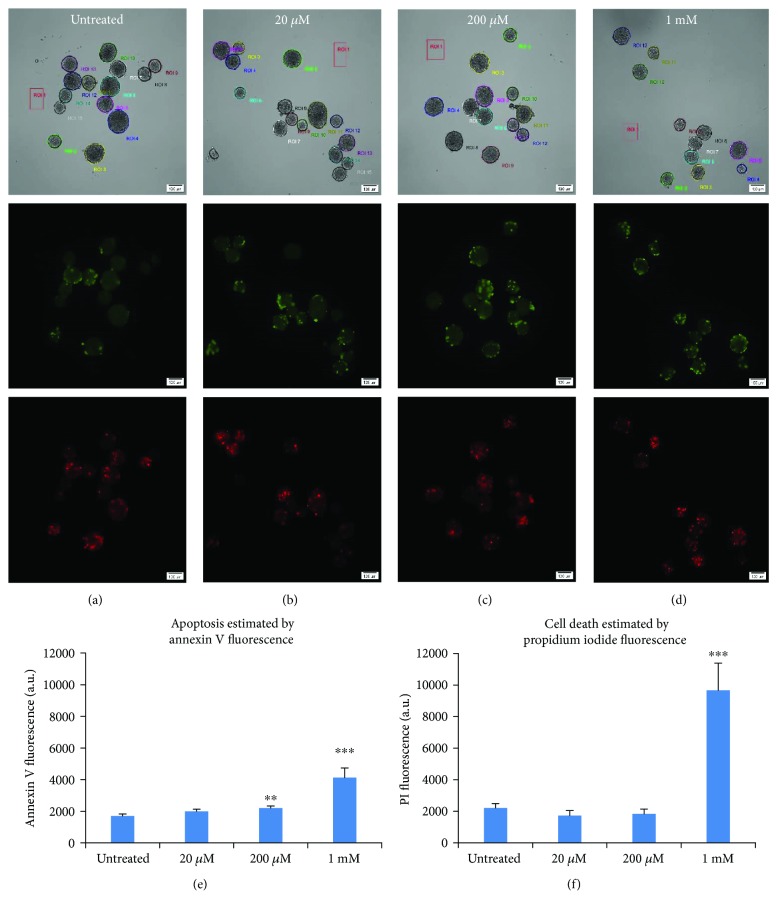
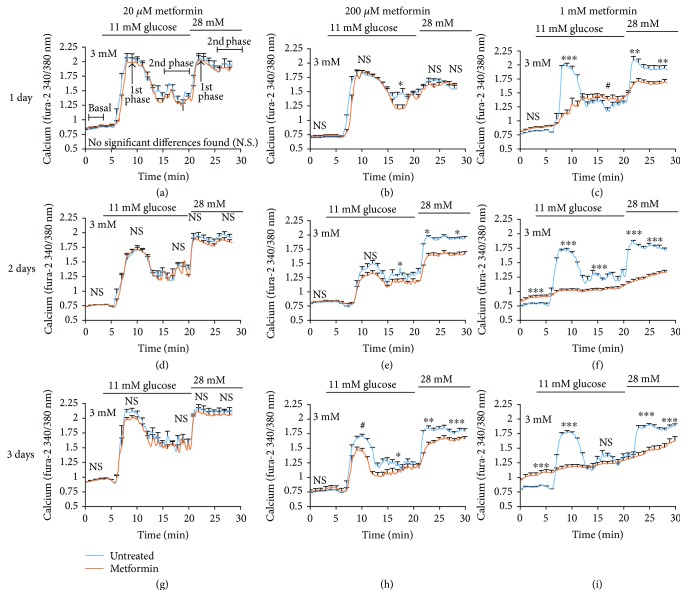
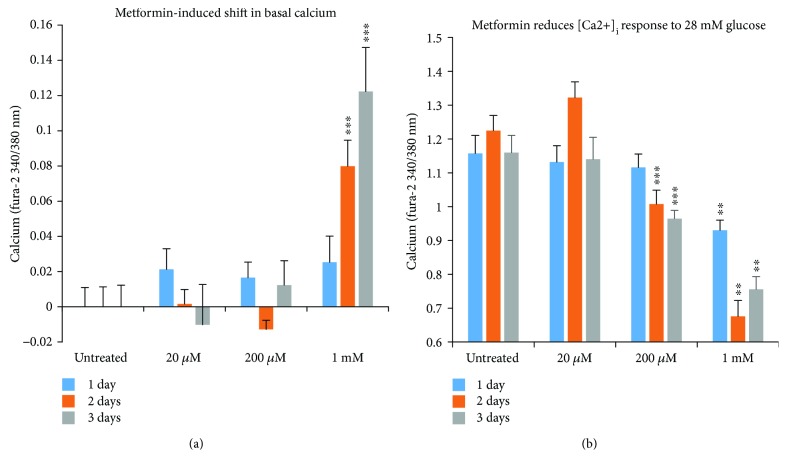
Metformin is considered the first-line treatment for type 2 diabetes. While metformin primarily increases insulin sensitivity, evidence also suggests that metformin affects the activity of insulin-secreting pancreatic islets. This study was designed to systematically examine the direct effects of metformin by measuring insulin secretion and the kinetics of the calcium response to glucose stimulation in isolated mouse islets using varying concentrations (20 μM, 200 μM, and 1 mM) and durations (~1, 2, and 3 days) of metformin exposure. We observed both concentration- and duration-dependent inhibitory effects of metformin. Concentrations as little as 20 μM (nearing circulating therapeutic levels) were sufficient to reduce insulin secretion following 3-day treatment. Concentrations of 200 μM and 1 mM produced more pronounced effects more rapidly. With 1 mM metformin, islets showed severe impairments in calcium handling, inhibition of insulin secretion, and increased cell death. No stimulatory effects of metformin were observed for any experimental endpoint. We conclude that the direct effects of metformin on islets are inhibitory at near-physiological concentrations. Beneficial effects of metformin observed on islets under various stressors may occur by "resting" fatigued cellular processes. However, metformin may have unintended consequences on normally functioning islets within the circulating range that require further evaluation.


Figures

Figure 1
Figure 1
Metformin exposure reduces insulin accumulation in media in a concentration- and duration-dependent manner. Media were collected from islets exposed to varying concentrations of metformin at 1-day intervals following 1, 2, or 3 days of exposure conducted in three separate trials. Insulin accumulation during these time periods was measured by ELISA. (a) Insulin secretion (Mean +/− SEM) for each concentration of metformin on the x-axis is displayed sequentially over time. (b) 3D plot of the same data to display both the time-dependent (back-to-front) and concentration-dependent (left-to-right) effects of metformin. Sets of 20 size-matched islets were used for each replicate. Numbers above each column indicate the number of replicates. ∗∗∗P < 0.001.
Figure 2
Figure 2
Glucose-stimulated insulin secretion (Mean +/− SEM) is inhibited following 3 days of metformin exposure. Set of 20 islets were incubated in 3 mM glucose (a) or 28 mM glucose (b) following metformin treatment at different concentrations for 3 days. N = 5 replicates for each condition conducted in three separate trials using islets from five different mice. #P < 0.10, P < 0.05, ∗∗P < 0.01.
Figure 3
Figure 3
Higher concentrations of metformin induce cell death. (a–d) Images of islets in bright field (top), annexin V fluorescence in green (middle), and PI in red (bottom) for islets exposed to no metformin (a, untreated), 20 μM (b), 200 μM (c), and 1 mM metformin (d). Regions of interest (ROIs) observed in bright field images were drawn around each islet for fluorescence quantification. (e–f) Quantification of fluorescence (Mean +/− SEM) for annexin V (e) and PI (f). ∗∗P < 0.01, ∗∗∗P < 0.001. Islet number for each condition ranged from N = 19 − 37 from two separate trials.
Figure 4
Figure 4
Metformin impairs glucose-stimulated [Ca2+]i responses. (a–c) Glucose-stimulated [Ca2+]i responses (Mean +/− SEM) from islets treated for 1 day with 20 μM (a), 200 μM (b), and 1 mM metformin (c). (d–f) Glucose-stimulated [Ca2+]i responses (Mean +/− SEM) in islets treated for 2 days with 20 μM (d), 200 μM (e), and 1 mM metformin (f). (g–i) Glucose-stimulated [Ca2+]i responses (Mean +/− SEM) in islets treated for 3 days with 20 μM (g), 200 μM (h), and 1 mM metformin (i). A total of 436 individual islet traces were studied in two trials combined for analysis; 17–33 islets were recorded for each metformin condition. Phases of the calcium response are labeled only in (a) but occur similarly for each panel. Statistically different means in [Ca2+]i between untreated and metformin-treated islets are reported as follows: N.S. = not significant, #P < 0.10, P < 0.05, ∗∗P < 0.01, ∗∗∗P < 0.001.
Figure 5
Figure 5
Metformin-induced changes in islet [Ca2+]i handling (Mean +/− SEM). (a) Basal shift from control in the fura-2 ratio representing [Ca2+]i levels for each concentration and duration of metformin for data described in Figure 4. A large increase in basal [Ca2+]i levels (in 3 mM glucose) is seen for islets treated with 1 mM metformin, suggesting possible issues with islet calcium handling. (b) Net increase in fura-2 ratio (peak in 28 mM glucose minus basal) indicating glucose-stimulated change in [Ca2+]i. ∗∗P < 0.01, ∗∗∗P < 0.001.

Similar articles

Cited by

References

    1. Inzucchi S. E. Is it time to change the type 2 diabetes treatment paradigm? No! Metformin should remain the foundation therapy for type 2 diabetes. 2017;40(8):1128–1132. doi: 10.2337/dc16-2372. - DOI - PubMed
    1. Viollet B., Guigas B., Garcia N. S., Leclerc J., Foretz M., Andreelli F. Cellular and molecular mechanisms of metformin: an overview. 2012;122(6):253–270. doi: 10.1042/CS20110386. - DOI - PMC - PubMed
    1. Madiraju A. K., Erion D. M., Rahimi Y., et al. Metformin suppresses gluconeogenesis by inhibiting mitochondrial glycerophosphate dehydrogenase. 2014;510(7506):542–546. doi: 10.1038/nature13270. - DOI - PMC - PubMed
    1. McCreight L. J., Bailey C. J., Pearson E. R. Metformin and the gastrointestinal tract. 2016;59(3):426–435. doi: 10.1007/s00125-015-3844-9. - DOI - PMC - PubMed
    1. Tilg H., Moschen A. R. Microbiota and diabetes: an evolving relationship. 2014;63(9):1513–1521. doi: 10.1136/gutjnl-2014-306928. - DOI - PubMed

LinkOut - more resources