. 2018 Jun 4:7:e36688.
doi: 10.7554/eLife.36688.

Chimeric antigen receptors that trigger phagocytosis

Affiliations

Chimeric antigen receptors that trigger phagocytosis

Meghan A Morrissey et al. Elife. .

Abstract

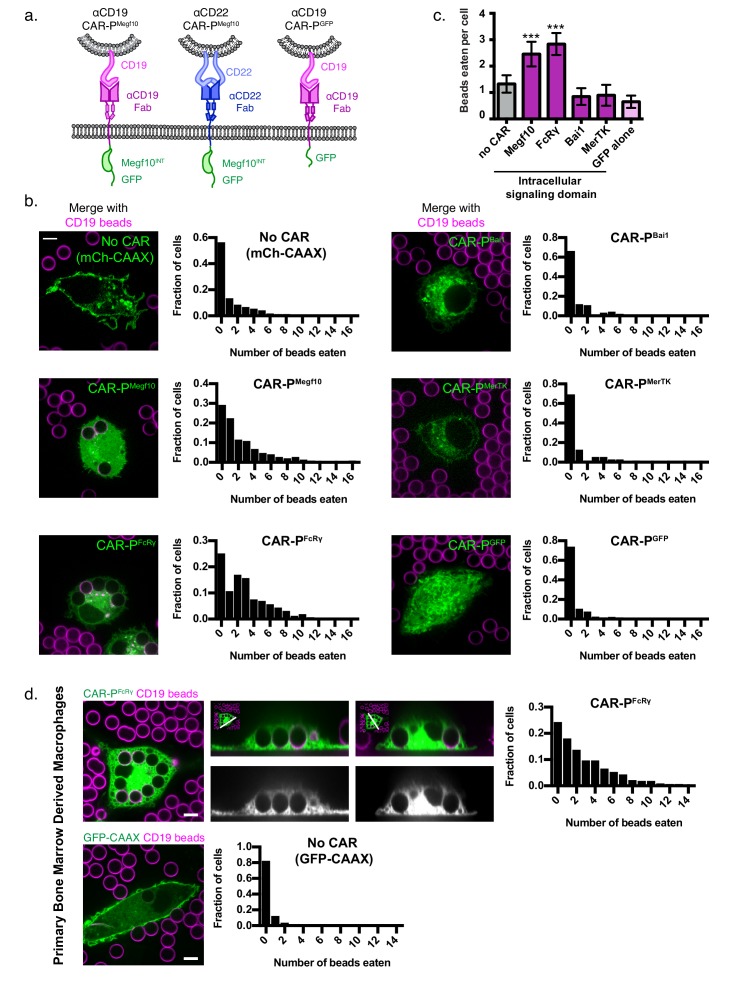
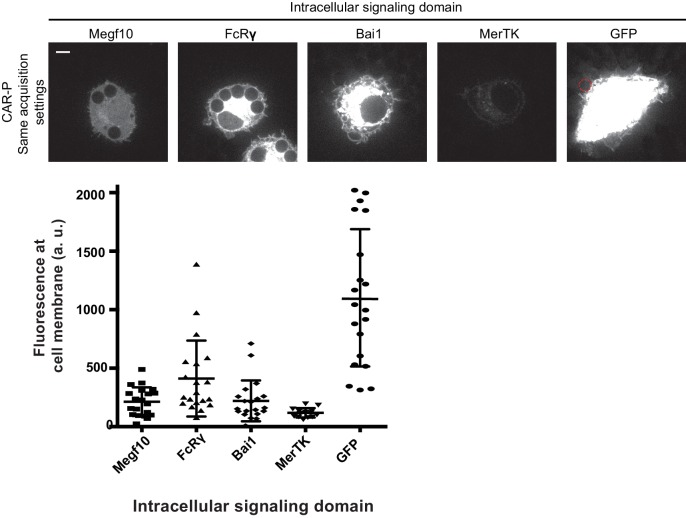
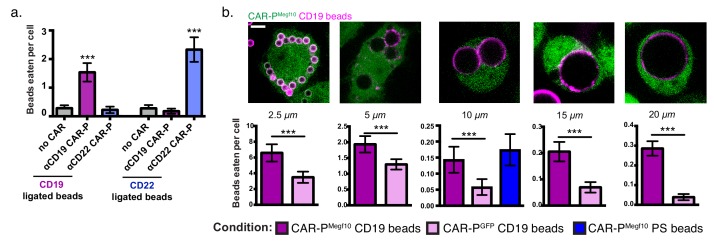
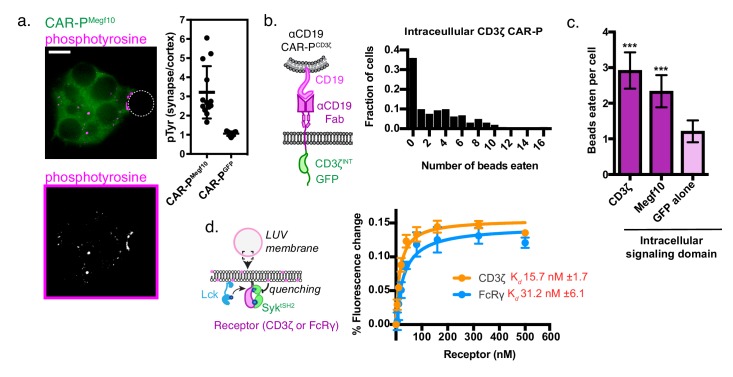
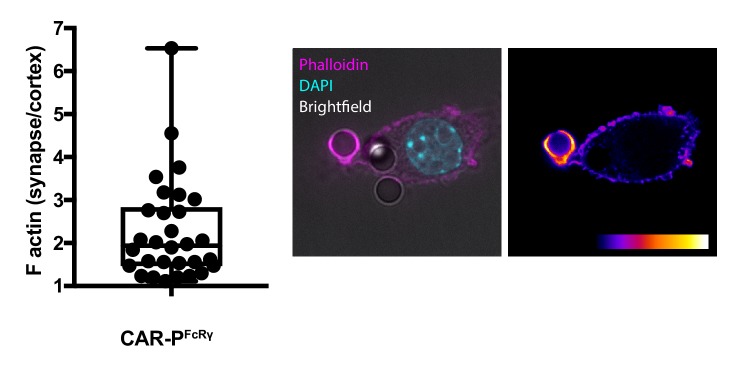
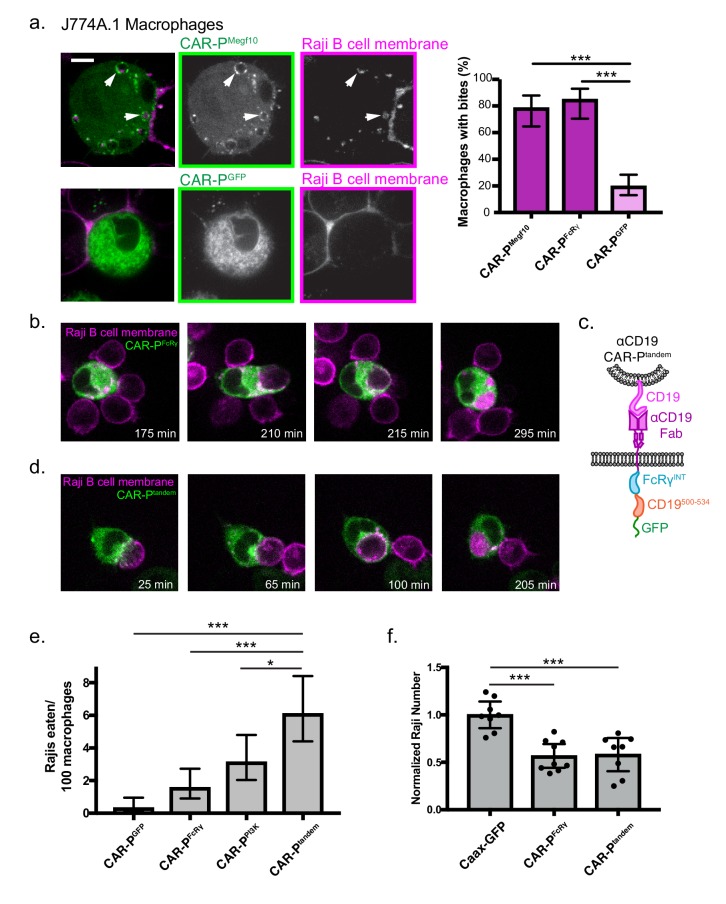
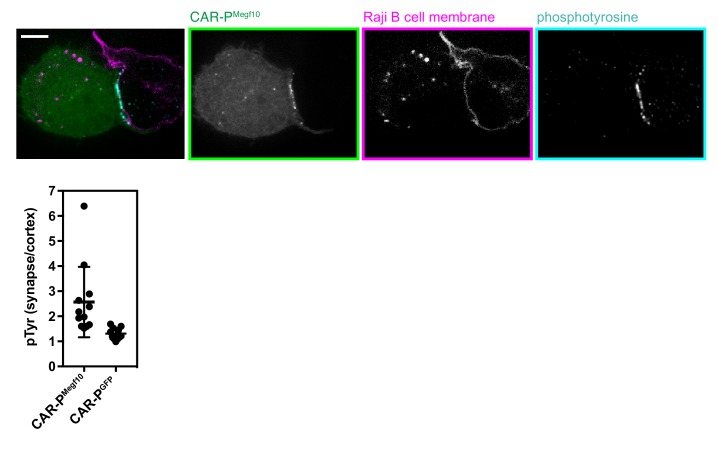
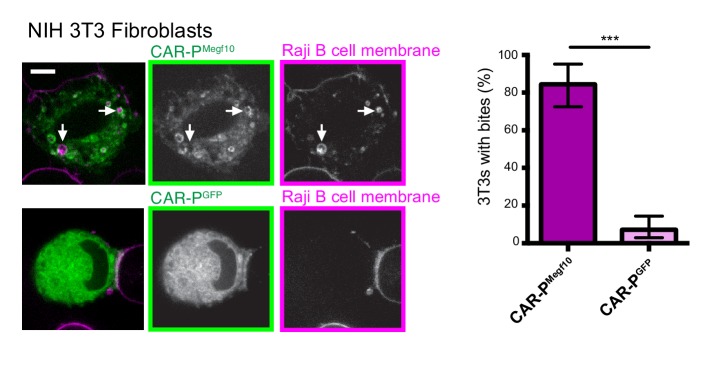
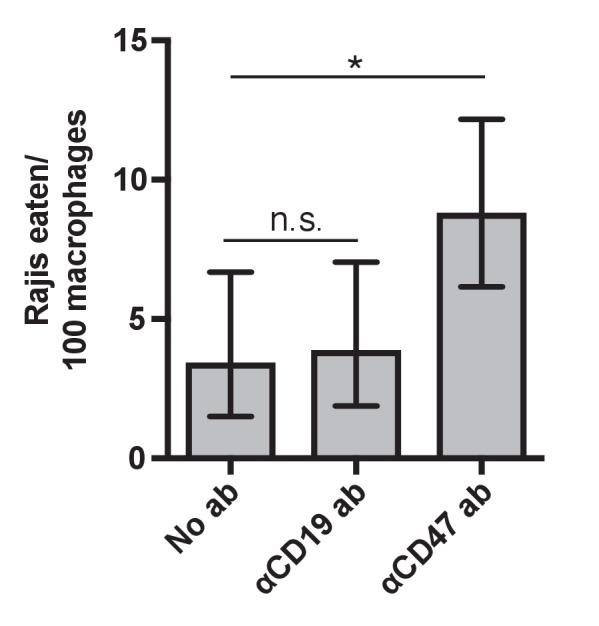
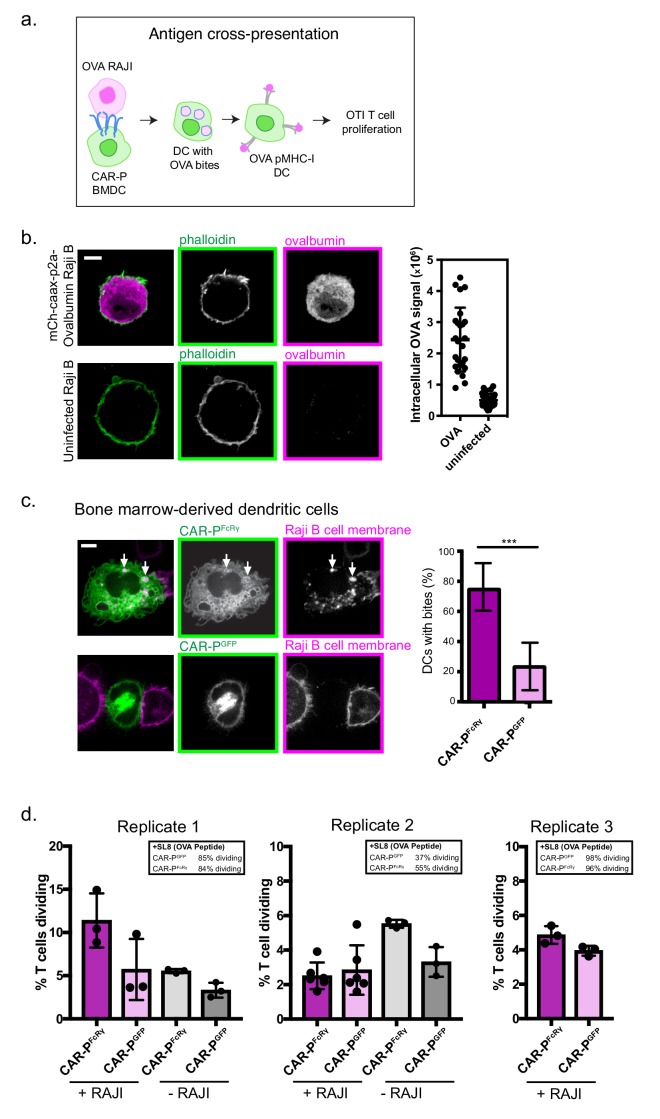
Chimeric antigen receptors (CARs) are synthetic receptors that reprogram T cells to kill cancer. The success of CAR-T cell therapies highlights the promise of programmed immunity and suggests that applying CAR strategies to other immune cell lineages may be beneficial. Here, we engineered a family of Chimeric Antigen Receptors for Phagocytosis (CAR-Ps) that direct macrophages to engulf specific targets, including cancer cells. CAR-Ps consist of an extracellular antibody fragment, which can be modified to direct CAR-P activity towards specific antigens. By screening a panel of engulfment receptor intracellular domains, we found that the cytosolic domains from Megf10 and FcRɣ robustly triggered engulfment independently of their native extracellular domain. We show that CAR-Ps drive specific engulfment of antigen-coated synthetic particles and whole human cancer cells. Addition of a tandem PI3K recruitment domain increased cancer cell engulfment. Finally, we show that CAR-P expressing murine macrophages reduce cancer cell number in co-culture by over 40%.

Keywords: Chimeric Antigen Receptor; Fc Receptor; cancer biology; cell biology; human; macrophages; mouse; phagocytosis; receptors; signal transduction.


Conflict of interest statement

MM, AW, AS, ER, NK, MH, RV No competing interests declared

Figures

Figure 1.
Figure 1.. Identification of intracellular signaling region for CAR-P.
(A) Schematics show the structure of CAR-P constructs. An ɑCD19 (purple) or ɑCD22 (blue, center) scFv directs CAR specificity. Intracellular signaling domains from Megf10 or the indicated engulfment receptor (green) activate engulfment. CAR-PGFP contains only GFP and no intracellular signaling domains (right). All constructs include a transmembrane domain from CD8 and a C-terminal GFP. (B) J774A.1 macrophages expressing ɑCD19 CAR-P with the indicated intracellular signaling domain (green) engulf 5 µm silica beads covered with a supported lipid bilayer containing His-tagged CD19 extracellular domain. The beads were visualized with atto390-labeled lipid incorporated into the supported lipid bilayer (magenta). Cells infected with the cell membrane marker, mCherry-CAAX, were used as a control (no CAR, top left). To the right of each image is a histogram depicting the frequency of cells engulfing the indicated number of beads. The average number of beads eaten per cell is quantified in (C). (D) Bone marrow derived macrophages were infected with CAR-PFcRɣ or GFP-CAAX (green, left and center top; grey, center bottom) and incubated with CD19 beads (magenta) for 45 min. Images show an x-y plane through the center of the engulfed beads (left), or a cross section (center) of the z plane indicated in the inset panel (white line). The histogram depicts the number of cells engulfing the indicated number of beads. The scale bar indicates 5 µm and n = 78–163 cells per condition, collected during three separate experiments. Error bars denote 95% confidence intervals and *** indicates p<0.0001 compared to mCherry-CAAX control by Kruskal-Wallis test with Dunn’s multiple comparison correction.
Figure 1—figure supplement 1.
Figure 1—figure supplement 1.. Expression level of CAR-P constructs in macrophages.
Images of macrophages infected with various ɑCD19 CAR-PGFP constructs were acquired with identical acquisition settings and scaling to depict differences in expression levels. Fluorescent intensity at the cell cortex of 20 representative ɑCD19 CAR-PGFP-infected macrophages was quantified using the mean intensity of a two pixel width linescan at the cell membrane, minus the mean intensity of a linescan immediately adjacent to the cell. The images are the same cells included in Figure 1B and fluorescent intensity was measured from the same macrophages assayed in Figure 1C. The dashed red line indicates the position of a bead in contact with the CAR-PGFP macrophage. The scale bar indicates 5 µm.
Figure 2.
Figure 2.. CAR-P expression drives specific engulfment of diverse beads.
(A) Macrophages infected with the ɑCD19 (purple) or ɑCD22 (blue) CAR-PMegf10 or mCherry-CAAX control were fed 5 µm beads ligated with either CD19 (left) or CD22 (right). Engulfment is quantified as the mean beads eaten per cell. The fraction of phagocytic cells is as follows: 31/144 GFP-CAAX cells engulfed CD19 beads, 87/149 ɑCD19 CAR-PMegf10 engulfed CD19 beads, 20/142 ɑCD22 CAR-PMegf10 engulfed CD19 beads, 28/140 GFP-CAAX cells engulfed CD22 beads, 18/151 ɑCD19 CAR-PMegf10 engulfed CD22 beads, 103/148 ɑCD22 CAR-PMegf10 engulfed CD22 beads (pooled data was collected during three separate experiments). Error bars denote 95% confidence intervals and *** indicates p<0.0001 compared to mCherry-CAAX control by Kruskal-Wallis test with Dunn’s multiple comparison correction. (B) J774A.1 macrophages expressing the ɑCD19 CAR-PMegf10 (green) were fed beads of various sizes (magenta, diameter of bead indicated below image). The beads were covered in a supported lipid bilayer ligated to His-tagged CD19 extracellular domain and the number of beads engulfed per cell is reported below each image (magenta bars indicate CAR-PMegf10 macrophages and pink bars indicate CAR-PGFP). The ɑCD19 CAR-PMegf10 macrophages were also incubated with 10 µm beads coated in phosphatidylserine (PS) and ICAM-1 (blue bar in graph, 51/390 cells engulfed a bead). The fraction of cells engulfing a CD19 bead is as follows: 135/169 CAR-PMegf10 and 134/187 CAR-PGFP cells engulfed 2.5 um bead, 126/395 CAR-PMegf10 and 112/499 CAR-PGFP cells engulfed a 5 um bead, 48/377 CAR-PMegf10 and 21/378 CAR-PGFP cells engulfed a 10 um bead, 120/706 CAR-PMegf10 and 45/675 CAR-PGFP cells engulfed a 15 um bead, 194/760 CAR-PMegf10 and 23/587 CAR-PGFP cells engulfed a 20 um bead (data is pooled from at least three separate experiments). Error bars denote 95% confidence intervals of the mean. *** indicates p<0.0001 respectively by Mann-Whitney test. All scale bars represent 5 µm.
Figure 3.
Figure 3.. A phosphorylated ITAM at the cell-target synapse drives engulfment.
(A) Macrophages expressing ɑCD19 CAR-PMegf10 (green, top) or ɑCD19 CAR-PGFP were incubated with CD19-ligated beads (position indicated with dotted line), fixed and stained for phosphotyrosine (magenta, top; greyscale, bottom). The fold enrichment of phosphotyrosine at the cell-bead synapse compared to the cell cortex is graphed on the right (n ≥ 11; each dot represents one cell-bead synapse; lines represent the mean ±one standard deviation). (B) Schematic shows the structure of CAR-P constructs in the plot at right. An αCD19 (purple) scFv directs CAR specificity. The intracellular signaling domains from CD3ζ activate engulfment. On the right is a histogram depicting the fraction of macrophages engulfing the indicated number of CD19-coated beads. (C) Comparison showing the average number of beads eaten per cell in J774A.1 macrophages expressing αCD19 CAR-Ps with the indicated intracellular signaling domain. 5 μm silica beads covered with a supported lipid bilayer containing His-tagged CD19 extracellular domain were used as an engulfment target (n = 156–167 cells per condition collected during three separate experiments). Error bars denote 95% confidence intervals and *** indicates p<0.0001 compared to CAR-PGFP control by Kruskal-Wallis test with Dunn’s multiple comparison in correction. (D) Model of the liposome-based fluorescence quenching assay used to determine affinity between the Syk tSH2 domains and the receptor tails of CD3ζ and FcRɣ, two intracellular signaling domains that promote engulfment. Binding between the Syk tSH2 reporter (Syk tSH2), green, and a receptor tail, purple, was detected by rhodamine quenching of BG505 dye on the reporter (see Materials and methods). Kd was determined by assessing mean fluorescence quenching for the last 20 timepoints collected ~45 min after ATP addition over a receptor titration from 0 to 500 nM. Each point represents the mean ± SD from three independent experiments. Kd ± SE was calculated by nonlinear fit assuming one site specific binding.
Figure 3—figure supplement 1.
Figure 3—figure supplement 1.. F-actin is enriched at the cell-target synapse.
Phalloidin staining (magenta overlayed with brightfield and DAPI, left; heatmap, right) of F-actin in a CAR-PFcRɣ expressing macrophage shows a 2.3 fold enrichment at the cell-bead synapse (standard deviation of 1.2). The graph depicts actin enrichment at 30 cell-bead synapses collected on three separate days. Each dot represents a cell-bead synapse. The box plot indicates the interquartile range. The cell is in contact with a second bead, but this site of contact has not initiated cup formation and no actin enrichment.
Figure 4.
Figure 4.. CAR-P promotes trogocytosis and whole cell eating.
(A) J774A.1 macrophages expressing the ɑCD19 CAR-PMegf10 (top panel, green in merge, left; greyscale, center) engulf pieces of CD19 +Raji B cells (labeled with mCherry-CAAX; magenta in merge, left; greyscale, right). The corresponding control ɑCD19 CAR-PGFP-infected cells are shown below. Arrows point to pieces of ingested Raji B cell. The proportion of CAR-P expressing macrophages internalizing one or more bite within 90 min is quantified on the right. Bites are defined as a fully internalized mCherry-positive vesicle >1 µm in diameter; n = 46 CAR-PMegf10 macrophages, n = 39 CAR-PFcRɣ macrophages and 102 CAR-PGFP macrophages acquired during three separate experiments. (B) Time course of a J774A.1 macrophage expressing CAR-PFcRɣ (green) internalizing a whole Raji B cell labeled with mCherry-CAAX (magenta). These images correspond to frames from Figure 4—video 2. (C) Schematic shows the structure of CAR-Ptandem construct, combining the intracellular signaling domain from FcRɣ and the p85 recruitment domain from CD19. (D) Time course of a J774A.1 macrophage expressing CAR-Ptandem (green) internalizing a whole Raji B cell labeled with mCherry-CAAX (magenta). These images correspond to frames from Figure 4—video 3. (E) Macrophages and Raji B cells were incubated together at a 1:2 macrophage:Raji ratio, and the number of whole Raji B cells eaten per 100 macrophages during 4–8 hr of imaging is graphed. Graph depicts pooled data from four independent experiments; n = 921 CAR-PGFP, n = 762 CAR-PFcRɣ, n = 638 CAR-PPI3K, n = 555 CAR-Ptandem cells. Sample sizes were selected for their ability to detect a 5% difference between samples with 95% confidence. (F) 10,000 macrophages and 20,000 Raji B cells were incubated together for 44 hr. The number of Rajis was then quantified by FACS. 2–3 technical replicates were acquired each day on three separate days. The number of Rajis in each replicate was normalized to the average number present in the GFP-CAAX macrophage wells on that day. * indicates p<0.01, *** indicates p<0.0001 by two-tailed Fisher Exact Test (a and e) or by Ordinary one way ANOVA with Dunnet’s correction for multiple comparisons (f); error bars denote 95% confidence intervals.
Figure 4—figure supplement 1.
Figure 4—figure supplement 1.. CAR-P localizes with pTyr at synapse with Raji B cell.
Phosphotyrosine staining (teal) of macrophages expressing CAR-PMegf10 (green) in contact with Raji B cells (cell membrane visualized with mCherry-CAAX, magenta). Below, the enrichment at the synapse is quantified as the mean intensity of a five pixel width linescan at the synapse divided by the mean intensity at the adjacent cell cortex for at least 11 sites of contact. Each dot represents one cell-cell synapse, lines represent the mean ±one standard deviation, and the graph is the pooled results o three biological replicates. The scale bar indicates 5 µm.
Figure 4—figure supplement 2.
Figure 4—figure supplement 2.. NIH 3T3 cells internalize Raji B cell bites.
NIH 3T3 cells expressing the ɑCD19 CAR-PMegf10 (green in merge, left; greyscale, center) engulf pieces of CD19 +Raji B cells (labeled with mCherry-CAAX; magenta in merge, left; greyscale, right). The control ɑCD19 CAR-PGFP-infected 3T3s are shown below. Arrows point to pieces of ingested Raji B cell. The proportion of cells taking at least one bite after 90 min co-incubation is graphed on the left (graphs show the pooled data of three separate experiments; n = 111 CAR-PMegf10 3T3 cells and 121 CAR-PGFP 3T3; *** indicates p<0.0001 by two-tailed Fisher Exact Test; error bars denote 95% confidence intervals). Bites are defined as a fully internalized piece of mCherry-labeled material >1 µm in diameter.
Figure 4—figure supplement 3.
Figure 4—figure supplement 3.. Opsonization by an anti-CD47 antibody enhances whole cell internalization through CAR-P Macrophages expressing CAR-PFcRɣ and Raji B cells were incubated together at a 1:2 macrophage:Raji ratio (20,000 macrophages and 40,000 Rajis) without antibody addition (No ab) or in the presence of anti-CD19 or anti-CD47 antibodies as indicated.
The number of whole Raji B cells eaten per 100 macrophages during 4–8 hr of imaging is graphed. Graph depicts pooled data from three independent experiments; n = 232 with no antibody, n = 257 with anti-CD19 antibody, n = 347 with anti-CD47 antibody; * indicates p<0.05 by two-tailed Fisher Exact test.
Figure 4—figure supplement 4.
Figure 4—figure supplement 4.. CAR-P promotes internalization of cancer antigen.
(A) Schematic of antigen internalization and cross-presentation assay. CAR-P expressing Bone Marrow Derived Dendritic Cells (BMDC) were differentiated using GM-CS. CAR-P BMDC were incubated with Raji B cells expressing soluble ovalbumin (OVA). DC with OVA bites (internalized antigen) were then incubated with OTI T cells (OVA specific CD8 +T cells) and OTI proliferation assessed as a measure of T cell stimulation. Results from each step of this assay are shown in sequence in (B), (C), and (D). (B) Ovalbumin staining (magenta) in Raji B cells infected with mCherry-CAAX-p2a-Ovalbumin lentivirus (OVA) and uninfected controls (uninfected) shows robust OVA expression in infected cells. At right the intracellular OVA signal is plotted as corrected total cell fluorescence (CTCF) for the ovalbumin channel. Each dot represents the CTCF of one cell; n = 26 cells OVA, n = 33 cells (uninfected); lines represent the mean ±one standard deviation, and the graph is the pooled results of three biological replicates. The scale bar indicates 5 µm. (C) Bone marrow-derived dendritic cells expressing the CAR-PFcRɣ (top panel, green in merge, left; greyscale, center) engulf pieces of CD19 +Raji B cells (labeled with mCherry-CAAX; magenta in merge, left; greyscale, right). The control ɑCD19 CAR-PGFP-infected dendritic cells are shown below. Arrows point to pieces of ingested Raji B cell. The proportion of cells taking at least one bite after 90 min co-incubation is graphed on the right of images. Graphs show the pooled data of two separate experiments; n = 28 CAR-PFcRɣ dendritic cells and n = 33 CAR-PGFP dendritic cells; *** indicates p<0.0001 by two-tailed Fisher Exact Test; error bars denote 95% confidence intervals. Bites are defined as a fully internalized piece of mCherry-labeled material >1 µm in diameter. (D) OTI T cell proliferation after 72 hr incubation with CAR-P transduced CD11c + dendritic cells.±RAJI below the x-axis indicates whether Raji-OVA B cells were added to CAR-P transduced dendritic cells prior to OTI addition. To measure proliferation, T cells were uniformly stained with eFluor670 dye on day 0, and proliferation was measured by dilution of the cell-bound dye. Graphs show the mean ±SD of three independent biological replicates. Data points are values for individual wells of differentiated CD11c + dendritic cells. Boxed data indicate the mean % T cells dividing when dendritic cells were pulsed with SL8 (OVA) peptide, which directly binds to MHC without undergoing cross presentation. If dendritic cell differentiation was successful, the pulsed dendritic cells should be capable of inducing robust OTI proliferation. Sample sizes were selected to match previous studies that were able to detect robust T cell stimulation (Roberts et al., 2016).

References

    1. Alvey C, Discher DE. Engineering macrophages to eat Cancer: from "marker of self" CD47 and phagocytosis to differentiation. Journal of Leukocyte Biology. 2017;102:31–40. doi: 10.1189/jlb.4RI1216-516R. - DOI - PMC - PubMed
    1. Alvey CM, Spinler KR, Irianto J, Pfeifer CR, Hayes B, Xia Y, Cho S, Dingal P, Hsu J, Smith L, Tewari M, Discher DE. SIRPA-Inhibited, Marrow-Derived macrophages engorge, accumulate, and differentiate in Antibody-Targeted regression of solid tumors. Current Biology. 2017;27:2065–2077. doi: 10.1016/j.cub.2017.06.005. - DOI - PMC - PubMed
    1. Andreesen R, Scheibenbogen C, Brugger W, Krause S, Meerpohl HG, Leser HG, Engler H, Löhr GW. Adoptive transfer of tumor cytotoxic macrophages generated in vitro from circulating blood monocytes: a new approach to Cancer immunotherapy. Cancer Research. 1990;50:7450–7456. - PubMed
    1. Andreu N, Phelan J, de Sessions PF, Cliff JM, Clark TG, Hibberd ML. Primary macrophages and J774 cells respond differently to infection with Mycobacterium tuberculosis. Scientific Reports. 2017;7:42225. doi: 10.1038/srep42225. - DOI - PMC - PubMed
    1. Batista FD, Iber D, Neuberger MS. B cells acquire antigen from target cells after synapse formation. Nature. 2001;411:489–494. doi: 10.1038/35078099. - DOI - PubMed

Publication types