. 2018 Jul 2;128(7):2877-2893.
doi: 10.1172/JCI98765. Epub 2018 Jun 4.

Destabilizing NEK2 overcomes resistance to proteasome inhibition in multiple myeloma

Affiliations

Destabilizing NEK2 overcomes resistance to proteasome inhibition in multiple myeloma

Reinaldo Franqui-Machin et al. J Clin Invest. .

Abstract

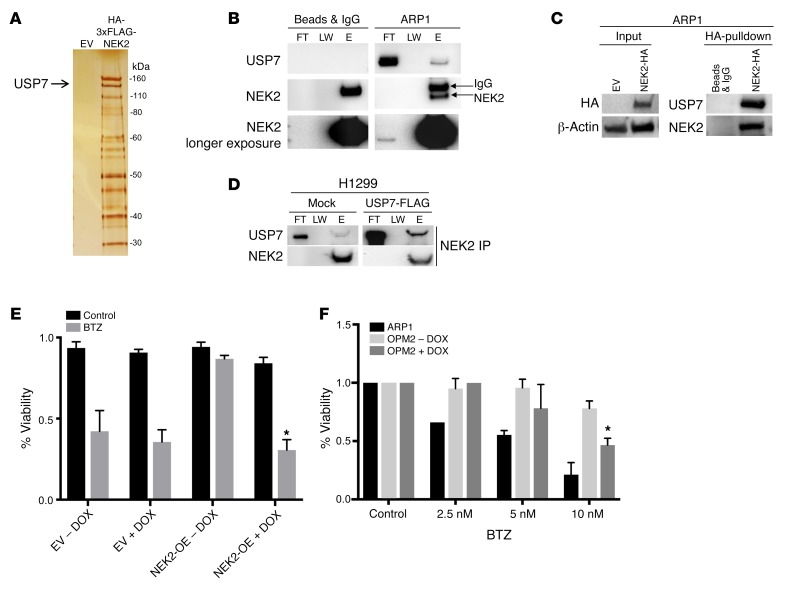
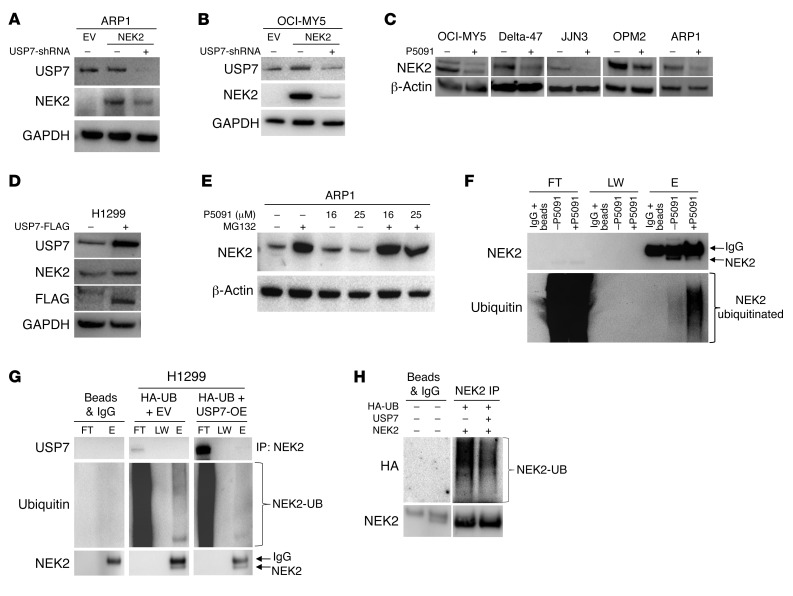
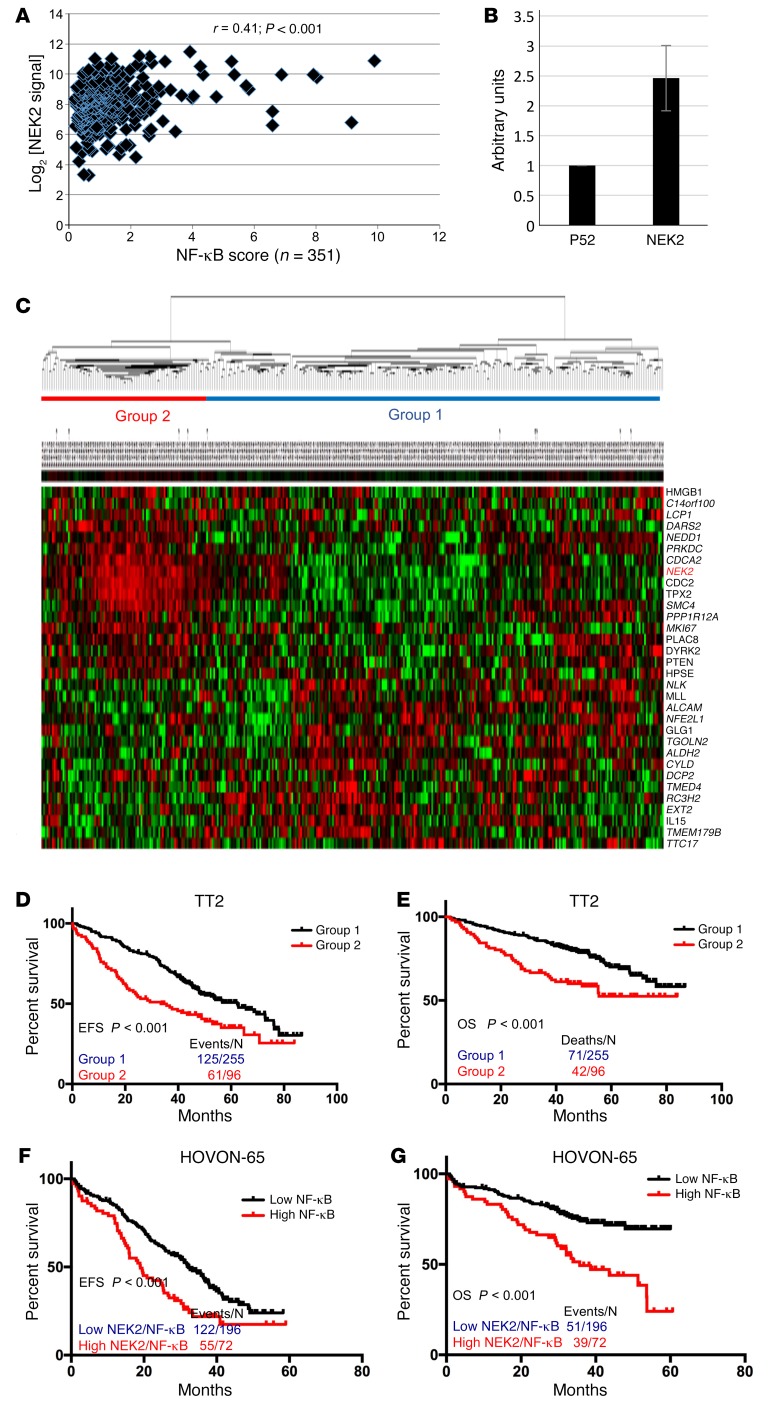
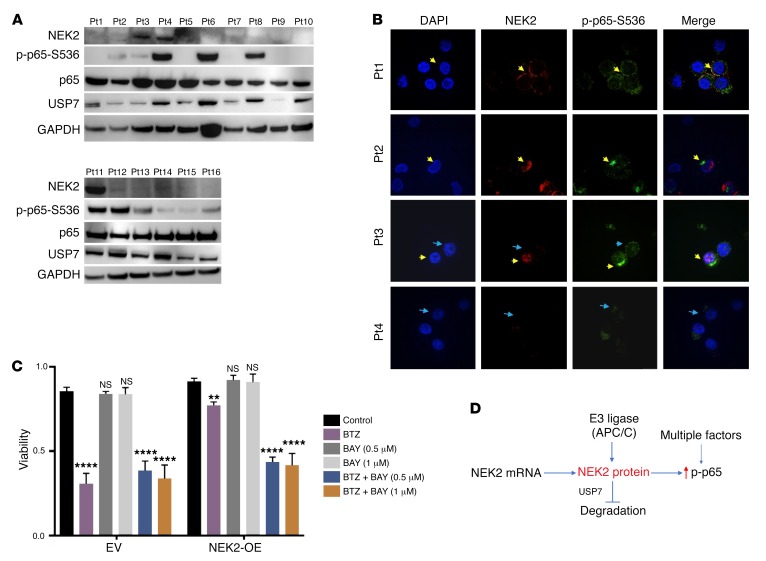
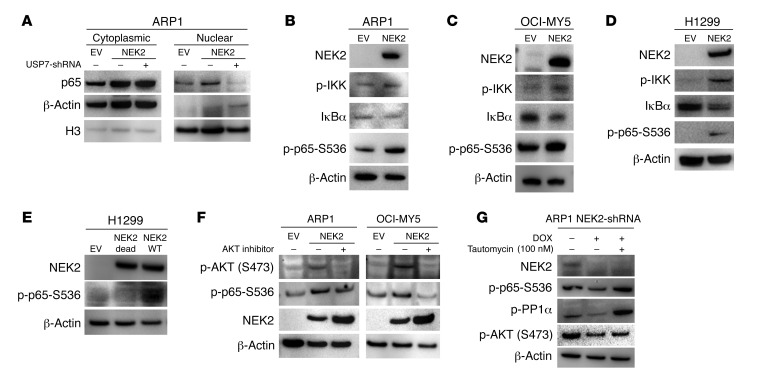
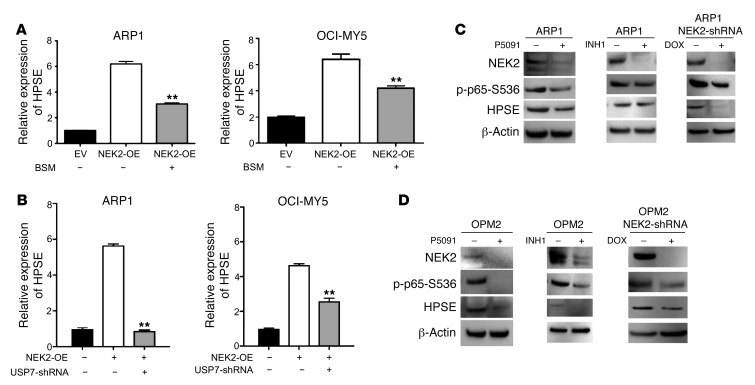
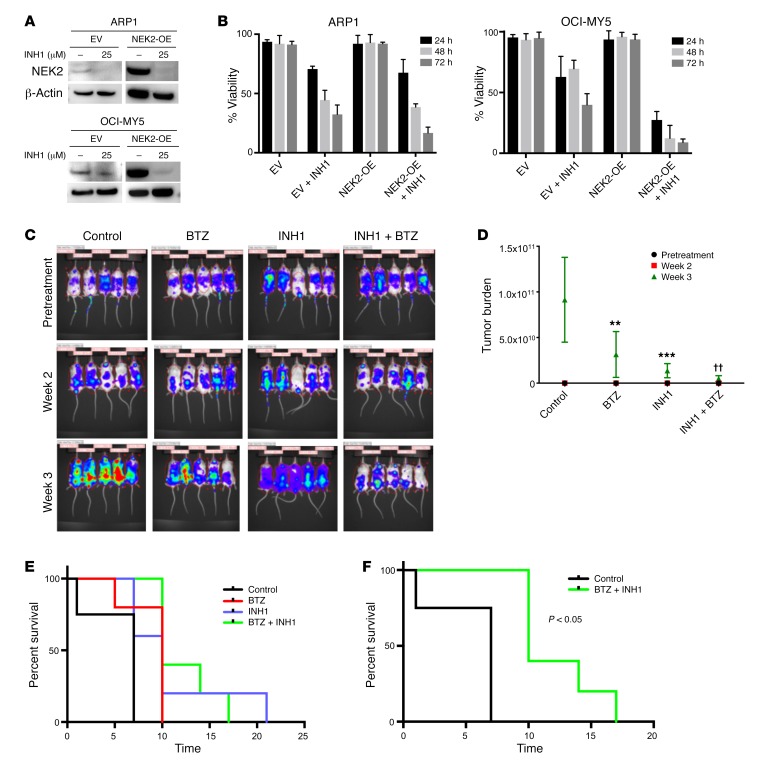
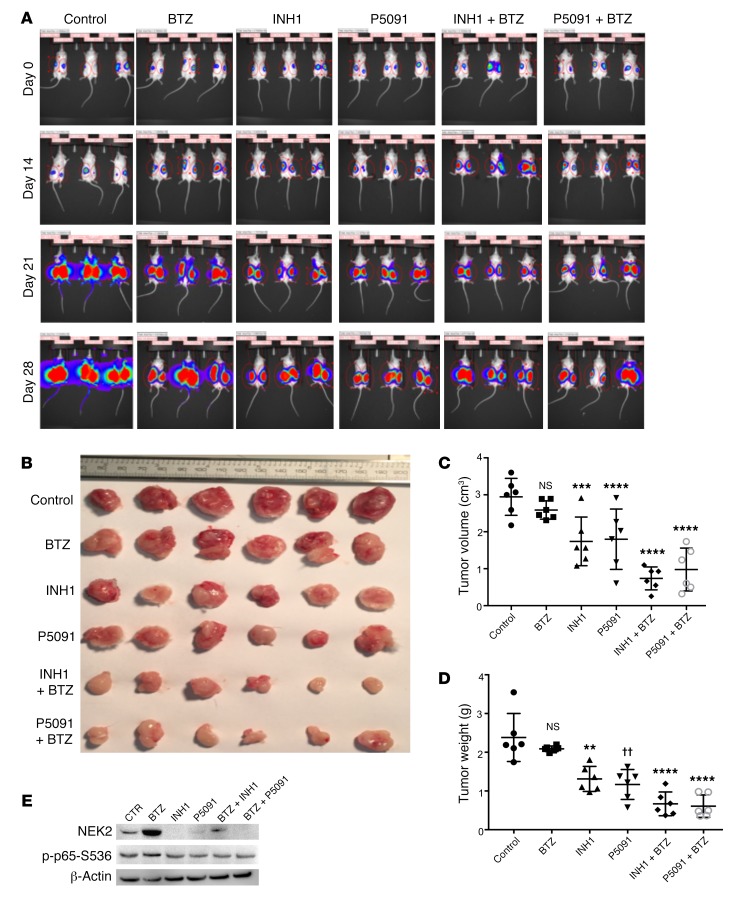
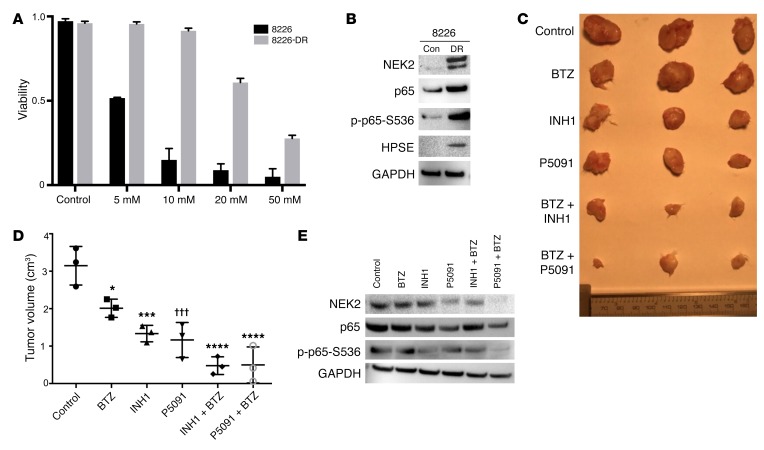
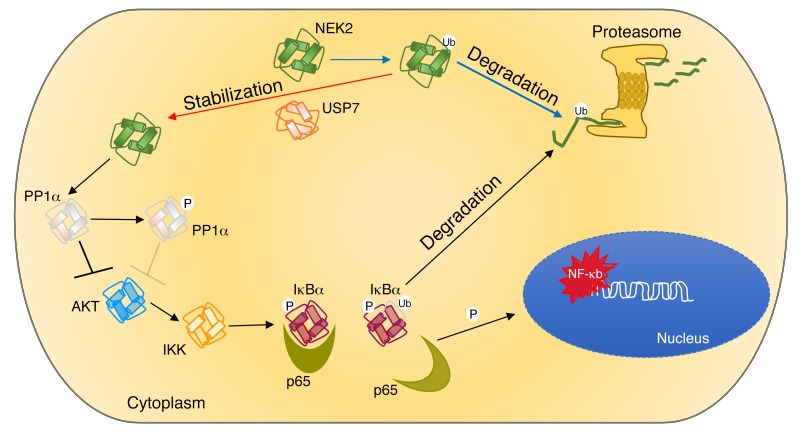
Drug resistance remains the key problem in cancer treatment. It is now accepted that each myeloma patient harbors multiple subclones and subclone dominance may change over time. The coexistence of multiple subclones with high or low chromosomal instability (CIN) signature causes heterogeneity and drug resistance with consequent disease relapse. In this study, using a tandem affinity purification-mass spectrometry (TAP-MS) technique, we found that NEK2, a CIN gene, was bound to the deubiquitinase USP7. Binding to USP7 prevented NEK2 ubiquitination resulting in NEK2 stabilization. Increased NEK2 kinase levels activated the canonical NF-κB signaling pathway through the PP1α/AKT axis. Newly diagnosed myeloma patients with activated NF-κB signaling through increased NEK2 activity had poorer event-free and overall survivals based on multiple independent clinical cohorts. We also found that NEK2 activated heparanase, a secreted enzyme, responsible for bone destruction in an NF-κB-dependent manner. Intriguingly, both NEK2 and USP7 inhibitors showed great efficacy in inhibiting myeloma cell growth and overcoming NEK2-induced and -acquired drug resistance in xenograft myeloma mouse models.

Keywords: B cells; Cancer; Oncology.


Conflict of interest statement

Conflict of interest: The authors have declared that no conflict of interest exists.

Figures

Figure 1
Figure 1. USP7 interacts with NEK2.
(A) HEK293T cells were transfected with either empty vector (EV) or HA-FLAG(3×)-NEK2. Proteins binding to NEK2 were pulled down by tandem HA and FLAG antibodies and stained with silver prior to mass spectrometry. (B) ARP1 myeloma cells were lysed and NEK2 was immunoprecipitated using NEK2 antibodies. Western blots were probed with NEK2 and USP7 antibodies. FT, LW, and E represent flow through, last wash, and elution of the immunoprecipitation, respectively. (C) ARP1 myeloma cells were transduced with NEK2-HA plasmids. Transduced cells were lysed and NEK2 was immunoprecipitated using HA antibodies. Western blots were probed using NEK2 and USP7 antibodies. (D) H1299 cells were transfected with mock or USP7-FLAG overexpression vector. Endogenous NEK2 was immunoprecipitated and Western blots were analyzed using NEK2 and USP7 antibodies. (E) ARP1 myeloma cells transduced with EV + USP7-shRNA or NEK2-OE + USP7-shRNA were treated with doxycycline (DOX) or vehicle to suppress USP7 expression. After 72 hours, cells were treated with bortezomib (BTZ; 5 nM) for a further 24 hours and cell viability was measured using trypan blue stain. (F) OPM2 cells transduced with NEK2-shRNA were treated with DOX or vehicle to suppress NEK2 expression. ARP1 cells or OPM2 cells with or without silencing of NEK2 were treated with BTZ (2.5, 5, and 10 nM) for a further 24 hours and cell viability was measured using trypan blue stain. Viability experiments were performed in triplicate and a Student’s t test was performed and showed the significance at 10 nM with or without silencing of NEK2. *P < 0.05.
Figure 2
Figure 2. USP7 prevents ubiquitination of NEK2 protein.
(A and B) Knockdown of USP7 decreases NEK2 protein. ARP1 (A) and OCI-MY5 (B) myeloma cells were transfected with EV, NEK2, or NEK2 + USP7-shRNA. After 72-hour induction with doxycycline, cells were lysed. NEK2 and USP7 protein levels were analyzed by Western blot. (C) OCI-MY5, Delta-47, JJN3, OPM2, and ARP1 myeloma cell lines were treated with 16 μM P5091 for 24 hours. Cells were lysed and NEK2 levels analyzed by Western blot. (D) H1299 cells were transfected with mock or USP7-FLAG–overexpressing vectors, lysed, and NEK2 and USP7 levels were determined by Western blot. (E) ARP1 myeloma cells were treated with the proteasome inhibitor MG132 (10 μM) alone for 30 minutes or in combination with P5091 (16 and 25 μM) for an additional 5 hours. Cells were lysed and NEK2 levels were analyzed by Western blot. (F) OPM2 cells were treated with or without P5091 (25 μM for 2 hours) and protein was extracted with lysis buffer supplemented with NEM. Endogenous NEK2 was immunoprecipitated and analyzed by Western blot using NEK2 and ubiquitin antibodies. FT, LW, and E represent flow through, last wash, and elution of the immunoprecipitation, respectively. (G) H1299 cells were transfected with EV and HA-ubiquitin (HA-UB) or FLAG-USP7 and HA-UB. Cells were lysed and endogenous NEK2 was immunoprecipitated (IP) by NEK2 antibodies and ubiquitination levels were analyzed by Western blot. The higher-molecular-weight band is nonspecific IgG. (H) H1299 cells were transfected with NEK2-OE, HA-UB, and FLAG-USP7 or NEK2-OE and HA-UB. Cells were lysed and total NEK2 protein, including both endogenous and exogenous, was immunoprecipitated (IP) by anti-NEK2 antibodies and ubiquitination levels were analyzed using HA antibodies by Western blot.
Figure 3
Figure 3. NEK2 activates the canonical NF-κB signaling pathway.
(A) Affymetrix gene expression profiling data from 351 purified bone marrow plasma cell populations in the Total Therapy 2 (TT2) cohort was used to correlate the expression of NEK2 with the NF-κB signaling score. Pearson’s correlation was performed between log2 [NEK2 signal] and the NF-κB signaling score. (B) H1299 cells were transfected with luciferase vector under a p65-dependent promoter, an internal Renilla control vector, p52 as a negative control, or a NEK2-OE vector. Results show that NEK2 overexpression increased the luciferase signal 2.5-fold compared with p52. (C) An unsupervised hierarchical cluster analysis was used to classify 351 multiple myeloma samples using NEK2 and 31 NF-κB genes regulated by NEK2. (DG) Kaplan-Meier analyses show event-free survival (EFS) and overall survival (OS) of multiple myeloma patients enrolled in TT2 (D and E) and HOVON-65 (F and G) cohorts. Each line represents different subgroups identified in C and is described in the figure and color coded.
Figure 4
Figure 4. NEK2 activates the canonical NF-κB signaling pathway in primary multiple myeloma samples.
(A) Primary myeloma samples from 16 patients (Pts) were lysed and analyzed by Western blot using NEK2, p-p65-S536, total p65 (p65), USP7, and GAPDH antibodies. (B) CD138-positive myeloma cells isolated from 4 primary myeloma patients were mounted on cytospin slides and analyzed by immunofluorescence using NEK2 and p-p65-S536 antibodies. DAPI staining was used to visualize nuclei. Yellow arrowheads indicate myeloma cells coexpressing NEK2 and p-p65-S536. Blue arrowheads show myeloma cells expressing p-p65-S536 with undetectable NEK2 levels. (C) EV and NEK2-OE ARP1 cells were treated with vehicle, BAY11-7082 (0.5 or 1.0 μM), and bortezomib (5 nM) alone or in combination. After 48 hours, cell viability was assessed by trypan blue staining and Dunnett’s method was used to calculate the multiplicity-adjusted P values for each treatment and control group pair. **P = 0.0023; ****P = 0.0001. NS, no significance. Experiment was performed in triplicate. (D) A model for NEK2 deubiquitination and stabilization by interacting with USP7. USP7 prevents E3 ligase APC/C (30) to ubiquitinate NEK2 resulting in its stabilization.
Figure 5
Figure 5. NEK2 activates NF-κB signaling via PP1α/AKT.
(A) USP7 was knocked down in ARP1 cells transduced with NEK2-OE after 72 hours induction with doxycycline (DOX). Nuclear and cytosolic fractionations were carried out. p65 levels were analyzed between EV and NEK2-OE with or without USP7 shRNA by Western blot. β-Actin and histone H3 (H3) were used as cytosolic and nuclear markers, respectively. (BD) EV and NEK2-OE ARP1, OCI-MY5, and H1299 cells were lysed. NEK2, p65-S536 phosphorylation, IKK phosphorylation, and IκBα were analyzed by Western blot. (E) H1299 cells transiently transfected with EV or NEK2-OE (WT) or NEK2-K37R mutant (NEK2-Dead) were lysed, and NEK2 and p65-S536 phosphorylation was analyzed by Western blot. (F) ARP1 and OCI-MY5 cells transfected with EV or NEK2-OE were treated with vehicle or MK-2206 2HCl, an AKT inhibitor, for 30 minutes and then cells were lysed. p65-S536 phosphorylation was analyzed by Western blot. (G) NEK2-shRNA ARP1 cells were induced with DOX for 48 hours and then treated with tautomycin, a PP1α inhibitor, for another 24 hours. NEK2, p-p65-S536, p-PP1α, and p-AKT were analyzed by Western blot.
Figure 6
Figure 6. NEK2 regulates heparanase expression via NF-κB.
(A) Total RNA from EV or NEK2-OE or NEK2-shRNA ARP1 cells were harvested for gene expression profiling; NEK2 and HPSE mRNA levels are presented as bar graphs of duplicate samples. (B) The map of p65 binding to the HPSE promoter was obtained from the UCSC genome browser ChIP-seq data (track name: GM12878+TNFa RELA). HSPE contains 2 RELA (p65) binding sites across its sequence. H3K4me3 and H3K27Ac, typical for promoter and activator binding elements, respectively, show strong peaks at the p65 binding site of the HPSE sequence (red box). (C) ChIP-qPCR was performed in control cell (EV) and NEK2-OE ARP1 myeloma cells using p65 antibodies. The DNA occupancy of the HPSE promoter was analyzed by qPCR and a Student’s t test was performed to assess the significance. *P < 0.05. (D) NEK2-OE ARP1 myeloma cells were treated with vehicle or the NF-κB inhibitor BAY11-7082 (BAY). Cell lysates from NEK2-OE ARP1 cells and the control EV ARP1 cells were probed with antibodies against NEK2, p-p65-S536, and HPSE by Western blot.
Figure 7
Figure 7. NEK2 regulates heparanase expression.
(A) EV and NEK2-OE ARP1 and OCI-MY5 cells were treated with vehicle or BSM-345541, and HSPE mRNA levels were analyzed by qRT-PCR. (B) HPSE mRNA levels were analyzed by qRT-PCR in EV, NEK2-OE, or NEK2-OE + USP7-shRNA ARP1 and OCI-MY5 myeloma cells. **P < 0.01 by Student’s t test. (C) ARP1 and (D) OPM2 cells were treated with P5091 (16 μM overnight), INH1 (25 μM for 24 hours), or NEK2-shRNA DOX (48 hours). Cells were lysed and proteins were analyzed by Western blot with NEK2, p-p65-S536, HPSE, and GAPDH antibodies.
Figure 8
Figure 8. INH1 inhibits myeloma growth in xenograft mice.
(A) EV or NEK2-OE ARP1 and OCI-MY5 myeloma cells were treated with 25 μM INH1 for 24 hours, lysed, and NEK2 levels were analyzed by Western blot. (B) EV or NEK2-OE ARP1 and OCI-MY5 myeloma cells were treated with 25 μM INH1 for 3 days. Cell viability was calculated every 24 hours using trypan blue staining. Viability experiments were performed in triplicate. (C) Approximately 0.5 × 10⁶ ARP myeloma cells expressing luciferase were injected into NOD-Rag1null mice via the tail vein. One week after injection of ARP1 cells, mice were treated with (i) vehicle, (ii) bortezomib (BTZ; 3 mg/kg, i.p., 2 times/week), (iii) INH1 (100 mg/kg, i.p., 3 times/week), or (iv) BTZ + INH1. The tumor growth in the 4 groups of mice was evaluated using an in vivo imaging system. (D) Quantification of tumor burden was determined from C and Dunnett’s method was used to calculate the multiplicity-adjusted P values for each treatment and control group pair after 3 weeks of treatment. **P = 0.0096; ***P = 0.0008; ††P = 0.0015. (E) Kaplan-Meier curves showing survival of mice treated with BTZ, INH1, BTZ + INH1, or the control. (F) Kaplan-Meier curves showing that the combination of BTZ + INH1 significantly extended myeloma mouse survival compared with the control (P < 0.05).
Figure 9
Figure 9. INH1 and P5091 overcomes NEK2-induced bortezomib resistance.
(A) Approximately 0.5 × 10⁶ NEK2-OE ARP1 cells expressing luciferase were injected subcutaneously in both left and right flanks of NOD-Rag1null mice. One week after injection of NEK2-OE cells, mice were treated with (i) vehicle, (ii) bortezomib (BTZ; 3 mg/kg, i.p., 2 times/week), (iii) INH1 (100 mg/kg, i.p., 3 times/week), (iv) P5091 (10 mg/kg, i.v., 2 times/week), (v) INH1 + BTZ, or (vii) P5091 + BTZ for 28 days. In vivo imaging showing the tumor growth in the different groups of mice before and after treatments at different time points. (B) Tumors from A were harvested and photographed. (C) Quantification of tumor volume from dissected tumors in B and Dunnett’s method was used to calculate the multiplicity-adjusted P values for each treatment and control group pair. ***P = 0.005; ****P = 0.0001. NS, no significance. (D) Quantification of tumor weight from dissected tumors in B and Dunnett’s method was used to calculate the multiplicity-adjusted P values for each treatment and control group pair. **P = 0.0032; ††P = 0.0052; ****P = 0.0001. NS, no significance. (E) Tumors from B were lysed and analyzed by Western blot using NEK2, p-p65-S536, and GAPDH antibodies.
Figure 10
Figure 10. Targeting NEK2 overcomes acquired drug resistance in vivo.
(A) The parental RPMI-8226 (8226) and drug-resistant RPMI-8226 (8226-DR) myeloma cells were treated with different bortezomib (BTZ) concentrations. Cell viability was analyzed by trypan blue staining after 48 hours. Viability experiments were performed in triplicate. (B) Western blots showing the expression of NEK2, p65, p-p65-S536, HPSE, and GAPDH in 8226 and 8226-DR myeloma cells. (C) Images of representative dissected tumors from mice treated with (i) vehicle, (ii) BTZ, (iii) INH1, (iv) P5091, (v) INH1 + BTZ, or (vi) P5091 + BTZ for 28 days. (D) Tumor volume was quantified from dissected tumors in C and Sidak’s method was used to calculate the multiplicity-adjusted P values for active treatment groups versus control. *P = 0.0172; ***P = 0.0004; †††P = 0.0002; ****P < 0.0001. (E) Western blots showing the expression of NEK2, p65, p-p65-S536, and GAPDH from dissected tumors in C.
Figure 11
Figure 11. Working model of the interaction between NEK2 and USP7.
USP7 binds to and stabilizes NEK2 by deubiquitination, allowing it to accumulate in myeloma cells. Accumulated NEK2 binds to and phosphorylates PP1α, resulting in loss its AKT-suppressing activity. Active AKT triggers the canonical NF-κB pathway by phosphorylating IKK, with subsequent phosphorylation and degradation of IκBα. p65 released from the complex with IκBα translocates into the nucleus, where it activates its target genes leading to drug resistance in myeloma. Ub, ubiquitin.

Similar articles

Cited by

References

    1. Kumar SK, et al. Multiple myeloma. Nat Rev Dis Primers. 2017;3:17046. - PubMed
    1. McCarthy PL, et al. Lenalidomide maintenance after autologous stem-cell transplantation in newly diagnosed multiple myeloma: a meta-analysis. J Clin Oncol. 2017;35(29):3279–3289. doi: 10.1200/JCO.2017.72.6679. - DOI - PMC - PubMed
    1. Moreau P, Attal M, Facon T. Frontline therapy of multiple myeloma. Blood. 2015;125(20):3076–3084. doi: 10.1182/blood-2014-09-568915. - DOI - PubMed
    1. Zhan F, et al. The molecular classification of multiple myeloma. Blood. 2006;108(6):2020–2028. doi: 10.1182/blood-2005-11-013458. - DOI - PMC - PubMed
    1. [No authors listed] Erratum for the report: “Molecular remission of infant B-ALL after infusion of universal TALEN gene-edited CAR T cells” by W. Qasim, et al. Sci Transl Med. 2017;9(377):aam9292. - PubMed

Publication types

MeSH terms