. 2018 Jun 4;32(11):fj201800139R.
doi: 10.1096/fj.201800139R. Online ahead of print.

Cardiac metabolic effects of KNa1.2 channel deletion and evidence for its mitochondrial localization

Affiliations

Cardiac metabolic effects of KNa1.2 channel deletion and evidence for its mitochondrial localization

Charles O Smith et al. FASEB J. .

Abstract

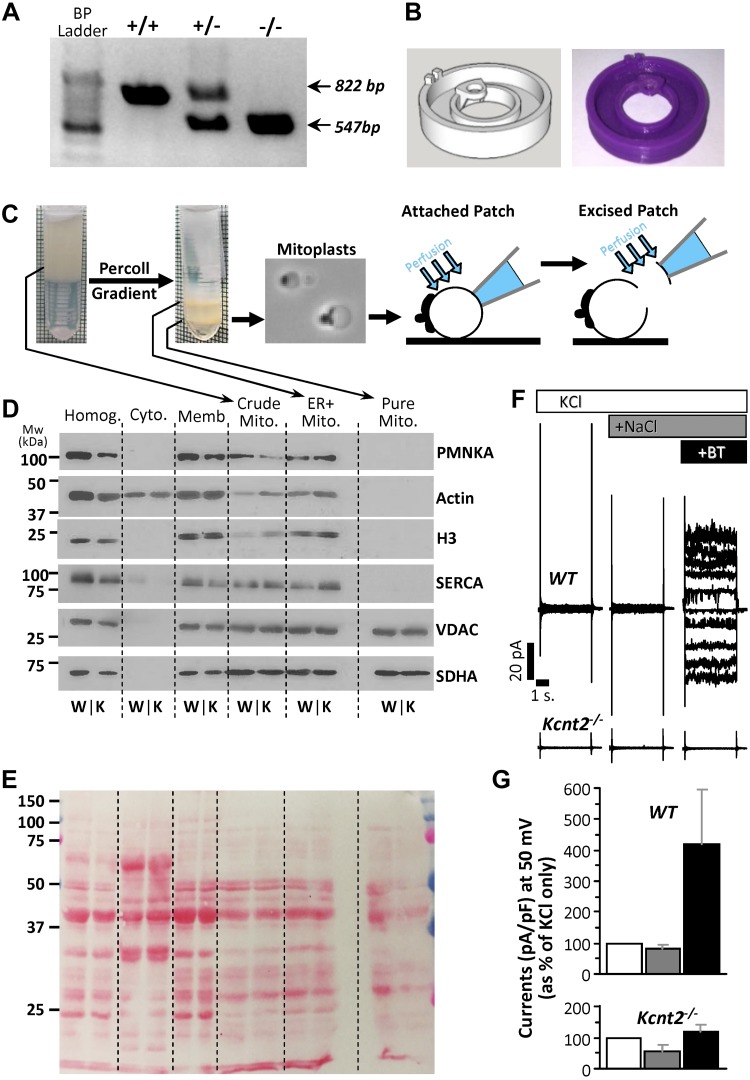
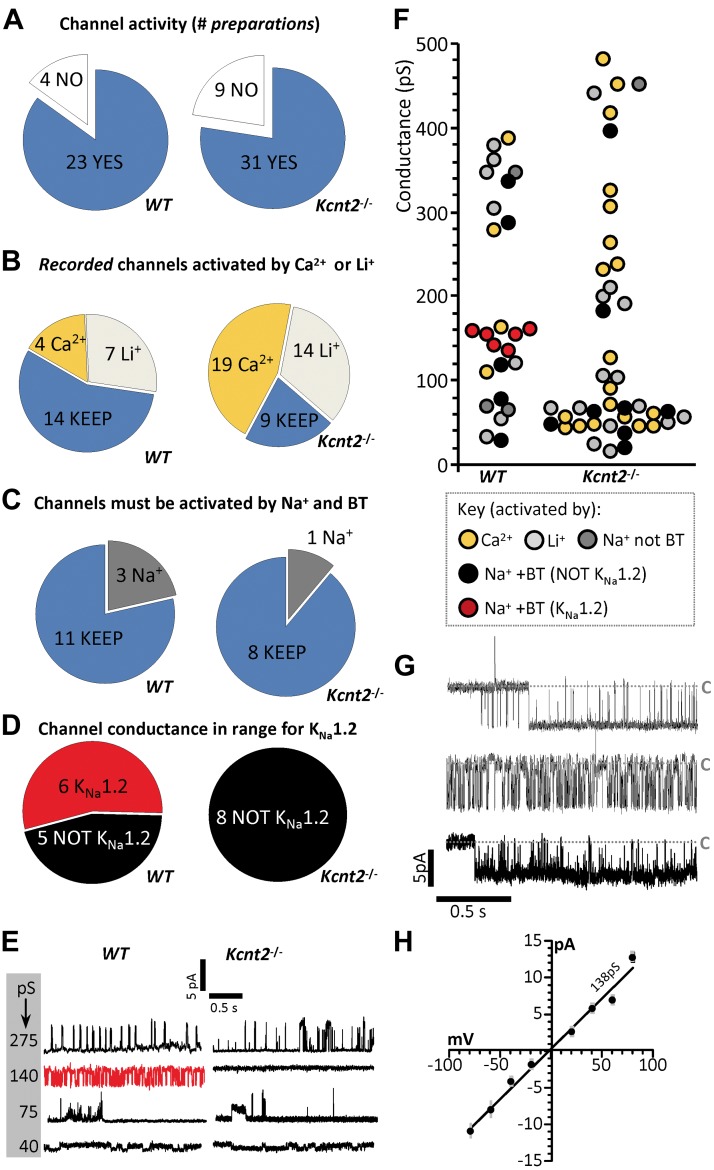
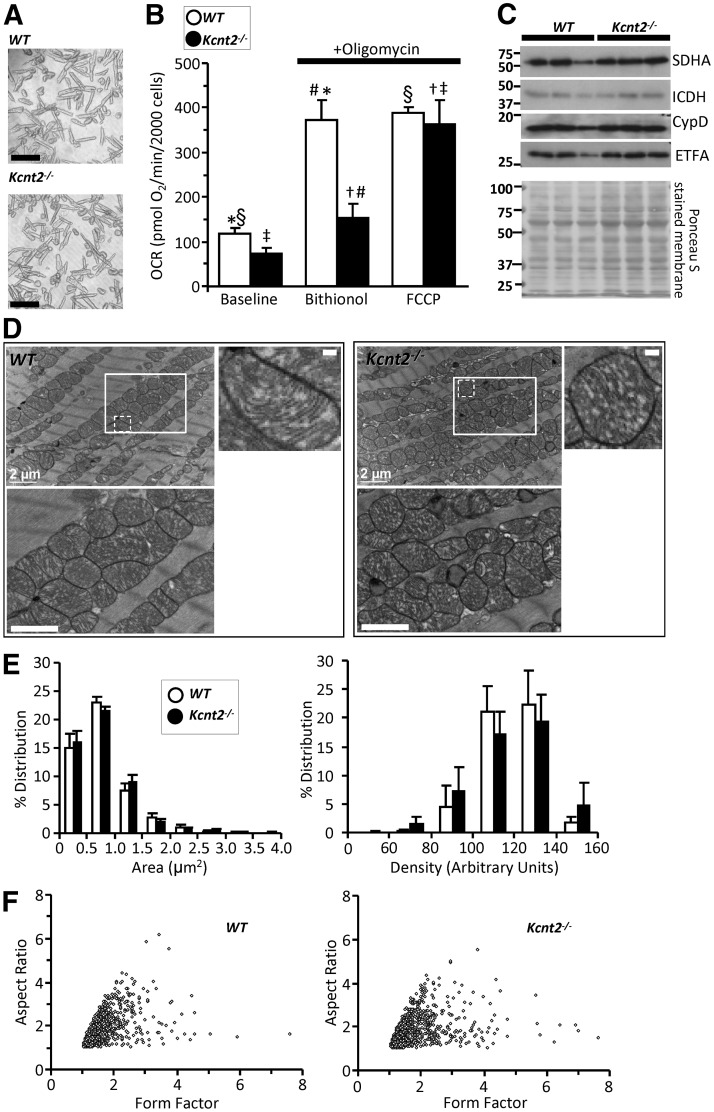
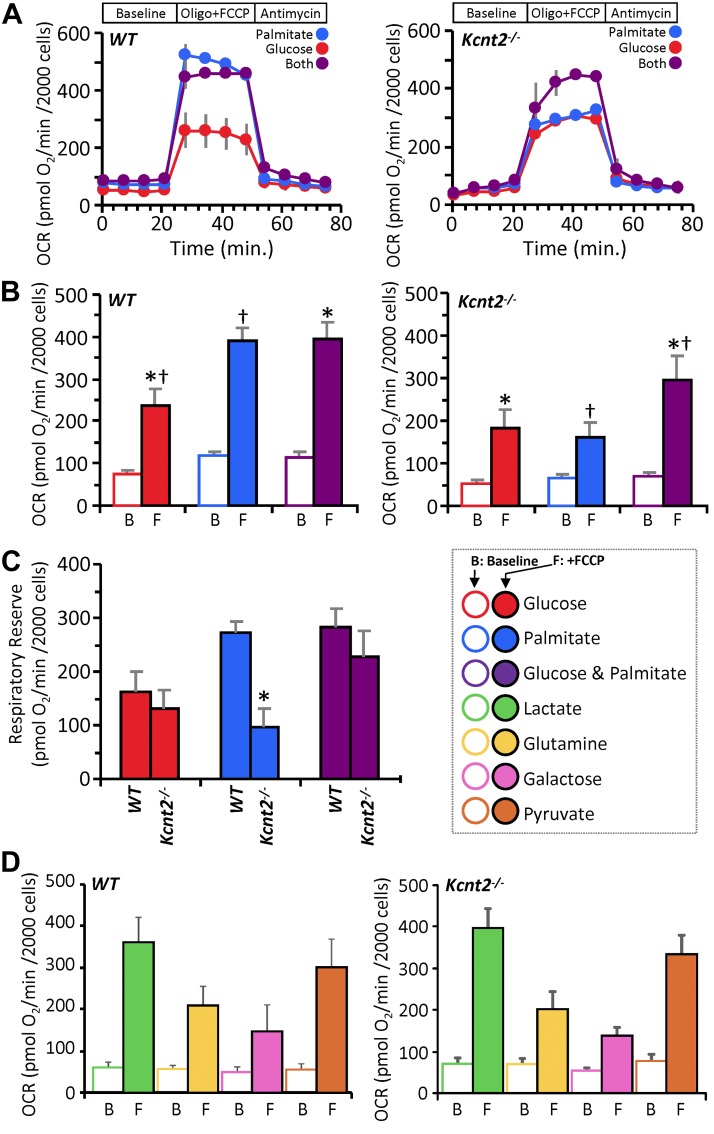
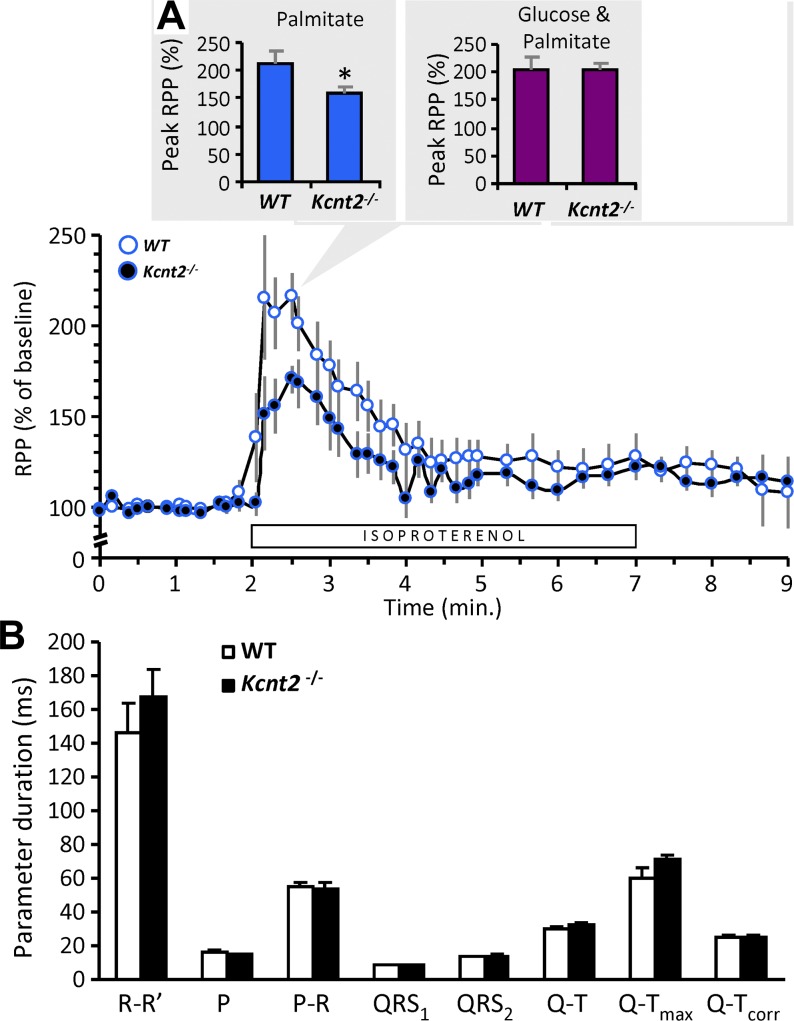
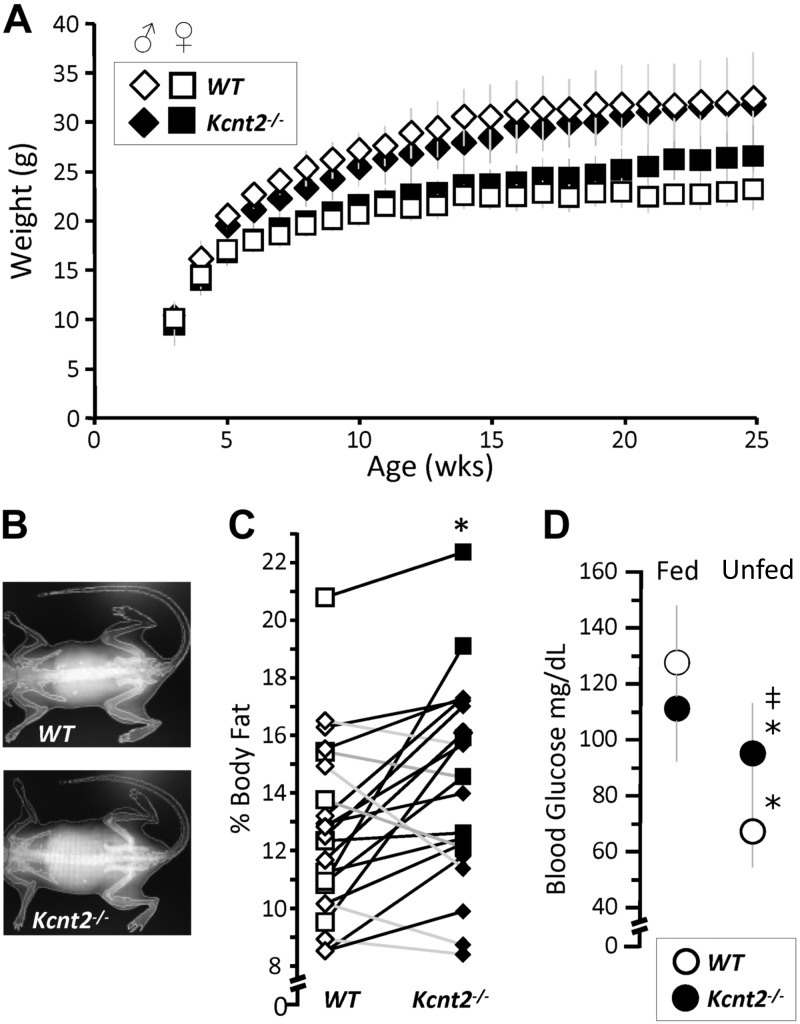
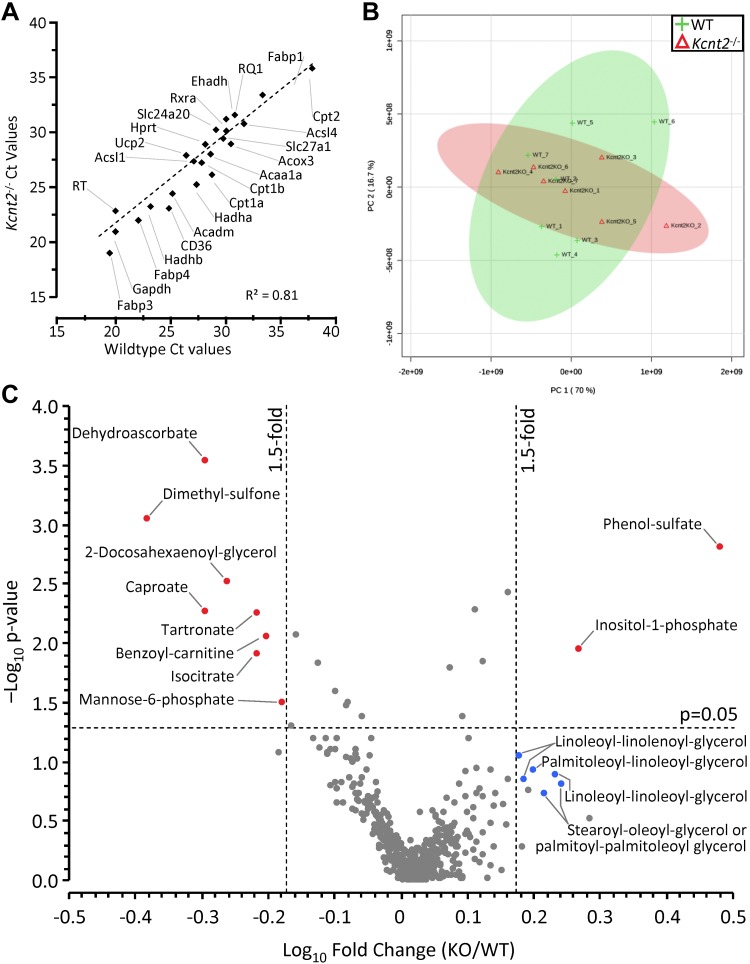
Controversy surrounds the molecular identity of mitochondrial K+ channels that are important for protection against cardiac ischemia-reperfusion injury. Although KNa1.2 (sodium-activated potassium channel encoded by Kcn2) is necessary for cardioprotection by volatile anesthetics, electrophysiological evidence for a channel of this type in mitochondria is lacking. The endogenous physiological role of a potential mito-KNa1.2 channel is also unclear. In this study, single channel patch-clamp of 27 independent cardiac mitochondrial inner membrane (mitoplast) preparations from wild-type (WT) mice yielded 6 channels matching the known ion sensitivity, ion selectivity, pharmacology, and conductance properties of KNa1.2 (slope conductance, 138 ± 1 pS). However, similar experiments on 40 preparations from Kcnt2-/- mice yielded no such channels. The KNa opener bithionol uncoupled respiration in WT but not Kcnt2-/- cardiomyocytes. Furthermore, when oxidizing only fat as substrate, Kcnt2-/- cardiomyocytes and hearts were less responsive to increases in energetic demand. Kcnt2-/- mice also had elevated body fat, but no baseline differences in the cardiac metabolome. These data support the existence of a cardiac mitochondrial KNa1.2 channel, and a role for cardiac KNa1.2 in regulating metabolism under conditions of high energetic demand.-Smith, C. O., Wang, Y. T., Nadtochiy, S. M., Miller, J. H., Jonas, E. A., Dirksen, R. T., Nehrke, K., Brookes, P. S. Cardiac metabolic effects of KNa1.2 channel deletion and evidence for its mitochondrial localization.

Keywords: Slick; Slo2.1; bithionol; patch clamp.


Conflict of interest statement

The authors thank Christopher Lingle (Washington University, St. Louis, MO, USA) for providing founders for the Kcnt2−/− mice; Kathleen Kinally (Emeritus, New York University, New York, NY, USA) for technical support in performing mitochondrial patch-clamp experiments; Dana Godfrey [University of Rochester Medical Center (URMC) Musculoskeletal Center] for support with the DEXA analyses; and Karen Bentley (URMC electron microscopy core) for support obtaining electron microscopic images. This work was funded by U.S. National Institutes of Health General Medical Research Grant R01-GM087483 (to P.S.B. and K.N.), National Heart, Lung and Blood Institute Grant R01-HL071158 (to P.S.B.), and National Institute of Arthritis and Musculoskeletal and Skin Diseases Grant R01-AR-059646 (to R.T.D.). The authors declare no conflicts of interest.

Figures

Figure 1
Figure 1
Kcnt2−/− mice, mitoplast purification and attached patch clamp. A) Example PCR analysis of tail clip genotyping of WT, heterozygous, and Kcnt2−/− mice. Amplicon expected for the WT (822 bp) and the knockout (547 bp) alleles. B) Custom 3-D–printed micro chamber for patch-clamp analysis of mitoplasts with computer model (left) and final product (right). C) Schematic depicting mitochondrial purification, mitoplast preparation, and attached patch and excised patch configuration. D) Western blot analysis of proteins from different cellular fractions during mitochondrial purification. Crude Mito, mitochondria-enriched fraction; Cyto, cytosol; ER+Mito, upper band following Percoll; [H3], Histone; Homog, homogenate; Memb, crude membrane; Pure Mito, lower band following Percoll. PMNKA, plasma membrane Na+/K+-ATPase; SERCA, sarcoendoplasmic reticulum Ca2+-ATPase; VDAC, voltage-dependent anion channel. E) Ponceau Red–stained membrane from blot in D for the loading control. (An empty lane was inserted between the ER+mit and Pure Mito samples.) F) Representative recordings from attached patch clamp of WT and Kcnt2−/− mitoplasts, with perfusion of 150 mM KCl (white), after addition of 40 mM NaCl (dark gray), and after addition of 10 µM BT (black). G) Quantitation of traces normalized to pA/pF and shown as percentage increase in current at a holding potential of 50 mV (same color scheme as F). Data are means ± sd (n = 4–10 independent mitoplast preparations).
Figure 2
Figure 2
Mitochondria contain a KNa1.2 channel. A) Preparations from WT (left) and Kcnt2−/− (right) mitoplasts, sorted by channels observed (blue) or no channels observed (white). B) Exclusion of Ca2+-activated (gold) or Li+-activated (light gray) channels. In some preparations, more than 1 channel was observed. C) Selection of channels activated by Na+ and BT, with exclusion of channels activated by Na+ alone and subsequently blocked by BT (dark gray). B, C) Channels carried over to the subsequent screening step are shown in blue. D) Selection of channels with peak conductance matching that reported for KNa1.2 (red). E) Example traces of channels observed in WT and Kcnt2−/− preparations with a variety of peak conductances. Red trace indicates a channel assigned as KNa1.2. F) Peak conductance of channels observed from all traces. BF) Color key shown at base of F. Channels with conductance >500 pS are omitted for clarity. G) Example of 2 s recordings from 3 KNa1.2 channels observed in WT mitoplasts (i.e., red points in Fig. 1F) at −40 mV holding potential. Gray dashed line labeled C: closed states. H) Channel current vs. voltage plot of peak unitary conductances of all KNa1.2 channels from WT mitoplast recordings. Average slope conductance was 138 ± 1 pS.
Figure 3
Figure 3
Single-channel characteristics of mitochondrial KNa1.2. A) Compressed traces from the recording of a patch containing 5 mitochondrial KNa1.2 channels (holding potential, −20 mV), and a time-expanded trace for the region highlighted by the gray bar in the trace above. Gray dashed lines: closed (C) and multiple open (O) states. B) Traces from a single KNa1.2 channel at holding potentials of 40 to −80 mV. C) Channel open probability plot from the channel shown in B. D) Representative trace of a recording with 2 channels on a compressed time scale (holding potential −40 mV) and a time-expanded trace for the region highlighted by the gray bar in the trace above, showing multiple subconductance states within the channel peak conductance (e.g., OS1). E) Current–voltage relationship of all 6 mito-KNa1.2 channels showing average current at each holding potential. The decreased slope conductance (compared to Fig. 2H showing peak unitary conductance) indicates that subconductances averaging 75 pS dominated the average current during the recordings. F) Continuous trace (45 s) of a single channel. Gray shading: portions of each trace (right) that are repeated (left) on the next line. Gray dashed lines labeled C: closed states. G) Log binned channel closed and open dwell-time peaks and frequency of closed dwell times plotted against their duration. Table inset shows calculated area and time constants (τ).
Figure 4
Figure 4
Kcnt2−/− Cardiomyocyte bioenergetics and mitochondrial ultrastructure. A) Representative images of isolated cardiomyocytes from WT and Kcnt2−/− hearts. Scale bars, 100 µm. B) OCR of isolated cardiomyocytes measured with addition of oligomycin (1 µg/ml) and either 2.5 µM BT (KNa opener) or 500 nM FCCP (mitochondrial uncoupler). Statistics were measured using 2-way ANOVA with Bonferroni correction and post hoc t test. Bars with the same symbol are significantly different from each other (n = 4–5). Data are means ± sem. P < 0.05. C) Western blots from WT and Kcnt2−/− heart homogenates showing levels of mitochondrial proteins (SDHA, isocitrate dehydrogenase, cyclophilin D, and electron transfer flavoprotein subunit α) and Ponceau stain loading control. D) Representative transmission electron microscopic images of fixed heart slices. Bottom left panels: insets boxes at higher magnification. Scale bar, 1 µm. Top right panels: increased magnification of single mitochondria from WT and Kcnt2−/− mice with mitochondrial ultrastructure visible (i.e., cristae folds, outer and inner membrane contacts). Scale bar, 200 nm. E) Binned histogram of mitochondrial area or mitochondrial density, obtained from image analysis (n = 5). Data are means ± sd for each bin. F) Form-factor/aspect-ratio scatterplot. E, F) Data obtained from 1250 mitochondria, 25 fields of view, and 5 WT or Kcnt2−/− hearts.
Figure 5
Figure 5
KNa1.2 loss impacts cardiac metabolic substrate choice under stress. A) Representative OCR traces of isolated WT or Kcnt2−/− cardiomyocytes, incubated in the presence of different metabolic substrates. Data from a single XF plate are shown (mean ± sd of 12 wells/substrate or genotype). Timeline above traces shows the OCR was measured at baseline, then with the addition of the ATP synthase inhibitor oligomycin (1 µg/ml) plus the mitochondrial uncoupler FCCP (500 nM), and finally with the mitochondrial complex III inhibitor antimycin A (5 µM). B) Group OCR averages of baseline (B) and FCCP-uncoupled (F) cardiomyocytes under substrate conditions as defined above. Statistics were measured using 2-way ANOVA with Bonferroni correction and post hoc Student’s t test. Data are mean ± sem, for n = 4 Kcnt2−/− or 5 WT, independent cardiomyocyte preparations. Bars with the same symbol are significantly different from one another. P < 0.05. C) RR capacity calculated from the data in B (i.e., uncoupled minus baseline OCR). Mean ± sem (n = 4–5). *P < 0.05 between genotypes. Color key for metabolic substrates used in all panels is shown to the right of C. D) OCR of WT and Kcnt2−/− cardiomyocytes metabolizing different substrates. Empty bars, baseline (B); filled bars, FCCP uncoupled (F). Data are means ± sem from 4 to 5 independent cardiomyocyte preparations.
Figure 6
Figure 6
Loss of KNa1.2 impacts whole heart substrate choice under stress. A) Cardiac function data (heart rate × pressure product, RPP) for isolated perfused hearts from WT or Kcnt2−/− mice, perfused with Krebs-Henseleit (KH) buffer containing palmitate as the sole metabolic substrate. Bar below the traces indicates duration of 100 nM isoproterenol infusion. Graph shows RPP as a percentage of the average baseline value for 1 min. before isoproterenol infusion. Inset: comparison of the peak response to isoproterenol under this substrate condition (palmitate only, blue). Adjacent inset (right): the peak response to isoproterenol from a separate series of perfusions in which the KH buffer contained both palmitate and glucose as substrates (purple). Data are means ± sem (n = 7). *P < 0.05 between genotypes. B) EKG parameters obtained in vivo from tribromoethanol-anesthetized WT and Kcnt2−/− mice. R–R′, distance between R waves of each beat (i.e., 1/HR); P, P-wave duration; P–R, interval between P and R waves; QRS1 & QRS2, diameter of QRS complex (different calculation algorithms); Q–T, interval between Q and peak of T wave; Q–Tmax, interval between Q and end of T wave; Q–Tcorr, QT interval corrected for heart rate. Data are mean ± sd (n = 4–5 animals).
Figure 7
Figure 7
Loss of KNa1.2 impacts whole body metabolic phenotype. A) Body weights of WT and Kcnt2−/− male (diamond) and female (square) mice from weaning (3 wk) to 25 wk of age. Data are mean ± sd (n = 12). B) Representative DEXA images from WT and Kcnt2−/− mice. C) Percentage of body fat measured by DEXA scan of WT (white symbols) and Kcnt2−/− (black symbols) littermates (pairs are indicated by connected data points) (n = 14). WT, 8 Kcnt−/−. *P < 0.05 between genotypes by paired Student’s t test. D) Left: blood glucose levels measured in WT and Kcnt2−/− mice at baseline (5 pm, fed) and following a 15-h withdrawal from food (8 am, unfed). Data are mean ± sd (n = 12). *P < 0.05 between fed and unfed states within a genotype, P < 0.05 between genotypes.
Figure 8
Figure 8
Kcnt2−/− cardiac expression profiling and metabolomics. A) qPCR Ct values for 27 metabolically important genes (Table 1) in WT and Kcnt2−/− hearts (n = 3 independent RNA preparations/genotype). Data are mean, errors are omitted for clarity. B) WT and Kcnt2−/− hearts were perfused with KH buffer containing palmitate+glucose and freeze clamped for metabolomic analysis by liquid chromatography-MS/MS. Graph shows principle component analysis of 501 cardiac metabolites. The first and second principal components contributed 86.7% of the overall metabolic character. Shaded ovals overlaying the graph indicate 95% confidence intervals for WT (lime) and Kcnt2−/− (salmon pink) samples. C) Volcano plot of the metabolic profile of Kcnt2−/− vs. WT hearts. Dashed lines: P = 0.05 cut off (y axis) and 1.5-fold change cut off (x axis). Each point represents a single metabolite, and each point represents means (n = 7 mice). Errors are omitted for clarity. Red: metabolites meeting fold-change and P-value criteria; blue: additional metabolites discussed in the text. Diamonds: males; circles: data from both sexes combined.

Similar articles

Cited by

References

    1. Smith C. O., Nehrke K., Brookes P. S. (2017) The Slo(w) path to identifying the mitochondrial channels responsible for ischemic protection. Biochem. J. 474, 2067–2094 - PMC - PubMed
    1. Bentzen B. H., Nardi A., Calloe K., Madsen L. S., Olesen S. P., Grunnet M. (2007) The small molecule NS11021 is a potent and specific activator of Ca2+-activated big-conductance K+ channels. Mol. Pharmacol. 72, 1033–1044 - PubMed
    1. Wojtovich A. P., Smith C. O., Urciuoli W. R., Wang Y. T., Xia X. M., Brookes P. S., Nehrke K. (2016) Cardiac Slo2.1 is required for volatile anesthetic stimulation of K+ transport and anesthetic preconditioning. Anesthesiology 124, 1065–1076 - PMC - PubMed
    1. Garlid K. D., Paucek P., Yarov-Yarovoy V., Murray H. N., Darbenzio R. B., D’Alonzo A. J., Lodge N. J., Smith M. A., Grover G. J. (1997) Cardioprotective effect of diazoxide and its interaction with mitochondrial ATP-sensitive K+ channels. Possible mechanism of cardioprotection. Circ. Res. 81, 1072–1082 - PubMed
    1. Inoue I., Nagase H., Kishi K., Higuti T. (1991) ATP-sensitive K+ channel in the mitochondrial inner membrane. Nature 352, 244–247 - PubMed