. 2018 Aug 1;128(8):3369-3381.
doi: 10.1172/JCI120115. Epub 2018 Jul 9.

Neuronatin regulates pancreatic β cell insulin content and secretion

Affiliations

Neuronatin regulates pancreatic β cell insulin content and secretion

Steven J Millership et al. J Clin Invest. .

Abstract

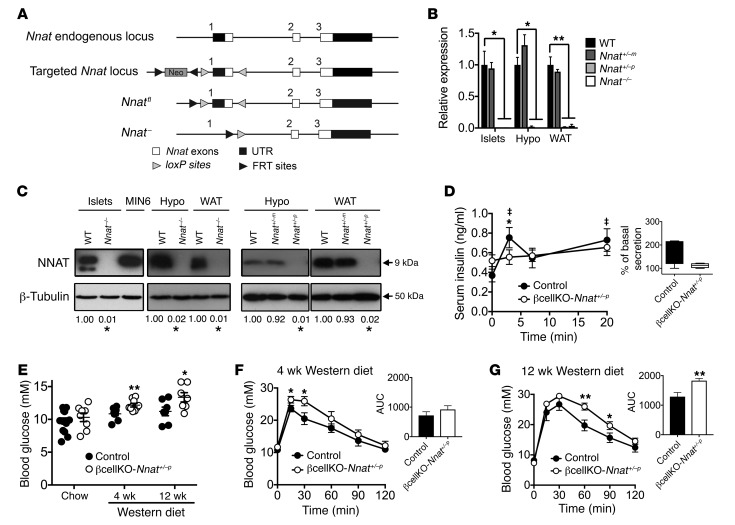
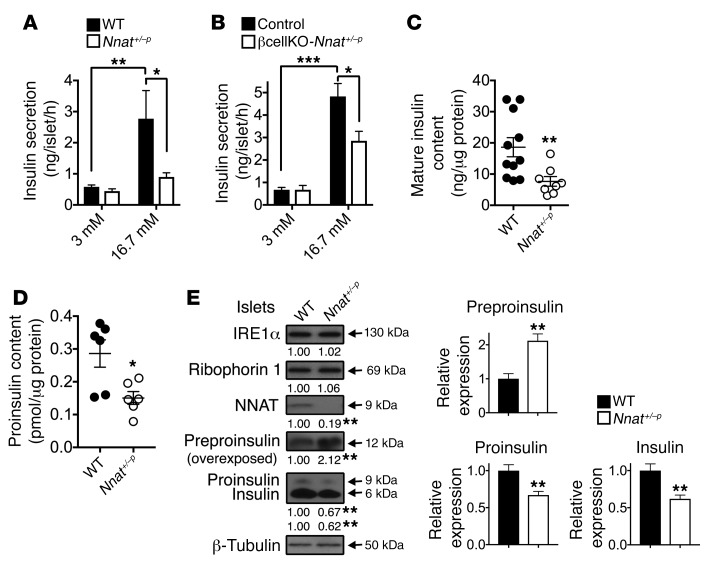
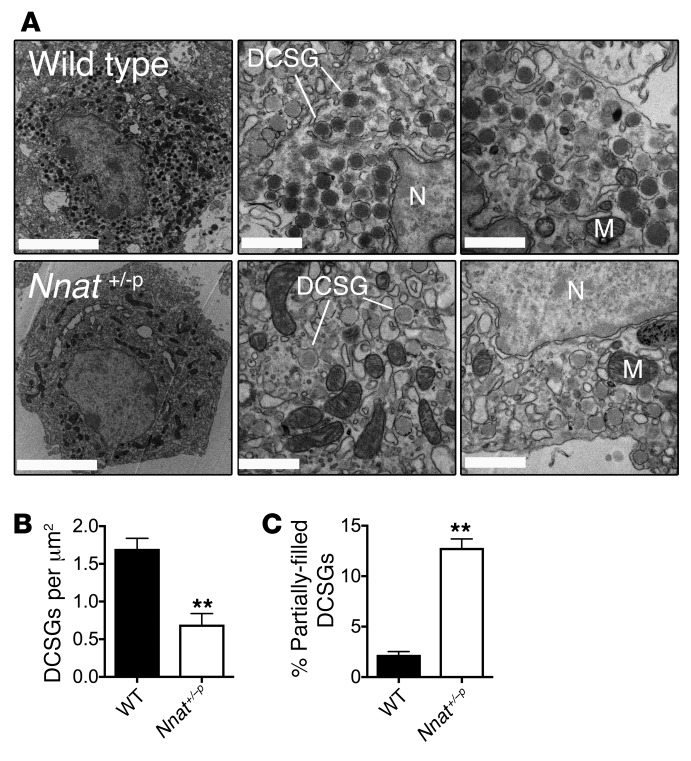
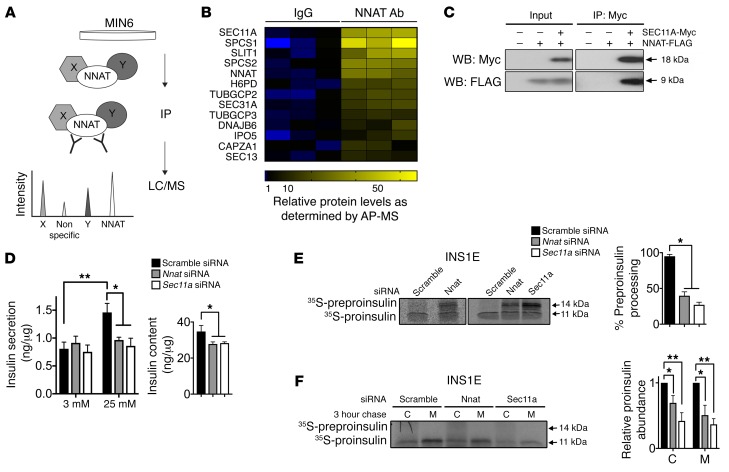
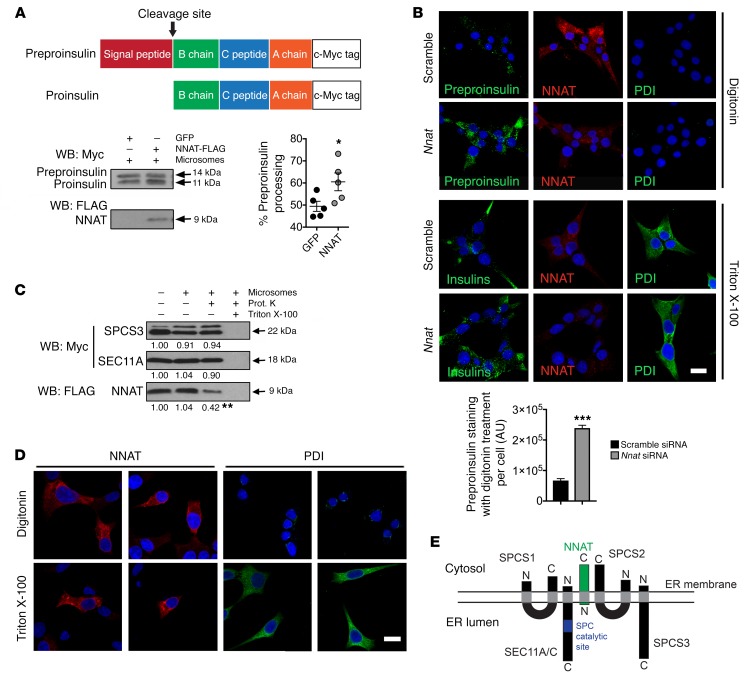
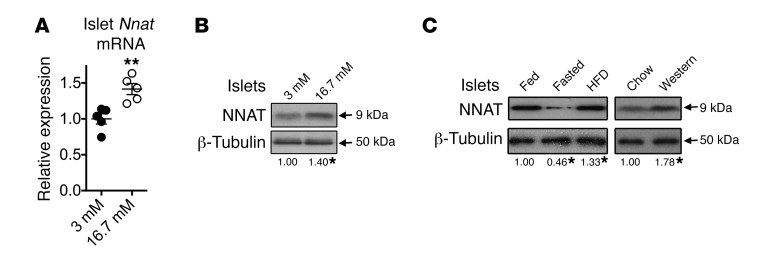
Neuronatin (Nnat) is an imprinted gene implicated in human obesity and widely expressed in neuroendocrine and metabolic tissues in a hormone- and nutrient-sensitive manner. However, its molecular and cellular functions and precise role in organismal physiology remain only partly defined. Here we demonstrate that mice lacking Nnat globally or specifically in β cells display impaired glucose-stimulated insulin secretion leading to defective glucose handling under conditions of nutrient excess. In contrast, we report no evidence for any feeding or body weight phenotypes in global Nnat-null mice. At the molecular level neuronatin augments insulin signal peptide cleavage by binding to the signal peptidase complex and facilitates translocation of the nascent preprohormone. Loss of neuronatin expression in β cells therefore reduces insulin content and blunts glucose-stimulated insulin secretion. Nnat expression, in turn, is glucose-regulated. This mechanism therefore represents a novel site of nutrient-sensitive control of β cell function and whole-animal glucose homeostasis. These data also suggest a potential wider role for Nnat in the regulation of metabolism through the modulation of peptide processing events.

Keywords: Beta cells; Cell Biology; Diabetes; Genetics; Insulin.


Conflict of interest statement

Conflict of interest: The authors have declared that no conflict of interest exists.

Figures

Figure 1
Figure 1. Effect of Nnat deficiency in vivo.
(A) Targeted inactivation of the Nnat gene. Exon 1 was flanked by loxP sites with the neomycin selection cassette (Neo) flanked by FRT sites, to produce a floxed and null allele. (B and C) Quantitative RT-PCR and representative Western blot analysis of Nnat expression in tissues of WT, heterozygous Nnat+/–m (maternal deletion), heterozygous Nnat+/–p (paternal deletion), and homozygous Nnat–/– mice on C57BL/6J background. Data are compared with WT mice (n = 4–7 animals per group, Kruskal-Wallis or Mann-Whitney U test). (D) Measurement of insulin secretion in vivo in response to i.p. glucose in 10-week-old male βcellKO-Nnat+/–p versus control mice on C57BL/6J background (n = 8 animals per genotype, ANOVA with repeated measures). Inset shows box-and-whisker plot of the same data plotted as percentage insulin secretion across all time points compared with basal insulin values (at T = 0). (“‡” indicates statistically significant increases, P < 0.05, in secretion in WT mice compared with basal insulin values.) (E) Fasted (4-hour) blood glucose levels from 10-week-old chow-fed male βcellKO-Nnat+/–p versus control mice and from male mice of both genotypes fed Western diet for 4 weeks (14 weeks old) and 12 weeks (22 weeks old) (Student’s t test for each time point, all C57BL/6J, n = 7–14 animals per genotype, per time point, minimum 2 independent cohorts). (F and G) Glucose tolerance in overnight-fasted Western diet–fed groups as in E (ANOVA with repeated measures). Insets show means of area under the curve (AUC) for both genotypes at both time points (Student’s t test for each). (*P < 0.05, **P < 0.01).
Figure 2
Figure 2. Insulin content and secretion in Nnat-deficient islets.
(A) Insulin secretion in static incubations of primary isolated islets from 10-week-old male Nnat+/–p and WT mice was determined in vitro under low-glucose (3 mM) and high-glucose (16.7 mM) conditions (n = 12 animals per group, 2-way ANOVA). (B) Insulin secretion in static incubations of primary isolated islets from 10-week-old male control and βcellKO-Nnat+/–p mice was determined as in A (n = 8 mice per genotype, both 3 independent experiments). (C and D) Mature insulin content (C) (n = 11 for WT and 8 for Nnat+/–p, Student’s t test) and proinsulin content (D) (n = 6 animals per group, Mann-Whitney U test) were quantified in isolated islets from 10-week-old male WT and Nnat+/–p mice and normalized to total protein. (E) Western blotting analysis of protein levels in primary isolated islets from 10-week-old male Nnat+/–p and WT mice. A representative blot of 2 independent experiments (n = 4 mice per genotype, Student’s t test) is shown. β-Tubulin was used as a loading control. Mean values for band intensities in multiple experiments quantified by densitometry are shown below each panel as well as in associated bar charts for insulin species, all expressed relative to WT samples (*P < 0.05, **P < 0.01, ***P < 0.001).
Figure 3
Figure 3. Insulin secretory granule morphology in Nnat-deficient β cells by electron microscopy.
(A) Left: Representative electron micrographs of β cells from 10-week-old male WT and Nnat+/–p mice in ultrathin sections (scale bars: 5 μm). Middle and right: Higher-magnification images showing dense core secretory granules (DCSG), nuclei (N), and various mitochondria (M) (scale bars: 1 μm). A total of 9 β cells from sections of fixed islets were analyzed from 3 different animals per genotype. (B and C) Quantification of the number of DCSGs per unit area, and also percentage of partially filled DCSGs, using electron microscopy images from WT and Nnat+/–p β cells in A (**P < 0.01, both Student’s t test).
Figure 4
Figure 4. NNAT interaction with the SPC and modulation of preproinsulin handling.
(A) Overview of affinity purification/mass spectrometry (AP/MS) screen for novel interaction partners of NNAT. Endogenous NNAT was immunoprecipitated (IP) from MIN6 cell lysates and interacting partners in co-IPs analyzed by liquid chromatography/mass spectrometry (LC/MS). (B) Heatmap from AP/MS analysis of top protein hits in IPs using antibodies against NNAT (NNAT Ab) and control IPs with rabbit immunoglobulins (IgG). Relatively high abundance is shown in yellow and relatively low abundance in blue. (C) Lysates from HEK293T cells expressing c-Myc–tagged SEC11A and FLAG-tagged NNAT were immunoprecipitated using anti–c-Myc antibodies. Proteins in input and IP samples were detected by Western blotting using anti–c-Myc and anti-FLAG antibodies. Panel shows a representative blot of 3 independent experiments. (D) INS1E cells transiently transfected with siRNA targeting Nnat or Sec11a were assayed in vitro for GSIS at low (3 mM) and high (25 mM) glucose. A scramble siRNA served as a control with data expressed as mean insulin secretion per unit cellular protein. Graph on the right shows total insulin content in cell lysates. (n = 9 independent cultures per group, 3 independent experiments, 2-way ANOVA [left graph] and 1-way ANOVA [right graph].) (E) INS1E cells transfected with c-Myc–tagged preproinsulin and siRNAs targeting Nnat or Sec11a were pulse-labeled with 35S-Cys/Met. Lysates immunoprecipitated with anti–c-Myc agarose were analyzed by autoradiography. Associated bar chart shows preproinsulin and proinsulin band intensities in multiple experiments quantified by densitometry and expressed as percentage processing of preproinsulin (n = 3 cultures per group from 3 independent experiments, 1-way ANOVA). (F) Similar experiments performed as in E, from 3-hour chase cell lysates (C) and media (M), quantified as in E (n = 4 cultures per group from 3 independent experiments, 1-way ANOVA for both C and M). (*P < 0.05, **P < 0.01).
Figure 5
Figure 5. ER membrane topology of NNAT and its direct effect on SPC processing.
(A) Representative Western blotting analysis of in vitro–translated preproinsulin converted to proinsulin in the presence (+) of pancreatic microsomes with and without coexpression of NNAT, expressed as percentage processing of preproinsulin. Coexpression of GFP was used as a control (n = 5 reactions per group, *P < 0.05, Mann-Whitney U test). (B) INS1E cells with Nnat siRNA knockdown versus scramble siRNA control were permeabilized with digitonin or Triton X-100, immunostained using an antibody that detects all insulin species (Insulins, green) and also NNAT (red), and visualized by confocal microscopy. The luminal ER protein PDI (green) was used to assess membrane permeabilization, and nuclei were visualized with DAPI. Scale bar: 10 μm. Fields of view were quantified for total fluorescence using ImageJ (NIH) from insulin-stained cells permeabilized with digitonin and normalized to cell number (Student’s t test, ***P < 0.001). (C) Representative Western blotting analysis of C-terminal c-Myc–tagged SPCS3 and SEC11A, and FLAG-tagged NNAT translated in vitro in the presence (+) or absence (–) of pancreatic microsomes and treated with proteinase K (Prot. K) (n = 3 reactions per group, mean vs. absence of microsomes, **P < 0.01, Student’s t test vs. presence of microsomes). (D) Immunofluorescent staining of INS1E cells permeabilized with digitonin or Triton X-100 with use of antibodies against NNAT (red) and PDI (green) visualized by confocal microscopy. PDI was used to assess membrane permeabilization, and nuclei were visualized with DAPI. Scale bar: 10 μm. (E) Topology of NNAT (green) and subunits of the SPC (black) on the ER membrane. The catalytic site for signal peptidase cleavage in SEC11A/C is shown in blue (N and C, amino- and carboxy terminal, respectively).
Figure 6
Figure 6. Regulation of NNAT expression in islets by glucose and diet.
(A) Quantitative RT-PCR analysis of Nnat mRNA in isolated islets from 10-week-old male WT C57BL/6J mice cultured in low-glucose (3 mM) or high-glucose (16.7 mM) conditions for 6 hours. Hprt mRNA was used as an internal control, and data are compared with 3-mM cultures (n = 5 animals per group, Mann-Whitney U test). (B) Parallel islet preparations receiving the same treatment as in A were analyzed for protein expression by Western blotting. β-Tubulin was used as a loading control. (C) Representative Western blot analysis of NNAT protein expression in isolated pancreatic islets of 10-week-old male WT C57BL/6J mice that were chow-fed (Fed), fasted overnight (Fasted), or fed high-fat diet for 72 hours (HFD). Similar experiments were also performed with 72-hour feeding with Western diet (Western) compared with chow-fed controls (Chow). β-Tubulin was used as a loading control (n = 5 animals per group, Kruskal-Wallis for HFD studies, left panels, and Mann-Whitney U test for Western diet studies, right panels). Mean values for each condition are shown below each panel, compared with chow-fed controls. (*P < 0.05, **P < 0.01).

References

    1. Surani MA. Genomic imprinting: control of gene expression by epigenetic inheritance. Curr Opin Cell Biol. 1994;6(3):390–395. doi: 10.1016/0955-0674(94)90031-0. - DOI - PubMed
    1. Peters J. The role of genomic imprinting in biology and disease: an expanding view. Nat Rev Genet. 2014;15(8):517–530. doi: 10.1038/nrg3766. - DOI - PubMed
    1. Dou D, Joseph R. Cloning of human neuronatin gene and its localization to chromosome-20q 11.2-12: the deduced protein is a novel “proteolipid”. Brain Res. 1996;723(1–2):8–22. - PubMed
    1. Joseph R, Dou D, Tsang W. Neuronatin mRNA: alternatively spliced forms of a novel brain-specific mammalian developmental gene. Brain Res. 1995;690(1):92–98. doi: 10.1016/0006-8993(95)00621-V. - DOI - PubMed
    1. Suh YH, et al. Ectopic expression of Neuronatin potentiates adipogenesis through enhanced phosphorylation of cAMP-response element-binding protein in 3T3-L1 cells. Biochem Biophys Res Commun. 2005;337(2):481–489. doi: 10.1016/j.bbrc.2005.09.078. - DOI - PubMed

Publication types