

DNA immunization site determines the level of gene expression and the magnitude, but not the type of the induced immune response
- PMID: 29864114
- PMCID: PMC5986124
- DOI: 10.1371/journal.pone.0197902
DNA immunization site determines the level of gene expression and the magnitude, but not the type of the induced immune response
Erratum in
-
Correction: DNA immunization site determines the level of gene expression and the magnitude, but not the type of the induced immune response.PLoS One. 2021 Feb 11;16(2):e0247239. doi: 10.1371/journal.pone.0247239. eCollection 2021. PLoS One. 2021. PMID: 33571288 Free PMC article.
Abstract
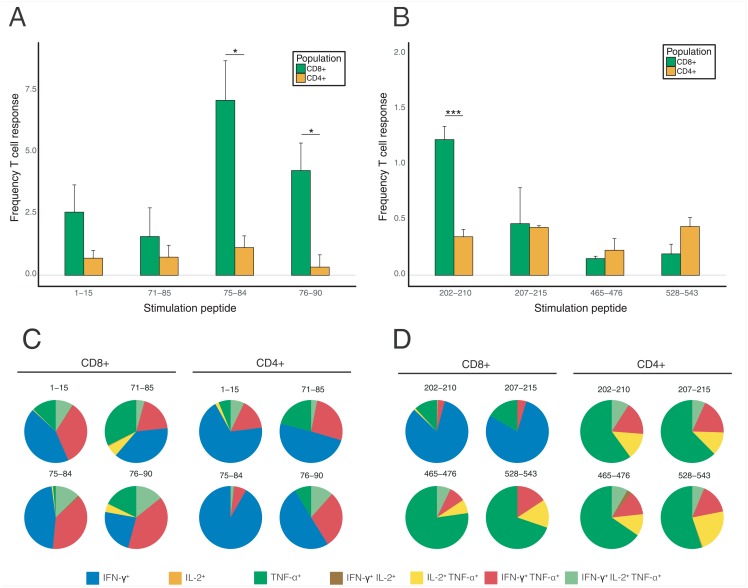
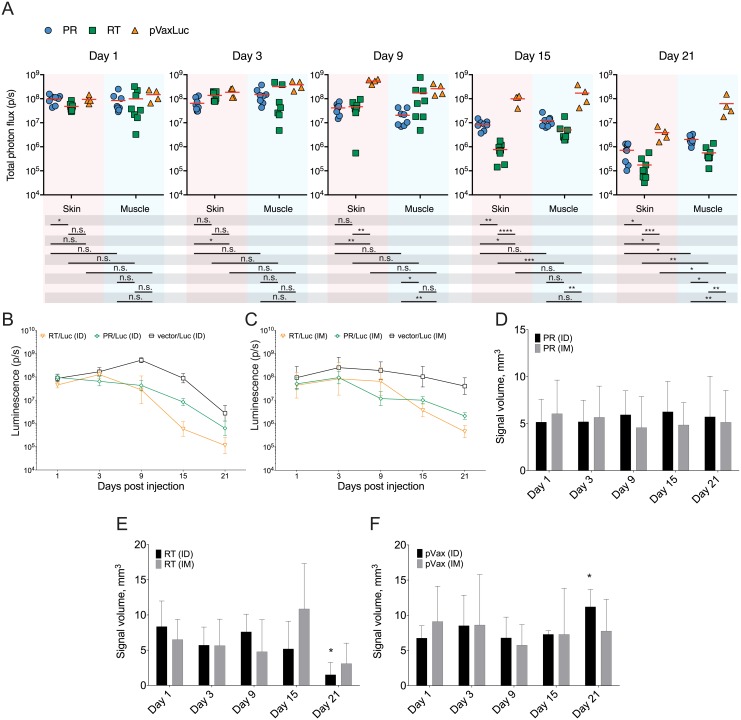
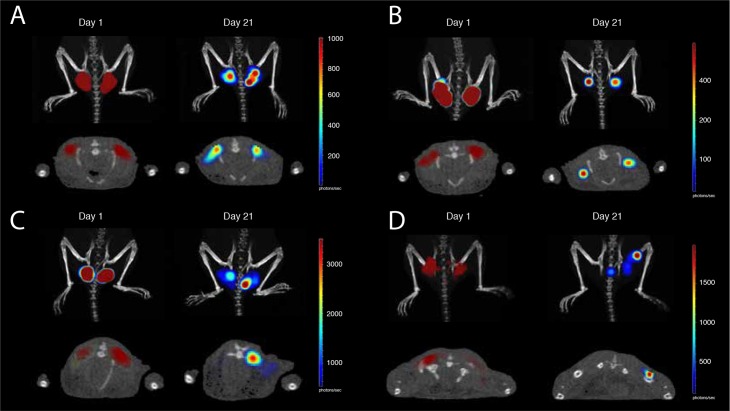
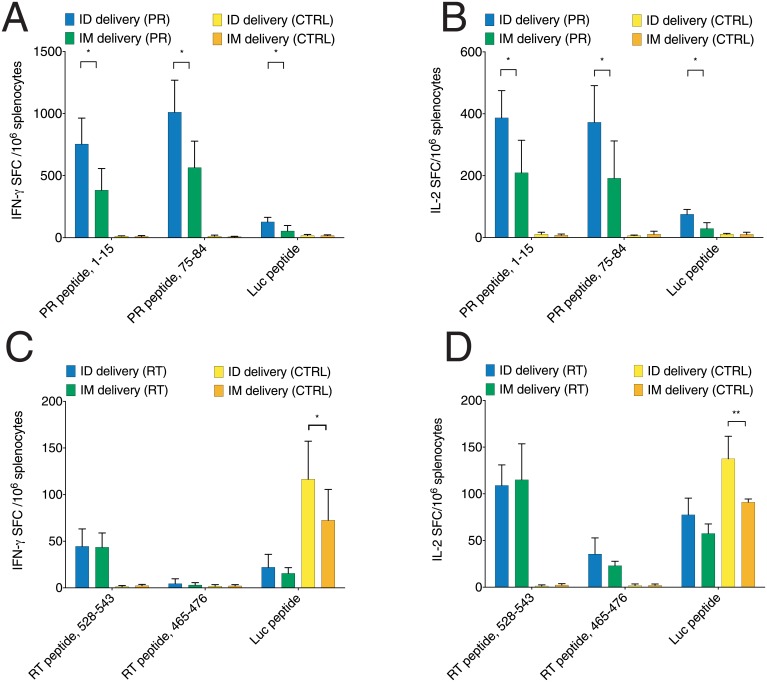
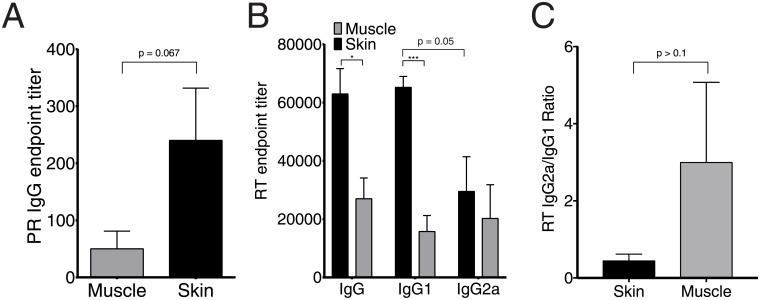
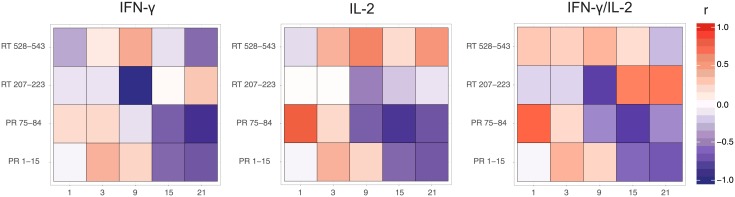
Optimization of DNA vaccine delivery improves the potency of the immune response and is crucial to clinical success. Here, we inquired how such optimization impacts the magnitude of the response, its specificity and type. BALB/c mice were DNA-immunized with two model immunogens, HIV-1 protease and reverse transcriptase by intramuscular or intradermal injections with electroporation. DNA immunogens were co-delivered with DNA encoding luciferase. Delivery and expression were monitored by in vivo bioluminescence imaging (BLI). The endpoint immune responses were assessed by IFN-γ/IL-2 FluoroSpot, multiparametric flow cytometry and antibody ELISA. Expression and immunogenicity were compared in relation to the delivery route. Regardless of the route, protease generated mainly IFN-γ, and reverse transcriptase, IL-2 and antibody response. BLI of mice immunized with protease- or reverse transcriptase/reporter plasmid mixtures, demonstrated significant loss of luminescence over time. The rate of decline of luminescence strongly correlated with the magnitude of immunogen-specific response, and depended on the immunogenicity profile and the immunization route. In vitro and in vivo BLI-based assays demonstrated that intradermal delivery strongly improved the immunogenicity of protease, and to a lesser extent, of reverse transcriptase. Immune response polarization and epitope hierarchy were not affected. Thus, by changing delivery/immunogen expression sites, it is possible to modulate the magnitude, but not the type or fine specificity of the induced immune response.
Conflict of interest statement
The authors have declared that no competing interests exist.
Figures
Similar articles
-
Evaluation of immunogen delivery by DNA immunization using non-invasive bioluminescence imaging.Hum Vaccin Immunother. 2013 Oct;9(10):2228-36. doi: 10.4161/hv.25561. Epub 2013 Jul 3. Hum Vaccin Immunother. 2013. PMID: 23896580 Free PMC article.
-
Codon optimization and improved delivery/immunization regimen enhance the immune response against wild-type and drug-resistant HIV-1 reverse transcriptase, preserving its Th2-polarity.Sci Rep. 2018 May 24;8(1):8078. doi: 10.1038/s41598-018-26281-z. Sci Rep. 2018. PMID: 29799015 Free PMC article.
-
Comparison of plasmid vaccine immunization schedules using intradermal in vivo electroporation.Clin Vaccine Immunol. 2011 Sep;18(9):1577-81. doi: 10.1128/CVI.05045-11. Epub 2011 Jul 13. Clin Vaccine Immunol. 2011. PMID: 21752954 Free PMC article.
-
Oxidative stress induced by HIV-1 reverse transcriptase modulates the enzyme's performance in gene immunization.Hum Vaccin Immunother. 2013 Oct;9(10):2111-9. doi: 10.4161/hv.25813. Epub 2013 Jul 23. Hum Vaccin Immunother. 2013. PMID: 23881028 Free PMC article.
-
Enhanced immunogenicity of an HIV-1 DNA vaccine delivered with electroporation via combined intramuscular and intradermal routes.J Virol. 2014 Jun;88(12):6959-69. doi: 10.1128/JVI.00183-14. Epub 2014 Apr 9. J Virol. 2014. PMID: 24719412 Free PMC article.
Cited by
-
Activation of Early Proinflammatory Responses by TBEV NS1 Varies between the Strains of Various Subtypes.Int J Mol Sci. 2023 Jan 5;24(2):1011. doi: 10.3390/ijms24021011. Int J Mol Sci. 2023. PMID: 36674524 Free PMC article.
-
Emergence of SARS-CoV-2 spike protein at the vaccination site.Immun Inflamm Dis. 2023 Mar;11(3):e827. doi: 10.1002/iid3.827. Immun Inflamm Dis. 2023. PMID: 36988249 Free PMC article.
-
In silico Designed Ebola Virus T-Cell Multi-Epitope DNA Vaccine Constructions Are Immunogenic in Mice.Vaccines (Basel). 2019 Mar 29;7(2):34. doi: 10.3390/vaccines7020034. Vaccines (Basel). 2019. PMID: 30934980 Free PMC article.
-
Mechanisms of ag85a/b DNA vaccine conferred immunotherapy and recovery from Mycobacterium tuberculosis-induced injury.Immun Inflamm Dis. 2023 May;11(5):e854. doi: 10.1002/iid3.854. Immun Inflamm Dis. 2023. PMID: 37249284 Free PMC article.
-
Third-Generation Vaccines: Features of Nucleic Acid Vaccines and Strategies to Improve Their Efficiency.Genes (Basel). 2022 Dec 4;13(12):2287. doi: 10.3390/genes13122287. Genes (Basel). 2022. PMID: 36553554 Free PMC article. Review.
References
-
- Saade F, Petrovsky N. Technologies for enhanced efficacy of DNA vaccines. Expert Review of Vaccines. 2012;11(2):189–209. doi: 10.1586/erv.11.188 - DOI - PMC - PubMed
-
- Roos AK, Moreno S, Leder C, Pavlenko M, King A, Pisa P. Enhancement of cellular immune response to a prostate cancer DNA vaccine by intradermal electroporation. Molecular Therapy. 2006;13(2):320–327. doi: 10.1016/j.ymthe.2005.08.005 - DOI - PubMed
-
- Alonso M, Leong JAC. Licensed DNA Vaccines against Infectious Hematopoietic Necrosis Virus (IHNV). Recent patents on DNA & gene sequences. 2013;7(1):62–5. doi: 10.2174/1872215611307010009 - DOI - PubMed
-
- Liu J, Kjeken R, Mathiesen I, Barouch DH. Recruitment of Antigen-Presenting Cells to the Site of Inoculation and Augmentation of Human Immunodeficiency Virus Type 1 DNA Vaccine Immunogenicity by In Vivo Electroporation. Journal of Virology. 2008;82(11):5643–5649. doi: 10.1128/JVI.02564-07 - DOI - PMC - PubMed
-
- Kulkarni V, Rosati M, Bear J, Pilkington GR, Jalah R, Bergamaschi C, et al. Comparison of intradermal and intramuscular delivery followed by in vivo electroporation of SIV Env DNA in macaques. Human Vaccines and Immunotherapeutics. 2013;9(10):2081–2094. doi: 10.4161/hv.25473 - DOI - PMC - PubMed
Publication types
MeSH terms
Substances
LinkOut - more resources
Full Text Sources
Other Literature Sources
Medical
