. 2018 Jun 4;14(6):e1006205.
doi: 10.1371/journal.pcbi.1006205. eCollection 2018 Jun.

Instance-based generalization for human judgments about uncertainty

Affiliations

Instance-based generalization for human judgments about uncertainty

Philipp Schustek et al. PLoS Comput Biol. .

Abstract

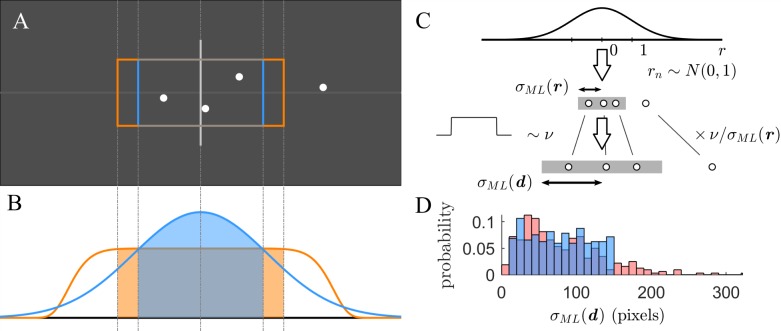
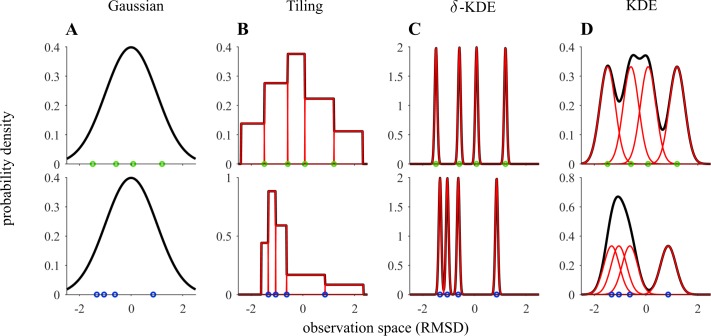
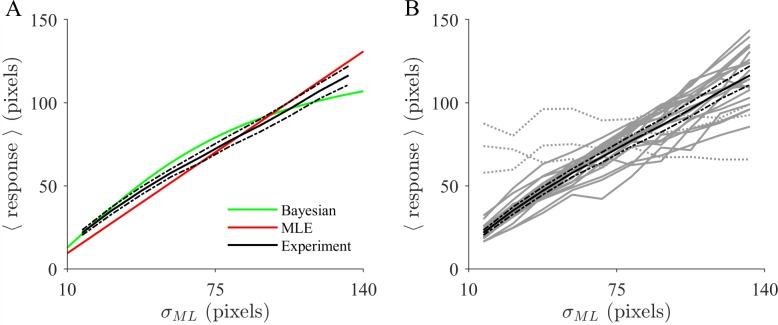
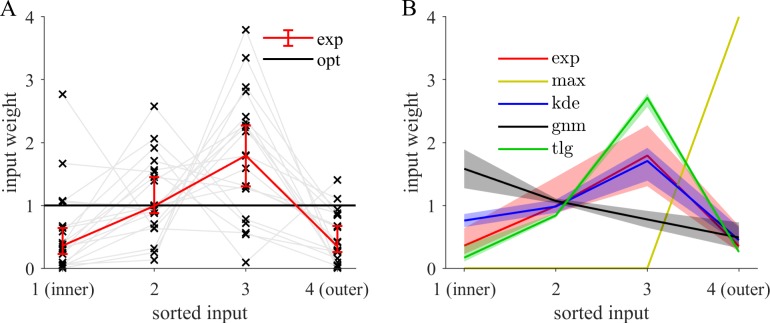
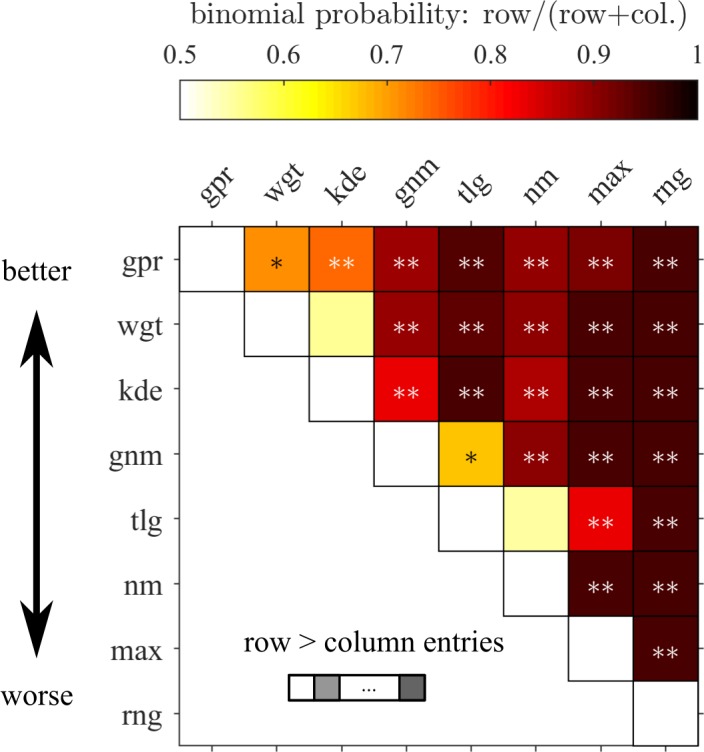
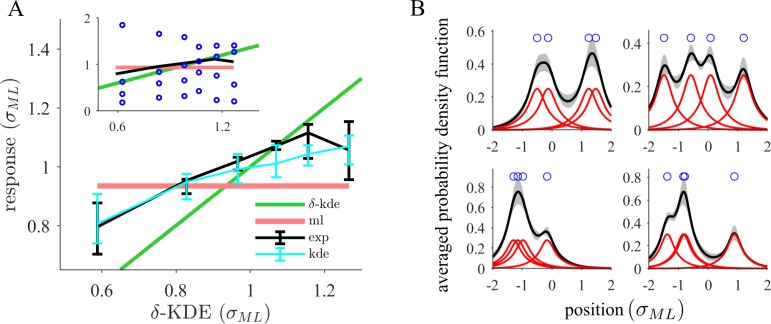
While previous studies have shown that human behavior adjusts in response to uncertainty, it is still not well understood how uncertainty is estimated and represented. As probability distributions are high dimensional objects, only constrained families of distributions with a low number of parameters can be specified from finite data. However, it is unknown what the structural assumptions are that the brain uses to estimate them. We introduce a novel paradigm that requires human participants of either sex to explicitly estimate the dispersion of a distribution over future observations. Judgments are based on a very small sample from a centered, normally distributed random variable that was suggested by the framing of the task. This probability density estimation task could optimally be solved by inferring the dispersion parameter of a normal distribution. We find that although behavior closely tracks uncertainty on a trial-by-trial basis and resists an explanation with simple heuristics, it is hardly consistent with parametric inference of a normal distribution. Despite the transparency of the simple generating process, participants estimate a distribution biased towards the observed instances while still strongly generalizing beyond the sample. The inferred internal distributions can be well approximated by a nonparametric mixture of spatially extended basis distributions. Thus, our results suggest that fluctuations have an excessive effect on human uncertainty judgments because of representations that can adapt overly flexibly to the sample. This might be of greater utility in more general conditions in structurally uncertain environments.


Conflict of interest statement

The authors have declared that no competing interests exist.

Figures

Fig 1
Fig 1. Human participants perform a task consisting in estimating the dispersion of future events based on a few observations.
(A) Schematic of one trial of the task. Participants were asked to judge the unknown accuracy of a “dart player” to hit the center of the board (gray rectangle). Based on the four observed “darts” (white dots), participants must predict where future darts might strike the board. Specifically, participants were asked to capture 65% of all future imaginary darts by adjusting the width of the rectangular frame (colored frames, see below). Only the horizontal dispersion of the dots is relevant to estimate the accuracy of the dart player, while vertical displacements are added just to improve visibility of the samples. (B) Based on the observed samples, the participant might infer a predictive probability distribution over the position of the next sample. Two hypothetical predictive distributions are shown, representing different structural assumptions about how the samples might have been generated, corresponding to maximum likelihood estimation based on a Gaussian distribution (blue) or a generalized normal distribution with shape parameter p = 10 (orange) (see Methods). Based on the predictive probability distribution, the participant can set the frame’s width so that it matches the target percentage of 65% (colored frames in panel A). Note that for the assumption of a generalized normal distribution, the posterior is more sensitive to data points far from the center and hence a larger frame is chosen. (C) The horizontal positions of the points with respect to the center were generated as follows. First, all samples r = (r1,…,r4) were generated independently from a standard normal distribution. Second, the samples were scaled by the factor ν/σML(r), where σML(r)=1/Nrn2 is the maximum likelihood estimator (MLE) for a normal distribution centered at zero and ν is drawn from a uniform probability distribution over the range of [10,140] pixels. The scaled samples d = ν/σML(r) ⋅ r feature a MLE given by σML(d)=1/Ndn2=ν. This method allows choosing any desired distribution of σML(d) by setting ν correspondingly. (D) Histogram of σML(d) across 320 trials (blue). For comparison, the red histogram indicates the results for a sample scaling d = νr without normalizing by σML(r). Both samples have a comparable mean, but the red distribution features few but extremely outlying values, which are avoided by our scaling method.
Fig 2
Fig 2. Generalization beyond the observed sample is governed by the parametric assumptions of the distribution.
Each row shows examples of probability densities (black lines) for a different sample (green and blue dots, four observations) in units of its root mean squared deviation (RMSD). (A) A zero-centered unimodal Gaussian distribution is used to account for the whole sample. All point positions d = (d1,…,d4) enter via the estimated standard deviation parameter, σML(d) (RMSD), determined by probabilistic inference. Whereas for instanced-based generalization the sample points effectively enter as parameters themselves. (B-D) Different additive basis distributions (red) can be used to cover the observation space. The tiling model covers the space with adjacent non-overlapping uniform basis distributions resulting in a compressed distribution around spatially proximal points (B). Additionally, models can be constructed from simpler components by centering a Gaussian kernel on each observation (see Methods). In the limit of vanishing kernel widths (C) there is no generalization beyond the sample while for larger widths (D) a smoothed density over the whole domain is obtain due to overlapping basis distributions.
Fig 3
Fig 3. Human behavior closely tracks trial-by-trial uncertainty of future events.
(A) Mean responses across participants plotted as a function of the MLE of the sample, σML(d), in ten equally spaced bins (black; error bars, 95% CI). Basing behavior on a Gaussian estimated by ML (red, N(x|0,σML(d))) results in responses proportional to the estimate. The prior distribution that is assumed by the devised Bayesian benchmark model (green) biases responses towards intermediate values (see Methods). (B) Individual response curves of all 23 participants tested (gray lines). Three participants displaying poor compliance with the instructed task (dotted) were excluded from further analysis. The average across the remaining participants is superimposed (black).
Fig 4
Fig 4. Behavior is consistent with participants possessing a subjective but well calibrated trial-by-trial internal objective that remains stable over the experiment.
(A) Across trials participants tend to comply well to the objective despite per trial deviations due to systematic biases and response noise, as the capture percentage c is typically around the target value 65% (vertical axis) and the median deviance is relatively small (horizontal axis). Histograms correspond to marginal distributions. (B) Participants display stable behavior throughout the experiment, as they do not appear to adjust their responses closer to the task objective over time. Median capture percentages c are calculated separately for the first and second halves of the experimental session.
Fig 5
Fig 5. The weighting pattern of the observed samples deviates from inference of a close-to-normal distribution and matches kernel density estimation (KDE).
Evaluation of the normalized weights ωn of the weighting-model S^(d)=1/Nnωndn2 as a generalization of the MLE of a zero centered Gaussian. The points are indexed according to their distance from the center. (A) Input weight that each participant (gray lines) assigns as a function of the weight index. If participants followed optimal MLE based on a Gaussian centered at zero, all input weights should be equal (black line). Fitting of the weighting model (see Methods) shows a systematic deviation of the across participant median (red, error bars, 95% CI). Participants tend to overweigh the third most extreme value compared to the others. (B) Among all models tested, only KDE (blue) qualitatively matches the characteristics of the experimental weighting pattern (red, same as panel A). The other models fail to capture the behavioral weighting pattern (fits of the weighting model to the other indicated models’ output). Model abbreviations: kde—kernel density estimation, tlg—tiling, gnm—generalized normal, max–maximum.
Fig 6
Fig 6. Pairwise model comparison evidences an inclination to resort to instance-based generalization, indicating that fluctuations have a profound effect on the inferred representations.
Summarized results of a hierarchical Bayesian model comparison procedure that estimates probability distributions over models. Pairwise comparisons (each square) are performed to evidence relative differences in prediction for models with different features. The color code over each square shows estimates of the parameter of the binomial distribution governing the probability by which the model indexed by the row is more likely than the one indexed by the column. This corresponds to the expectation value that a given model is considered responsible for generating the data of a randomly chosen participant. Superimposed are large differences of the exceedance probability (*=^(0.99>pexc0.95); **=^pexc0.99) which quantifies the belief that the row model is more likely to have generated the data of a randomly chosen participant compared to the column model. Model abbreviations: gpr—Gaussian process regression, wgt—weighting, kde—kernel density estimation, gnm—generalized normal, tlg—tiling, nm—normal, max—maximum, rng–range.
Fig 7
Fig 7. Strong generalization is consistent with the possibility of integrating prior knowledge about the task structure.
(A) Responses (black) show higher consistency with inference of a single Gaussian than with approaches generalizing only weakly beyond the sample such as δ-KDE (limit of vanishing kernel widths; third most excentric sample point). The plot shows aggregated (median across participants, 95% CI) bin medians of the responses (normalized by σML) and the fitted KDE model (cyan) as a function of the δ-KDE output (approximately equally filled bins). By construction, inference of a Gaussian results in a horizontal line (red) while δ-KDE (green) yields a linear function of slope one. The experimental curves are less steep indicating a rather moderate instance-based modulation compared to a Gaussian model. The inset is a zoomed-out version additionally showing the relationship of the responses to the distribution of sample points (median of absolute value within each bin). (B) The KDE model infers internal distributions that are smoothed and spatially extended around the sample points. The mean probability density function across participants (black, 95% CI) is shown for four different samples (blue circles). The inferred density is smooth featuring fewer modes than the number of basis distributions (red curves). This is a consequence of the large fitted Gaussian kernel widths which lead to substantial overlap of the basis distributions.

Similar articles

Cited by

References

    1. Kalman RE. A New Approach to Linear Filtering and Prediction Problems. J Basic Eng. 1960;82: 35–45. doi: 10.1115/1.3662552 - DOI
    1. Pouget A, Beck JM, Ma WJ, Latham PE. Probabilistic brains: knowns and unknowns. Nat Neurosci. 2013;16: 1170–1178. doi: 10.1038/nn.3495 - DOI - PMC - PubMed
    1. Ma WJ, Jazayeri M. Neural Coding of Uncertainty and Probability. Annu Rev Neurosci. 2014;37: 205–220. doi: 10.1146/annurev-neuro-071013-014017 - DOI - PubMed
    1. Kording KP, Wolpert DM. Bayesian integration in sensorimotor learning. Nature. 2004;427: 244–247. doi: 10.1038/nature02169 - DOI - PubMed
    1. Trommershäuser J, Gepshtein S, Maloney LT, Landy MS, Banks MS. Optimal Compensation for Changes in Task-Relevant Movement Variability. J Neurosci. 2005;25: 7169–7178. doi: 10.1523/JNEUROSCI.1906-05.2005 - DOI - PMC - PubMed

Publication types