

Improving early epidemiological assessment of emerging Aedes-transmitted epidemics using historical data
- PMID: 29864129
- PMCID: PMC6002135
- DOI: 10.1371/journal.pntd.0006526
Improving early epidemiological assessment of emerging Aedes-transmitted epidemics using historical data
Abstract
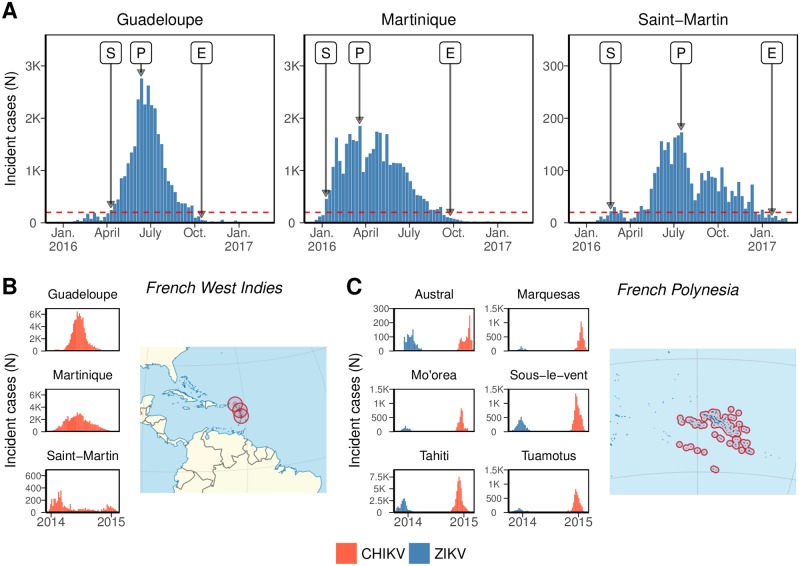
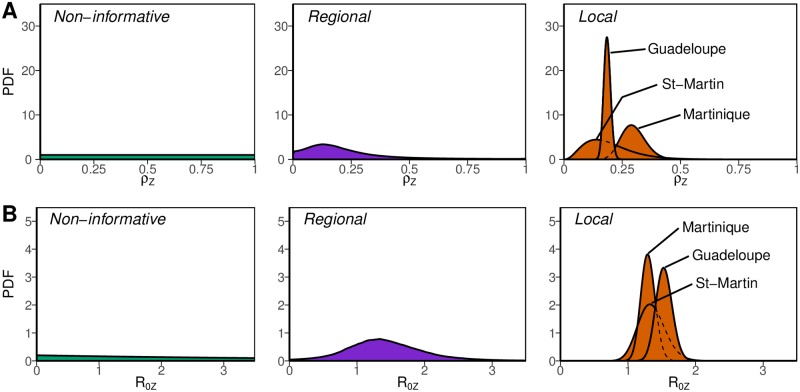
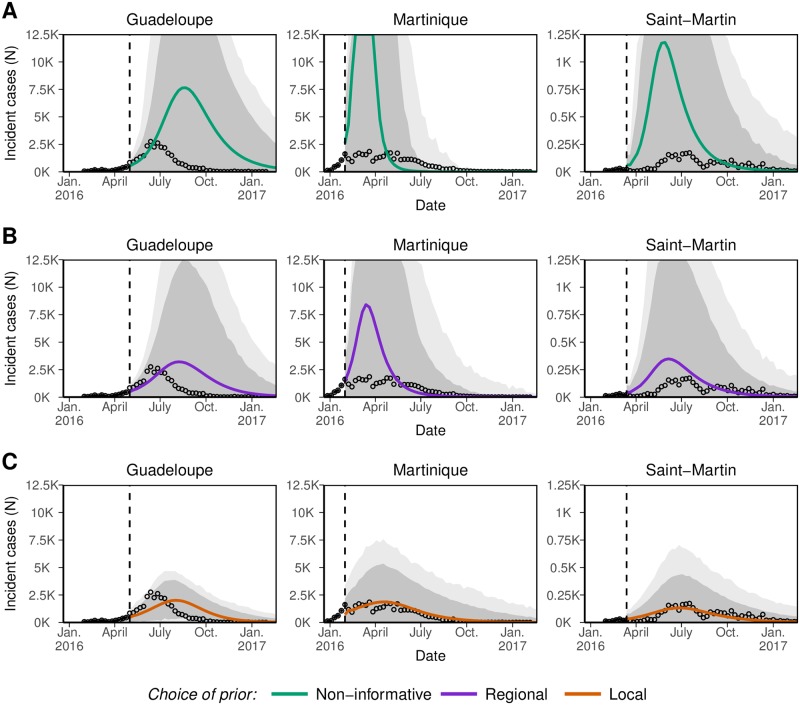
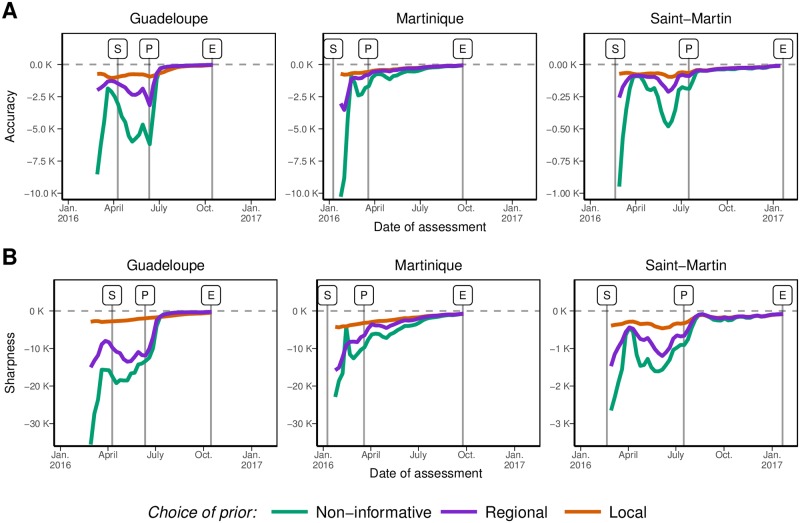
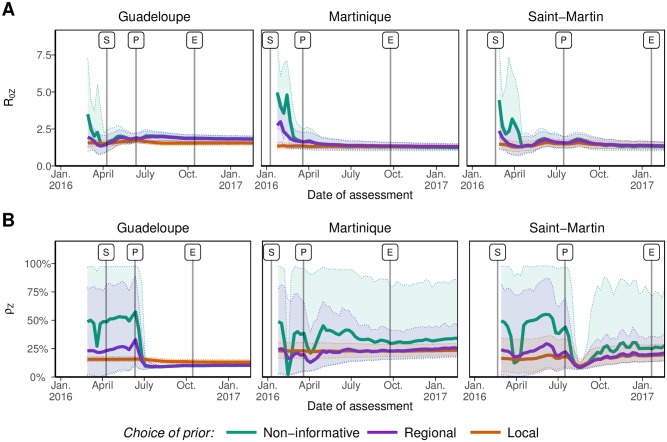
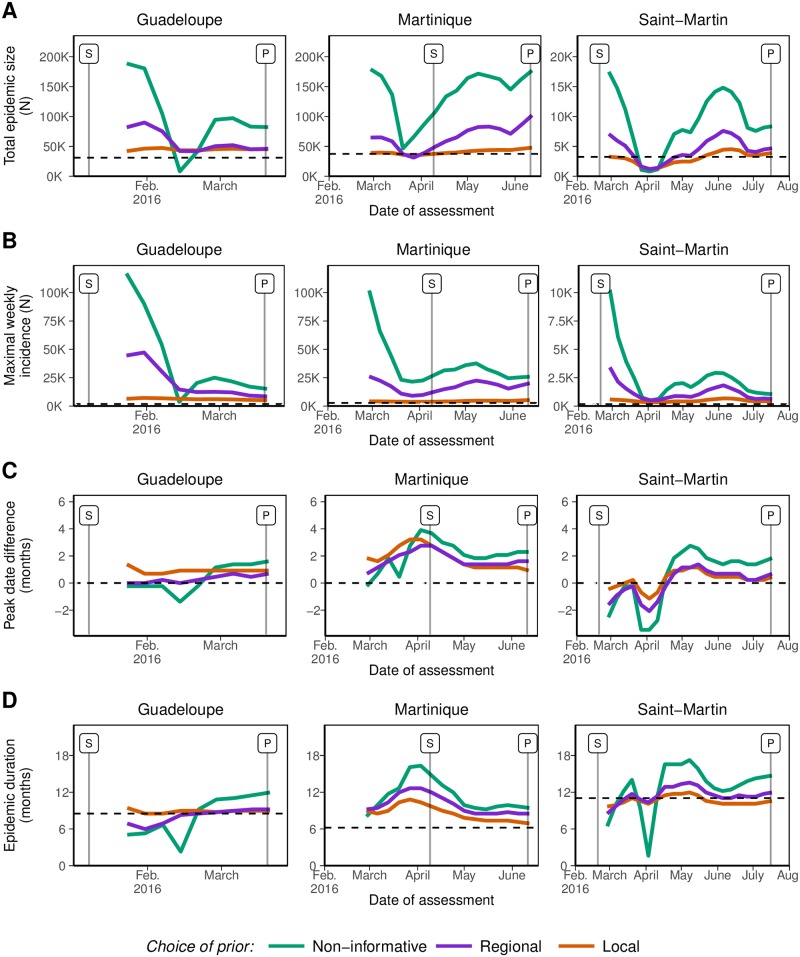
Model-based epidemiological assessment is useful to support decision-making at the beginning of an emerging Aedes-transmitted outbreak. However, early forecasts are generally unreliable as little information is available in the first few incidence data points. Here, we show how past Aedes-transmitted epidemics help improve these predictions. The approach was applied to the 2015-2017 Zika virus epidemics in three islands of the French West Indies, with historical data including other Aedes-transmitted diseases (chikungunya and Zika) in the same and other locations. Hierarchical models were used to build informative a priori distributions on the reproduction ratio and the reporting rates. The accuracy and sharpness of forecasts improved substantially when these a priori distributions were used in models for prediction. For example, early forecasts of final epidemic size obtained without historical information were 3.3 times too high on average (range: 0.2 to 5.8) with respect to the eventual size, but were far closer (1.1 times the real value on average, range: 0.4 to 1.5) using information on past CHIKV epidemics in the same places. Likewise, the 97.5% upper bound for maximal incidence was 15.3 times (range: 2.0 to 63.1) the actual peak incidence, and became much sharper at 2.4 times (range: 1.3 to 3.9) the actual peak incidence with informative a priori distributions. Improvements were more limited for the date of peak incidence and the total duration of the epidemic. The framework can adapt to all forecasting models at the early stages of emerging Aedes-transmitted outbreaks.
Conflict of interest statement
The authors have declared that no competing interests exist.
Figures
References
-
- Breban R, Riou J, Fontanet A. Interhuman transmissibility of Middle East respiratory syndrome coronavirus: estimation of pandemic risk. The Lancet. 2013;382(9893):694–699. doi: 10.1016/S0140-6736(13)61492-0 - DOI - PMC - PubMed
-
- Poletto C, Pelat C, Lévy-Bruhl D, Yazdanpanah Y, Boëlle P, Colizza V. Assessment of the Middle East respiratory syndrome coronavirus (MERS-CoV) epidemic in the Middle East and risk of international spread using a novel maximum likelihood analysis approach. Eurosurveillance. 2014;19(23):20824 doi: 10.2807/1560-7917.ES2014.19.23.20824 - DOI - PubMed
-
- Cauchemez S, Fraser C, Van Kerkhove MD, Donnelly CA, Riley S, Rambaut A, et al. Middle East respiratory syndrome coronavirus: quantification of the extent of the epidemic, surveillance biases, and transmissibility. The Lancet infectious diseases. 2014;14(1):50–56. doi: 10.1016/S1473-3099(13)70304-9 - DOI - PMC - PubMed
-
- WHO Ebola Response Team. Ebola virus disease in West Africa—the first 9 months of the epidemic and forward projections. N Engl J Med. 2014;371(16):1481–1495. doi: 10.1056/NEJMoa1411100 - DOI - PMC - PubMed
-
- Althaus CL. Estimating the reproduction number of Ebola virus (EBOV) during the 2014 outbreak in West Africa. PLoS currents. 2014;6 doi: 10.1371/currents.outbreaks.91afb5e0f279e7f29e7056095255b288 - DOI - PMC - PubMed
MeSH terms
LinkOut - more resources
Full Text Sources
Other Literature Sources
Medical
Miscellaneous
