. 2018 Sep;155(3):892-908.e6.
doi: 10.1053/j.gastro.2018.05.041. Epub 2018 Jun 2.

Cigarette Smoke Induces Stem Cell Features of Pancreatic Cancer Cells via PAF1

Affiliations

Cigarette Smoke Induces Stem Cell Features of Pancreatic Cancer Cells via PAF1

Rama Krishna Nimmakayala et al. Gastroenterology. 2018 Sep.

Abstract

Background & aims: Cigarette smoking is a major risk factor for pancreatic cancer. Aggressive pancreatic tumors contain cancer cells with stem cell features. We investigated whether cigarette smoke induces stem cell features in pancreatic cancer cells.

Methods: KrasG12D; Pdx1-Cre mice were exposed to cigarette smoke or clean air (controls) for up to 20 weeks; pancreata were collected and analyzed by histology, quantitative reverse transcription polymerase chain reaction, and confocal immunofluorescence microscopy. HPNE and Capan1 cells were exposed to cigarette smoke extract (CSE), nicotine and nicotine-derived carcinogens (NNN or NNK), or clean air (controls) for 80 days and evaluated for stem cell markers and features using flow cytometry-based autofluorescence, sphere formation, and immunoblot assays. Proteins were knocked down in cells with small interfering RNAs. We performed RNA sequencing analyses of CSE-exposed cells. We used chromatin immunoprecipitation assays to confirm the binding of FOS-like 1, AP-1 transcription factor subunit (FOSL1) to RNA polymerase II-associated factor (PAF1) promoter. We obtained pancreatic ductal adenocarcinoma (PDAC) and matched nontumor tissues (n = 15) and performed immunohistochemical analyses.

Results: Chronic exposure of HPNE and Capan1 cells to CSE caused them to increase markers of stem cells, including autofluorescence and sphere formation, compared with control cells. These cells increased expression of ABCG2, SOX9, and PAF1, via cholinergic receptor nicotinic alpha 7 subunit (CHRNA7) signaling to mitogen-activated protein kinase 1 and FOSL1. CSE-exposed pancreatic cells with knockdown of PAF1 did not show stem cell features. Exposure of cells to NNN and NNK led to increased expression of CHRNA7, FOSL1, and PAF1 along with stem cell features. Pancreata from KrasG12D; Pdx1-Cre mice exposed to cigarette smoke had increased levels of PAF1 mRNA and protein, compared with control mice, as well as increased expression of SOX9. Levels of PAF1 and FOSL1 were increased in PDAC tissues, especially those from smokers, compared with nontumor pancreatic tissue. CSE exposure increased expression of PHD-finger protein 5A, a pluripotent transcription factor and its interaction with PAF1.

Conclusions: Exposure to cigarette smoke activates stem cell features of pancreatic cells, via CHRNA7 signaling and FOSL1 activation of PAF1 expression. Levels of PAF1 are increased in pancreatic tumors of humans and mice with chronic cigarette smoke exposure.

Keywords: ERK; Nicotine Receptor Signaling; PHF5A; Pancreatic Carcinogenesis.


Conflict of interest statement

Conflicts of interest

The authors disclose no conflicts

Figures

Figure 1
Figure 1. Exposure to cigarette smoke increases pancreatic stemness
(A) HPNE and Capan1 cells were exposed to CSE (1%), commercial CSE (C-CSE) (20μg/ml) or to cigarette smoke components, Nicotine (2μM), NNK (2μM) and NNN (2μM) for 80 days (two days exposure per passage; thus, up to 40 passages). (B) Confocal imaging for AF in CSE-treated (CSE-T) cells compared to untreated controls. AF (Green) and nuclei were stained using DAPI (Blue) (n=4). Scale bars: 50μm. (C) Left: Flow cytometry analysis of AF content in CSE exposed cells at different treatment time points. AF cells were excited using a 488-nm blue laser and filters, 530/30 and 585/42 1 550LP Blue Det A-A. Right: Percentage of AF cells at different time points of CSE exposure as compared to respective time point controls. (n=3). (D) Quantitative reverse transcription polymerase chain reaction assays for stemness genes in AF− and AF+ population sorted from CSE exposed cells. Data shown are normalized with β-actin expression. (n=3). (E) Left: Flow cytometry analysis for ABCG2+ and CD44High population in AF− and AF+ cells. CSE exposed cells were subjected to immunophenotyping using anti-ABCG2-APC or anti-CD44-APC antibody. AF+ and AF− population were selected and analyzed for ABCG2 or CD44 positivity using flow cytometer. Right: Percentage of ABCG2+ and CD44High population in selected AF− and AF+ population of CSE exposed cells. (n=3). (B–E) Data represent mean ± SD (p values were calculated by Student’s t test). *p < 0.05, **p < 0.01 ***p < 0.001. DAPI, 4′,6-diamidino-2-phenylindole.
Figure 2
Figure 2. Cigarette smoke exposure augments pancreatic stemness in vitro
(A) Sphere formation assays performed on CSE exposed and unexposed HPNE and Capan1 cells. 2000 cells/well were seeded in 96 well ultra-low attachment plates in stem cell medium. Left: Morphology of 10-day old spheres. Scale bar: 200μm. Right: Number of spheres per 2000 cells at different time points of CSE exposure as compared to respective time point controls. Data represent mean ± SD (n=6). (p values were calculated by Student’s t test). *p < 0.05, ***p < 0.001. (B) Confocal imaging. Spheres were immunostained for Oct3/4. Confocal images were captured for Oct3/4 (red staining), AF (green staining) and DAPI (blue staining for nuclei). Scale bar: 100μm. (C) Immunoblotting assays for stemness or cancer stemness markers in untreated and CSE treated HPNE and Capan1 cells. β-actin was used as a loading control. (D) Immunofluorescence staining on chronically CSE exposed and unexposed cells for stemness markers, ABCG2, SOX9 and PAF1. Nuclei were stained in blue (DAPI) and red staining indicates ABCG2, SOX9 and PAF1 expression. Scale bar: 100μm. (E) Quantitative reverse transcription polymerase chain reaction assay on CSE exposed and unexposed HPNE and Capan1 cells for PAF1 and SOX9 genes. Data shown are normalized for β-actin expression. Data represent mean ± SD (n=3). (p values were calculated by Student’s t test). *p < 0.05, **p < 0.01 ***p < 0.001. DAPI, 4′,6-diamidino-2-phenylindole.
Figure 3
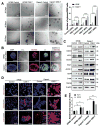
Figure 3. Cigarette smoke exposure induces PAF1 in vivo
(A) Ten-week-old control and KrasG12D Pdx-Cre mice were exposed to cigarette smoke for 20 weeks (3hrs; twice a day) using Teague TE-10C system. Filtered air was used to expose control animals. (B) Immunohistochemistry staining of PAF1 protein in pancreatic tissues obtained from cigarette smoke-exposed (CS-T) control and KrasG12D Pdx-Cre mice. Scale bars, 100μm. (C) Histo score (H-Score) of PAF1 protein expression. Data represent mean ± SD (n=6). (p values were calculated by Student’s t test). **p < 0.01. (D) Quantitative reverse transcription polymerase chain reaction assay on pancreatic tissues obtained from cigarette smoke exposed control and KrasG12D Pdx-Cre mice for PAF1. Data shown are normalized for β-actin expression. Data represent mean ± SD (n=3). (p values were calculated by Student’s t test). *p < 0.05, **p < 0.01. (E) Immunofluorescence staining for PAF1 (Green) and CD44 in cigarette smoke-exposed pancreatic tissues. Scale bar: 50μm. (F) Confocal images of pancreatic tissues obtained from cigarette smoke exposed mice showing the AF (Green) and localization of Nile red (lipid droplet staining). Scale bar: 50μm. Enlarged boxed image shows the absence of co-localization of AF with Nile red (Lipofuscin) (G) Confocal images of pancreatic tissue collected from cigarette smoke exposed floxed mice showing the co-localization of PAF1 with ABCG2 and AF (Green). Arrowheads point to co-localization of PAF1, ABCG2 and AF. Enlarged boxed image shows the co-localization. Scale bar: 50μm. (E–G) Nuclei were stained with DAPI, 4′,6-diamidino-2-phenylindole.
Figure 4
Figure 4. Smoking-mediated induction of pancreatic stemness is regulated by PAF1
(A) Immunoblotting assay for PAF1, SOX9 and β-catenin in PAF1 KD HPNE and PAF1 CRISPR/Cas9 KO Capan1 cells. (B) Flow cytometry analysis of AF cells in CSE exposed HPNE and Capan1 cells transfected with PAF1 siRNA and control siRNA. (C) Percentage of AF cells in scramble control and PAF1 KD CSE exposed cells. Data represent mean ± SD (n=3). (p values were calculated by Student’s t test). *p < 0.05, **p < 0.01. (D and E) Flow cytometry analysis for ABCG2+ population in scramble control and PAF1 KD CSE exposed HPNE and Capan1 cells. (F) Percentage of ABCG2+ population in scramble control and PAF1 KD CSE exposed cells. (n=3). Data represent mean ± SD (n=3). (p values were calculated by Student’s t test). **p < 0.01.
Figure 5
Figure 5. Smoking induces PAF1 through the nACHRα7-ERK1/2-FOSL1/cJun (AP1) signaling pathway
(A) Small interfering RNA (siRNA) knockdown of FOSL1. Western blot analysis showing FOSL1 knockdown and its effect on PAF1 in CSE-treated and untreated HPNE and Capan1 cells. GAPDH was used as loading control. (B) Chromatin immunoprecipitation (ChIP) assays were performed using chromatin from CSE exposed cells and the control IgG or phospho-FOSL1 antibodies. Phospho-FOSL1 enriched DNA was used in PCR assay using primers specific to FOSL1 or AP1 binding sites (see Supplementary Figure 8) on the promoter region of PAF1 gene. Chip DNA PCR product was resolved on 2% agarose gel, and the DNA bands for BS1-9 were shown. (C) Left: Representative images of immunohistochemistry for FOSL1 in pancreatic tissues obtained from cigarette smoke-exposed control and KrasG12D Pdx-Cre mice. Scale bar, 100 μm. Middle: Immunofluorescence staining for PAF1 (stained in red) and p-FOSL1 (stained in green) in cigarette smoke exposed control and KrasG12D Pdx-Cre tissues (Nuclei were stained with DAPI). Scale bar, 50 μm. Right: Bar chart represents the H score of FOSL1 staining. Data represent mean ± SD (n=6). (p values were calculated by Student’s t test). *p < 0.05, **p < 0.01. (D) Left: Immunohistochemical staining for FOSL1 and PAF1 in human PDAC tissues (with and without smoking history) and in normal pancreas. Scale bar, 100 μm. Right: Confocal images showing the co-expression of FOSL1 (stained in red) and PAF1 (stained in green) in these tissues. Scale bar, 100 μm. Nuclei were stained in blue using DAPI. Bar charts below show quantification of FOSL1 and PAF1 staining in normal pancreas (n=15), PDAC without (n=15) and with (n=15) smoking history. Data represent mean ± SD. (p values were calculated by Student’s t test). ***p < 0.001. (E) Immunoblotting assays for CHRNA7, p-ERK1/2, ERK1/2, p-FOSL1, FOSL1, p-cJun and cJun signaling molecules in CSE-treated cells as compared to untreated controls. (F) Immunoblotting assays for p-ERK1/2, ERK1/2, p-FOSL1, FOSL1, PAF1 in CSE exposed HPNE and Capan1 cells with or without ERK1/2 inhibition using PD98059. (G) Small interfering RNA (siRNA) knock down of nACHRα7 in CSE treated cells. Western blot analysis showing the effect of nACHRα7 knockdown on p-FOSL1 and PAF1. (E–G) β-actin was used as loading control. DAPI, 4′,6-diamidino-2-phenylindole; GAPDH, glyceraldehyde 3-phosphate dehydrogenase.
Figure 6
Figure 6. Cigarette smoke components, Nicotine, NNN, and NNK are highly responsible for augmentation of pancreatic stemness
HPNE and Capan1 cells were left untreated or treated with Nicotine (2μM), NNK (2μM) and NNN (2μM) for 80 days. (A) Left: Flow cytometry analysis of AF content. Right: Percentage of AF+ population in HPNE and Capan1 cells exposed to cigarette smoke components as compared to respective controls. Data represent mean ± SD (n=3) (p values were calculated by Student’s t test). *p < 0.05, **p < 0.01. (B) Sphere formation assay was performed on HPNE and Capan1 cells exposed to cigarette smoke components. 2000 cells/well were seeded in 96 well ultra-low attachment plates in stem cell medium. Left: Morphology of 10-day old spheres. Scale bar: 200μm. Right: Number of spheres per 2000 cells in HPNE and Capan1 cells exposed to cigarette smoke components as compared to untreated controls. Data represent mean ± SD (n=6). (p values were calculated by Student’s t test). ***p < 0.001. (C–D) Immunoblotting assay for CHRNA7, p-FOSL1, PAF1, KLF4 and SOX9. β-actin was used as loading control.
Figure 7
Figure 7. Cigarette smoke exposure increases PHF5A and augments interaction between PAF1 and PHF5A
(A) HPNE and Capan1 cells were left untreated or treated with CSE (1%) for 80 days. Immunoblot analysis showing the protein expression levels of PAF1 complex (PAF1C) molecules along with serine 2 phosphorylated RNA polymerase II (S2-Phos RNA Pol II) and PHF5A. β-actin was used as loading control. (B) Left: Representative images of IHC for PHF5A in pancreatic tissues obtained from 20 weeks cigarette smoke-exposed control and KrasG12D Pdx-Cre mice. Scale bar, 100 μm. Right: Immunofluorescence staining for PAF1 (stained in red) and PHF5A (stained in green) in pancreas of cigarette smoke-exposed control and KrasG12D Pdx-Cre mice models (Nuclei were stained with DAPI). Scale bar, 50 μm. Bar chart below (C) represents the H score of PHF5A staining in the pancreas of cigarette smoke exposed mice. Data represent mean ± SD (n=6). (p values were calculated by Student’s t test). *p < 0.05, **p < 0.01. (D) Immunofluorescence staining for PAF1 and PHF5A on HPNE and Capan1 cells exposed to CSE. Co-expression of PAF1 with PHF5A was shown. Nuclei were stained with DAPI. (E) Immunoblots showing that PAF1 interacts with PHF5A in untreated and CSE treated HPNE and Capan1 cells. Pull down was performed using PAF1 antibody, and immunoprecipitates were probed with PHF5A antibody. IgG control and input, 10% of total lysate, were used as negative and positive controls, respectively. (F) Schematic showing overall mechanism involved in the cigarette smoke mediated induction of pancreatic stemness. Exposure of human pancreatic ductal cells and cancer cells to cigarette smoke and its components increases induce stemness by increasing PAF1 through CHRNA7-ERK1/2-AP1 (FOSL1-cJUN) signaling pathway. Cigarette smoke induced PAF1 and PHF5A interacts and form PAF1-PHF5A complex, required for the activation of stemness or cancer stemness genes.

References

    1. Kuroczycki-Saniutycz S, Grzeszczuk A, Zwierz ZW, et al. Prevention of pancreatic cancer. Contemp Oncol (Pozn) 2017;21:30–4. - PMC - PubMed
    1. Momi N, Ponnusamy MP, Kaur S, et al. Nicotine/cigarette smoke promotes metastasis of pancreatic cancer through alpha7nAChR-mediated MUC4 upregulation. Oncogene. 2013;32:1384–95. - PMC - PubMed
    1. Xue J, Yang S, Seng S. Mechanisms of Cancer Induction by Tobacco-Specific NNK and NNN. Cancers (Basel) 2014;6:1138–56. - PMC - PubMed
    1. Melkamu T, Qian X, Upadhyaya P, et al. Lipopolysaccharide enhances mouse lung tumorigenesis: A model for inflammation-driven lung cancer. Vet Pathol. 2013;50:895–902. - PMC - PubMed
    1. Pauly JL, Paszkiewicz G. Cigarette Smoke, Bacteria, Mold, Microbial Toxins, and Chronic Lung Inflammation. Journal of Oncology. 2011;2011 - PMC - PubMed

Publication types

MeSH terms

Substances