Review
. 2018 Jul:292:155-170.
doi: 10.1016/j.jmr.2018.05.005.

Quantitative imaging of brain energy metabolisms and neuroenergetics using in vivo X-nuclear 2H, 17O and 31P MRS at ultra-high field

Affiliations
Review

Quantitative imaging of brain energy metabolisms and neuroenergetics using in vivo X-nuclear 2H, 17O and 31P MRS at ultra-high field

Xiao-Hong Zhu et al. J Magn Reson. 2018 Jul.

Abstract

Brain energy metabolism relies predominantly on glucose and oxygen utilization to generate biochemical energy in the form of adenosine triphosphate (ATP). ATP is essential for maintaining basal electrophysiological activities in a resting brain and supporting evoked neuronal activity under an activated state. Studying complex neuroenergetic processes in the brain requires sophisticated neuroimaging techniques enabling noninvasive and quantitative assessment of cerebral energy metabolisms and quantification of metabolic rates. Recent state-of-the-art in vivo X-nuclear MRS techniques, including 2H, 17O and 31P MRS have shown promise, especially at ultra-high fields, in the quest for understanding neuroenergetics and brain function using preclinical models and in human subjects under healthy and diseased conditions.

Keywords: Brain energy metabolism; Cerebral metabolic rate of glucose (CMR(Glc)) and oxygen (CMRO(2)) consumption, and ATP production (CMR(ATP)); In vivo X-nuclear MRS and imaging; NAD redox state; Neuroenergetics; TCA cycle rate (V(TCA)); Ultra-high magnetic field (UHF).


Figures

Fig. 1
Fig. 1
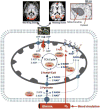
Schematic diagram of major energy metabolism pathways and hemodynamics occurring in the capillary, sub-cellular compartments including mitochondria and cytosol, that are essential for brain function under a resting or working state and can be assessed using the in vivo X-nuclear MRS imaging methods as reviewed in this article. Oxygen and glucose supplied from feeding arteries and blood circulation in the capillary can diffuse (for oxygen) or transport (for glucose) into brain cells. Glucose is first converted to two pyruvates; most pyruvate molecules enter mitochondria and are metabolized oxidatively. The oxygen utilization is, in general, coupled with the ATP production via the oxidative phosphorylation of ADP in the mitochondria. The produced ATP is transported to cytosol for supporting electrophysiological activities and brain functions at resting or activated brain state as demonstrated by the functional MRI (fMRI) map of visual stimulation or resting-state fMRI connectivity map in top panels. The energy metabolic pathways are tightly associated with the NAD redox reactions which are essential for regulating brain energy generation and utilization. The metabolic activities associated with different pathways can be quantitatively determined by the cerebral metabolic rates of CMRGlc, CMRO2, CMRATP, TCA cycle rate (VTAC) and NAD redox ratio (RXNAD) and noninvasively measured using the advanced in vivo X-nuclear MRS approaches as depicted in the shadowed texts with orange background. CI - CV represent five enzyme complexes involving the respiration chain reactions in the mitochondria.
Fig. 2
Fig. 2
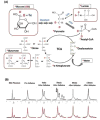
(A) Field dependence of the in vivo 17O signal of brain tissue water. (B) Typical in vivo 31P MR spectra acquired from the human and cat visual cortex at varied magnetic field strength (B0) ranging from 4T to 16.4T. The spectrum at ultrahigh field is characterized by excellent spectral resolution and sensitivity, and a large number of well-resolved resonances including phosphoethanolamine (PE); phosphocholine (PC); inorganic phosphate (Pi); glycerophosphoethanolamine (GPE); glycerophosphocholine (GPC); phosphocreatine (PCr); adenosine triphosphate (ATP); and nicotinamide adenine dinucleotides (NAD).
Fig. 3
Fig. 3
(A) The 2H-isotrope labeling (in red) scheme through the brain glucose metabolisms for in vivo dynamic 2H MRS measurement of cerebral glucose metabolisms using D-Glucose-6,6-d2 (d66) as an isotopic substrate. Labeling firstly incorporates into the pyruvate pool to form [3,3-d2] pyruvate through glycolysis, which is then converted to [3,3-d2] lactate catalyzed by lactate dehydrogenase (LDH). [3,3-d2] Pyruvate transports into mitochondria and transforms into [2,2-d2] Acetyl-CoA via pyruvate decarboxylation by pyruvate dehydrogenase (PDH). By entering the TCA cycle, intermediates of [4-d] or [4,4-d2] citrate and [4-d] or [4,4-d2] α-ketoglutarate will be produced, which could exchange with glutamate to generate [4-d] or [4,4-d2] glutamate. During the following steps in TCA cycle, 2H-labeling may depart from the cycle and exchange with the proton(s) in water molecule to become deuterated water. ‘*’: Pools labeled with 2H; outlined boxes: metabolite pools to be detected by in vivo 2H MRS. (B) Representative original (black trace in upper row and grey trace in bottom row) and fitted (red trace in bottom row) 2H spectra obtained from deuterated glucose (d66) phantom solution (left column), pre- (second left column) and post-deuterated glucose (d66) infusion at different time. The dynamic change of 2H-labeled signals can be used to perform the kinetic analysis and determine the values of CMRGlc and VTCA. 2H resonance assignments: 1) water (4.8 ppm, set as a chemical shift reference and same as the in vivo 1H MRS); 2) glucose (3.8 ppm); 3) Glx (mixed glutamate and glutamine at 2.4 ppm); and 4) lactate (1.4 ppm). Adapted from the reference of Lu et. al. [25].
Fig. 4
Fig. 4
(A) Simplified kinetic modeling for dynamic 2H MRS quantification. Symbols: Glc (glucose); Gly (glycogen); L (combined pool for Pyr (pyruvate) and Lac (lactate)); K (α-KG, α-ketoglutarate); Glx (combined pool for Glu (glutamate) and Gln (glutamine)). Vx stands for the α-KG/Glx exchange rate. Vy is the glycogen synthetic rate. Vout represents an efflux of lactate. ‘*’: 2H-labeled metabolites. Dynamic changes, time courses and model fitting of deuterated brain glucose (d66) and labeled Glx concentrations during sequential 2H MRS acquisitions (15 s temporal resolution) in two representative rat brains under (B) 2% isoflurane (deep) anesthesia and (C) constant morphine sulfate infusion, respectively. Solid lines are the model fittings of labeled glucose (red) and Glx (black) signal changes which are highly sensitive to the brain state. Adapted from the reference of Lu et. al. [25].
Fig. 5
Fig. 5
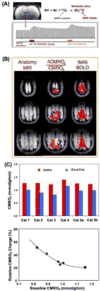
(A) Demonstration of single voxel time course of rat brain H217O signal and change taken from three-dimensional (3D) in vivo 17O MRSI measured before, during and after two inhalations of 17O2 for repeated CMRO2 and CBF imaging measurements. Adapted from the reference of Zhu et. al. [53]. (B) 3D functional CMRO2 activation maps (middle column) obtained from cat visual cortex showing relative increases of CMRO2 elevated by visual stimulation from a representative animal. The corresponding fMRI BOLD maps and anatomic brain images are also shown in the right and left column, respectively. (C) Summary (top panel) of baseline and activated CMRO2 in the visual cortex from five cats (repeated two studies from Cat 5), and the dependence between the baseline CMRO2 level and evoked CMRO2 percent change, indicating a negative correlation. Adapted from the reference of Zhu et. al. [54].
Fig. 6
Fig. 6. In vivo
17O MRS imaging demonstration from one representative MCAO ischemic mouse, showing multiple images of CMRO2, CBF and OEF from a selected brain slice. The images clearly demonstrate significant reductions of CMRO2 and CBF in the brain region (cycled) impaired by MCAO as compared to the intact brain tissue in the contralateral hemisphere; in contrast, OEF was increased in the MCAO affected brain region. Adapted from the reference of Zhu et. al. [50].
Fig. 7
Fig. 7
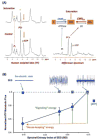
(A) In vivo 31P spectra (left panels) acquired from a healthy human occipital lobe in the absence (control) and presence of γ-ATP resonance saturation, and the difference spectrum (right panel). The intensity reduction in Pi and PCr resonance can be used to calculate the value of CMRATP and CMRCK, respectively. Adapted from the reference of Lei et. al. [8]. (B) Correlation of the rat brain EEG activity level (top tracers) versus normalized CMRATP and cerebral ATP concentration measured under varied brain states using different anesthetics and/or doses. The EEG signal was quantified by the spectral entropy index (SEI). It shows a strong and positive correlation between the EEG amplitude and CMRATP while maintaining the ATP homeostasis across a wide range of neurophysiology condition. Adapted from the reference of Du et. al. [5].
Fig. 8
Fig. 8
(A) Photo of 31P-1H dual-frequency transverse electromagnetic (TEM) RF head coil allowing concurrent acquisition of brain anatomic images for performing tissue segmentation (B), resulting in separated GM, WM and CSF images, and the in vivo 31P MRS-MT in the presence (C) and absence (D) of γ-ATP resonance saturation, or 3D 31P MRS-MT imaging in the presence (E) and absence (F) of γ-ATP resonance saturation (only PCr and γ-ATP resonances are displayed). These images can be employed to calculate and map CMRATP and CMRCK across the entire human brain and differentiate them between GM and WM. Adapted from the reference of Zhu et. al. [11].
Fig. 9
Fig. 9
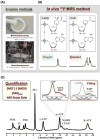
(A) Demonstration of two traditional approaches for assessment of cellular NAD metabolites based on biochemical assay (top) or auto-fluorescence technique. (B) Distinct molecular structures of NAD+ and NADH and their 31P spectral patterns (singlet resonance for NADH and quartet resonances for NAD+). The spectral pattern of the NAD+ quartet resonances depends on the field strength. (C) In vivo 31P spectrum collected from a healthy subject occipital lobe. The inserts display the expanded spectra in the chemical shift range of −9.0 to −11.5 ppm with the original in vivo 31P signals (in gray color) and the total signals (red trace) of α-ATP and NAD determined by the model fitting (center panel). The individual fitting components of α-ATP (blue), NAD+ (black) and NADH (green) for quantification are also showed (right panel). Adapted from the reference of Zhu et. al. [14].
Fig. 10
Fig. 10
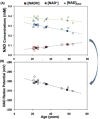
Age dependence of intracellular NAD+, NADH, total NAD concentrations (A) and NAD+/NADH redox potential (B) observed in healthy human occipital lobe. The open symbols represent individual subject data and the filled symbols display the average data from three age groups of young (21-26yr, n=7), middle (33-36yr, n=4) and old (59-68yr, n=6) subjects. Adapted from the reference of Zhu et. al. [14].

Similar articles

Cited by

References

    1. Siesjo BK. Brain energy metabolism. Wiley; New York: 1978.
    1. Shulman RG, Rothman DL, Behar KL, Hyder F. Energetic basis of brain activity: implications for neuroimaging. Trends Neurosci. 2004;27:489–495. - PubMed
    1. Zhu XH, Du F, Zhang N, Lu M, Zhang Y, Liu X, Lei H, Zhang XL, Ugurbil K, Chen W. Study of Brain Bioenergetics and Function using In Vivo MRS. In: Kamil Ugurbil KU, Berliner Lawrence, editors. Biological magnetic Resonance: fMRI: From Nuclear Spins to Brain Function. Springer; New York: 2015. pp. 819–864.
    1. Hyder F, Patel AB, Gjedde A, Rothman DL, Behar KL, Shulman RG. Neuronal-glial glucose oxidation and glutamatergic-GABAergic function. J Cereb Blood Flow Metab. 2006;26:865–877. - PubMed
    1. Du F, Zhu XH, Zhang Y, Friedman M, Zhang N, Ugurbil K, Chen W. Tightly coupled brain activity and cerebral ATP metabolic rate. Proc Natl Acad Sci U S A. 2008;105:6409–6414. - PMC - PubMed

Publication types