Live imaging of wound angiogenesis reveals macrophage orchestrated vessel sprouting and regression
- PMID: 29866703
- PMCID: PMC6028026
- DOI: 10.15252/embj.201797786
Live imaging of wound angiogenesis reveals macrophage orchestrated vessel sprouting and regression
Abstract
Wound angiogenesis is an integral part of tissue repair and is impaired in many pathologies of healing. Here, we investigate the cellular interactions between innate immune cells and endothelial cells at wounds that drive neoangiogenic sprouting in real time and in vivo Our studies in mouse and zebrafish wounds indicate that macrophages are drawn to wound blood vessels soon after injury and are intimately associated throughout the repair process and that macrophage ablation results in impaired neoangiogenesis. Macrophages also positively influence wound angiogenesis by driving resolution of anti-angiogenic wound neutrophils. Experimental manipulation of the wound environment to specifically alter macrophage activation state dramatically influences subsequent blood vessel sprouting, with premature dampening of tumour necrosis factor-α expression leading to impaired neoangiogenesis. Complementary human tissue culture studies indicate that inflammatory macrophages associate with endothelial cells and are sufficient to drive vessel sprouting via vascular endothelial growth factor signalling. Subsequently, macrophages also play a role in blood vessel regression during the resolution phase of wound repair, and their absence, or shifted activation state, impairs appropriate vessel clearance.
Keywords: angiogenesis; inflammation; macrophages; neutrophils; wound.
© 2018 The Authors. Published under the terms of the CC BY 4.0 license.
Figures
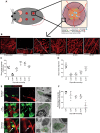
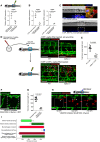
En face schematic illustration of a mouse wound, showing macrophage–blood vessel sprouts entering a full‐thickness skin wound in relation to the overlying scab and associated inflammatory cells during wound healing.
Representative multiphoton projection images of mouse wounds stained for endothelial cells (CD31) over the full duration of blood vessel infiltration and resolution.
Quantification of total wound area occupied by blood vessels, based on pixel count (see Materials and Methods) and measured from time course represented in (B). Extent of wound vasculature increases to a maximum attained at 7 DPI, after which wound vasculature resolves towards uninjured levels by 14 DPI. N = 6 independent mice per timepoint.
Quantification of blood vessel alignment, based on pixel orientation (see Materials and Methods) and measured from time course represented in (B). Vessels begin to restore their coherence and orientation by 14 DPI. N = 6 independent mice per timepoint.
Representative multiphoton projection images of wound tissue co‐stained for endothelial cells (CD31, red) and macrophages (CD68, green), showing stereotypical association of macrophages with blood vessel sprouts during vessel infiltration into wound site and their subsequent regression from the wound. Asterisks indicate macrophage–sprout interaction; arrows indicate phagocytosed vessel material within macrophages. These are matched with representative images of electron micrographs showing macrophage–endothelial cell interactions, taken at corresponding timepoints post‐wounding. Macrophages are false coloured in green, with phagocytosed material in red.
Quantification of blood vessel tip–macrophage association during the repair time course of the repair process, measured from the time course represented in (E). N = 5 independent mice per timepoint.

Expanded view of clearance stage image shown in Fig 1E (indicated by boxed area), demonstrating that some macrophages contain CD31‐stained endothelial cell material (arrows), while others do not (arrowheads).
Representative confocal projection images of frozen sections taken from 10 DPI mouse wounds stained for blood vessels (VE‐Cadherin) and macrophages (CD68), which complement our CD31 stained whole mouse wounds, to further demonstrate endothelial cell matter within macrophages. N = 4 independent mice.
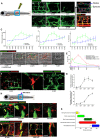
Lateral schematic of the larger, 30‐gauge needle‐stick fish wounds made to the flank of larval zebrafish at 4 days post‐fertilisation (DPF).
Representative confocal projection images of a wounded Tg(fli:GFP) zebrafish, showing the typical time course of blood vessel infiltration over 10 days post‐injury following needle‐stick injury as per (A). Boxed area denotes site of wounding. The Angioanalyser node/sprout quantification (see Materials and Methods) is generated for the entire area of interest and is visually indicated via the output from processing the 6 DPI image, showing nodes as red circles and sprouts as green lines. Representative confocal projection of a wounded Tg(dll4:GFP); Tg(kdrl: mCherry‐CAAX) zebrafish, showing veins (red) and arteries (yellow), demonstrating a contribution to wound vasculature from both lineages with formation of chimeric vessels at the wound site.
Graphical representation of total vessel length, number of nodes and sprouts throughout the period of needle‐stick wound repair as represented in (B), plotted against vessel measurements from uninjured fish. N = 12 independent fish per timepoint per condition (unwounded versus wounded).
Representative confocal projection images of Tg(mpeg:mCherry); Tg(mpx:GFP) transgenic zebrafish, showing time course of macrophage (red) and neutrophil (green) migration to needle‐stick wounds as per (A), 0‐7 DPI. Boxed area denotes site of wounding.
Quantification of macrophage and neutrophil numbers at the wound site versus uninjured tissue, measured from time course represented in (D). N = 12 independent fish per timepoint, per condition.
Representative confocal projection image of Tg(fli:GFP); Tg(mpeg:mCherry) or Tg(fli:GFP); Tg(mpx:GFP) transgenic zebrafish at 3 DPI, showing typical immune cell–blood vessel sprout interactions following needle‐stick injury. Boxed area denotes site of immune cell–endothelial cell interaction.
Quantification of macrophage–blood vessel sprout association throughout early stages of repair, measured from time course represented in (F). N = 16 independent fish per timepoint.
Lateral schematic of smaller microlaser wound, performed on 4 DPF zebrafish.
Representative confocal projection images taken from timelapse movies of a laser injured Tg(fli:GFP); Tg(mpx:GFP); Tg(mpeg:mCherry) transgenic zebrafish, 4 DPF, imaged at 30–930 MPI. Neutrophils appear at the wound site early and transiently; macrophages appear at approximately the same time as blood vessel sprouting commences and remain associated with the repairing blood vessels throughout sprouting and anastomosis. Boxed area denotes wound site.
Representative confocal projection images taken of laser wounded Tg(fli:GFP) transgenic zebrafish injected with high molecular weight dextran (red) immediately before imaging. This “angiography” technique reveals how wound blood vessels are initially leaky, but that patency is restored once the vessel is repaired and lumenised. Boxed area denotes wound site. N = 12 independent fish per timepoint.
Graphical temporal representation of common cellular interaction events, measured from movies represented in (I). N = 7 independent fish.
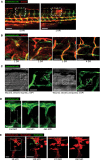
Representative fluorescent stereomicroscope images taken from 30‐gauge needle‐stick wounded Tg(fli:GFP) zebrafish. High molecular weight dextran was loaded one hour prior to injury, with images taken immediately after and one hour after injury, showing leakage of dextran (red) into the wound site upon vessel damage. N = 12 independent fish.
Confocal projection images of a representative 30‐gauge needle wounded Tg(fli:GFP) zebrafish, loaded with dextran one hour prior to imaging, showing the typical time course of blood vessel leakiness over 4 DPI following needle‐stick injury as per (A). Vessels typically cease leaking dextran by 4 DPI. N = 12 independent fish per timepoint.
Confocal projection images of a representative fine tungsten needle wounded Tg(fli:GFP) zebrafish, with damage induced to an existing vessel or between existing vessels. DIC images are provided as a guide to injury positioning. N = 8 independent fish per condition.
Representative confocal projection images taken from timelapse movies of a laser injured Tg(fli:GFP); Tg(mpx:GFP) zebrafish, 4 DPF, imaged at 150–465 MPI, showing the dynamic nature of vessel tip extensions. N = 10 independent fish.
Representative confocal projection images taken from timelapse movies of a laser injured Tg(kdrl:mCherry‐CAAX); Tg(mpx:GFP); Tg(mpeg:mCherry) transgenic zebrafish, 4 DPF, imaged at 30–420 MPI (Movie EV5), to complement our dynamic studies of neutrophils and macrophages observed in Movie EV2. N = 5 independent fish.
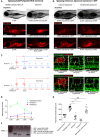
Representative fluorescent stereomicroscope images taken from Tg(mpeg:KalTA4); Tg(UAS:nfsB‐mCherry) transgenic zebrafish, either treated with control DMSO or metronidazole as indicated. Metronidazole treatment resulted in > 90% macrophage ablation using this genetic model. N = 10 independent fish per condition.
Representative fluorescent stereomicroscope images taken from Tg(mpeg:mCherry) transgenic zebrafish, injected with either control liposomes or clodronate liposomes, showing similar levels of macrophage ablation to metronidazole treatment. N = 10 independent fish per condition.
Two metronidazole treatment protocols were used to ablate macrophages prior to injury, or throughout injury. Wounded Tg(mpeg:KalTA4); Tg(UAS:nfsB‐mCherry); Tg(fli:GFP) transgenic zebrafish larvae were treated with DMSO (control) or metronidazole as indicated. Boxed area denotes wound site.
Quantification of number of macrophages at the wound site of DMSO‐treated control fish versus fish treated under the two ablation protocols, measured from images represented in (C) and Fig 2. Under protocol 1, fish recovered into fresh water post‐injury saw a partial rescue of macrophage numbers at the wound site by 4 DPF. N = 12 independent fish per condition per timepoint.
Quantification of total blood vessel length, measured from images represented in (C), using Angioanalyser. Under protocol 1, fish with partially rescued macrophages also showed a trend towards increased wound angiogenesis compared to full macrophage ablation. Treatment of Tg(fli:GFP) transgenic zebrafish with metronidazole showed no difference in extent of wound angiogenesis compared to untreated injury. N = 12 independent fish per condition per timepoint. Statistical significance, as determined by one‐way ANOVA, is P ≤ 0.0001. Subsequent Bonferonni multiple comparison test, determines level of significance, as indicated. Significance values: ***P ≤ 0.0001.
1% agarose gel, showing that both mflt1 and sflt1 products are present in whole zebrafish cDNA, but only sflt1 cDNA is present in FAC‐sorted Tg(mpx:GFP) neutrophils in early zebrafish wounds, as outlined in Fig 3F.
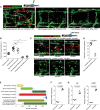
Representative confocal projection images of needle‐stick injured Tg(fli:GFP); Tg(mpeg:mCherry) or Tg(fli:GFP); Tg(mpeg:KalTA4); Tg(UAS:nfsB‐mCherry) zebrafish in combination with various treatments (as indicated), for ablating macrophages (red) during the peak stage of vessel (green) sprouting (4 DPI). Boxed area denotes wound site. In control (DMSO vehicle) and metronidazole‐treated fish lacking nitroreductase expressing macrophages, a normal inflammatory response and wound angiogenesis is observed. Upon ablation of macrophages using the nitroreductase–metronidazole system, wound angiogenesis is almost completely blocked. The same is true when macrophages are ablated using clodronate liposome injections.
Quantification of total blood vessel length in the presence/absence of macrophages at the wound site, measured from images represented in (A), using Angioanalyser. N = 16 independent fish per condition. Statistical significance, as determined by one‐way ANOVA, is P ≤ 0.0001. Subsequent Bonferroni multiple comparison test, determines level of significance, as indicated. Significance values: ***P ≤ 0.0001.
Images taken from timelapse movies of 4 DPF laser wounded Tg(fli:GFP); Tg(mpx:GFP); Tg(mpeg:mCherry) control or Tg(fli:GFP); Tg(mpx:GFP); Tg(mpeg:KalTA4); Tg(UAS:nfsB‐mCherry) macrophage ablation transgenic zebrafish, treated with metronidazole and imaged 30–930 min post‐injury (MPI). Boxed area denotes wound site. Arrowheads indicate position of damaged, sprouting vessel tips.
Quantification of proportion of vessel repaired within 930 MPI, measured from movies represented in (C). N = 8 independent fish per condition. Statistical significance is indicated, as determined by two‐tailed t‐test.
Graphical representation of typical cellular interaction events and their time course, measured from movies represented in (C). N = 8 independent fish per condition.
Gene expression of FAC‐sorted neutrophils extracted from Tg(mpx:GFP); Tg(mpeg:mCherry) needle‐stick wounded fish at 12 HPI, showing relative gene expression for sflt1 compared to unwounded fish at 4.5 DPF. N = 50 independent fish per condition per replicate, 3 replicates. Statistical significance is indicated, as determined by two‐tailed t‐test.
Gene expression of FAC‐sorted macrophages from Tg(mpx:GFP); Tg(mpeg:mCherry) transgenic zebrafish at 12 HPI post‐needle‐stick injury, showing relative gene expression for cyba1 and yrk compared to unwounded fish at 4.5 DPF. N = 50 independent fish per condition per replicate, 3 replicates. Statistical significance is indicated, as determined by two‐tailed t‐test.
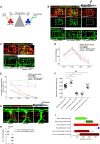
Schematic showing the factors used to skew macrophage phenotype towards either pro‐inflammatory or anti‐inflammatory states.
Representative confocal projection images of needle‐stick injured zebrafish, taken from either 1 DPI Tg(mpeg:mCherry); Tg(tnfα:GFP) transgenic zebrafish (top panel) or 4 DPI Tg(fli:GFP) transgenic zebrafish (bottom panel), treated, as indicated, with DMSO (control), Ifn‐γ or Il‐10. Boxed area denotes wound site.
Representative confocal projection images of needle‐stick injured zebrafish taken from either 1 DPI Tg(mpeg:mCherry); Tg(tnfα:GFP) transgenic fish (top panel; middle panel for GFP only) or 4 DPI Tg(fli:GFP) transgenic fish (bottom panel), csf1ra −/− mutant and treated with Ifn‐γ. Boxed area denotes wound site.
Quantification of number of macrophages at the wound site between 1 and 4 DPI, measured from images represented in (B and C). N = 14 (from B) and N = 16 (from C) independent fish per timepoint per condition.
Quantification of proportion of macrophages that are tnfα positive at the wound site from 1 to 4 DPI, measured from images represented in (B and C). N = 14 (from B) and N = 16 (from C) independent fish per timepoint per condition.
Quantification of total blood vessel length at 4 DPI, measured from images represented in (B and C), using Angioanalyser. N = 14 (from B) and N = 16 (from C) independent fish per timepoint per condition. Statistical significance, as determined by one‐way ANOVA, is P ≤ 0.0001. Subsequent Bonferonni multiple comparison test, determines level of significance, as indicated. Significance values: *P ≤ 0.05, ***P ≤ 0.0001.
Representative confocal projection images taken from laser wounded Tg(fli:GFP); Tg(mpeg:mCherry); Tg(tnfα:GFP) triple transgenic zebrafish, imaged 30‐930 MPI. Boxed area denotes wound site. tnfα‐positive, inflammatory macrophages (arrows) associate with damaged, sprouting blood vessels earlier and in larger numbers than tnfα‐negative, non‐inflammatory macrophages (arrowheads).
Quantification of numbers of inflammatory versus non‐inflammatory macrophages associated with damaged, sprouting blood vessels, measured from images represented in (G). N = 8 independent fish. Statistical significance is indicated, as determined by two‐tailed t‐test.
Graphical representation of common cellular interaction events and their time course, measured from movies represented in (G) and compared to events observed in Fig 3C. N = 8 independent fish.
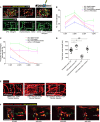
Representative confocal projection images taken from either 1 DPI Tg(mpeg:mCherry); Tg(tnfα:GFP) transgenic zebrafish (top panel) or 4 DPI Tg(fli:GFP) transgenic fish (bottom panel), wild type or csf1ra −/− mutant, treated as indicated with LPS or hydrocortisone. Boxed area denotes wound site.
Quantification of number of macrophages at the wound site from 1 to 4 DPI, measured from images represented in (A) and Fig 4. N = 14 independent fish per timepoint per condition.
Quantification of proportion of macrophages that are tnfα positive at the wound site from 1 to 4 DPI, measured from images represented in (A) and Fig 4. N = 14 independent fish per timepoint per condition.
Quantification of total blood vessel length at 4 DPI, measured using Angioanalyser from images represented in (A). N = 14 independent fish per timepoint per condition. Statistical significance, as determined by one‐way ANOVA, is P ≤ 0.0001. Subsequent Bonferroni multiple comparison test, determines level of significance, as indicated. Significance values: *P ≤ 0.05, **P ≤ 0.001.
Representative confocal projection images of 30‐gauge needle wounded Tg(fli:GFP) zebrafish larvae, treated with DMSO, LPS or Ifn‐γ from moment of injury, loaded with dextran (red) one hour prior to imaging, imaged at 4 DPI. Boxed area indicates wound site.
Representative confocal projection images taken from laser wounded Tg(kdrl:mCherry‐CAAX); Tg(mpeg:mCherry); Tg(tnfα:GFP) transgenic zebrafish, imaged 30–480 MPI. Similar early recruitment was observed with respect to tnfα‐positive macrophages (arrowheads) versus tnfα‐negative macrophages (asterisks), complementing our results from Movie EV8. As time progresses, some tnfα‐positive macrophages diminish their GFP expression as they leave the site of injury (arrow). Boxed area denotes wound site. N = 5 independent fish.
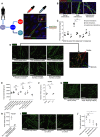
Schematic representing experimental design for human macrophage/human endothelial cell co‐culture study. Primary monocytes are matured to macrophages, which are in turn skewed towards a pro‐inflammatory status or an anti‐inflammatory status by exposure to INF‐γ or IL‐4, respectively. These cells, or their media, are then added to HUVECs cultured on a feeder layer of fibroblasts.
Representative confocal projection images taken from a human macrophage/HUVEC co‐culture stained for endothelial cells (CD31, green), macrophages (MCSFR, red) and DAPI (nuclei, including those of feeder cells), showing three types of observed cellular interactions: (i) macrophage–sprout interactions, (ii) macrophage interactions with the sides of vessels, (iii) macrophage interactions at the site of vessel anastomosis.
Graphical representation of percentage of macrophage–HUVEC interactions for each of the categories of interaction described in (B). N = 4 independent experiments per condition. Statistical significance, as determined by one‐way ANOVA, is P < 0.0001.
Representative fluorescent images of HUVECs co‐cultured with macrophages or cultured in macrophage‐conditioned media, as indicated, stained for endothelial cells (CD31). Culturing HUVECs in inflammatory macrophage‐conditioned media or with inflammatory macrophages results in enhanced vessel sprouting, formation and growth.
Quantification of total vessel length of HUVECs cultured or co‐cultured as indicated, measured from images represented in (D) using Angioanalyser. N = 4 independent experiments per condition. Statistical significance, as determined by one‐way ANOVA, is P ≤ 0.0001.
VEGFA expression levels for human macrophages treated with IFN‐γ versus IL‐4. N = 3 independent macrophage culture experiments per condition. Statistical significance, as determined by one‐way ANOVA, is P ≤ 0.0001.
Representative fluorescent images of HUVECs cultured in conditioned media from IFN‐γ‐treated macrophages and either treated with vehicle control or VEGF blocking antibody, stained for endothelial cells (CD31, green).
Quantification of total vessel length of HUVECs, measured from images represented in (G) using Angioanalyser. N = 3 independent experiments. Statistical significance is indicated, as determined by two‐tailed t‐test.
Representative fluorescent images of HUVECs co‐cultured with freshly isolated neutrophils, or neutrophils treated with IFN‐α and stained for endothelial cells (CD31, green). Culturing HUVECs with neutrophils results in suppressed vessel sprouting, formation and growth.
Quantification of total vessel length of HUVECs cultured or co‐cultured with neutrophils as indicated, measured from images represented in (I) using Angioanalyser. N = 3 independent experiments per condition. Statistical significance, as determined by one‐way ANOVA, is P = 0.005.

TNFα and MRC1 expression levels for human macrophages treated with IFN‐γ versus IL‐4, compared to control macrophages treated with MSCF alone. N = 3 independent macrophage culture experiments per condition. Statistical significance, as determined by one‐way ANOVA, is P ≤ 0.0001.
Quantification of vessel complexity (nodes and sprouts, as indicated) of HUVECs cultured or co‐cultured as indicated, measured from images represented in Fig 5D, using Angioanalyser. Statistical significance, as determined by one‐way ANOVA, is P ≤ 0.0001.
Gene expression for FAC‐sorted zebrafish wound macrophages from Tg(tnfα:GFP); Tg(mpeg:mCherry) zebrafish, extracted at 1 DPI following needle‐stick injury. tnfα‐positive inflammatory macrophages express higher levels of vegfaa than tnfα‐negative non‐inflammatory macrophages. N = 50 independent fish per condition, 3 replicates. Statistical significance is indicated, as determined by two‐tailed t‐test.
Gene expression for whole‐dissected zebrafish needle‐stick wounds from Tg(mpeg:KalTA4); Tg(UAS:nfsB‐mCherry) zebrafish following treatment with metronidazole, versus control DMSO‐treated wounded fish, at 2 DPI and 4 DPI. Macrophage absence from wounds results in an overall decrease in vegfaa levels at the wound site. N = 30 independent fish per condition, three replicates. Statistical significance is indicated, as determined by two‐tailed t‐test.
Representative confocal projection images taken from needle‐stick wounded Tg(mpeg:KalTA4); Tg(UAS:nfsB‐mCherry); Tg(tnfα:GFP) triple transgenic zebrafish, DMSO control or metronidazole treated indicated, upon which vegfaa WISH was performed. Inset image shows high levels of vegfaa expression (blue) in tnfα‐positive macrophages (yellow, asterisk) versus low levels in tnfα‐negative macrophages (red, arrowhead). Boxed area denotes wound site. N = 12 independent fish per condition.
Schematic and representative confocal images showing rescue experiment and subsequent needle‐stick injury performed on vegfaa homozygous mutant zebrafish or siblings, transgenic for Tg(etv2:GFP). Embryos derived from an incross of vegfaa +/− adults were injected with “rescue” mRNA encoding for vegfaa‐165 at the one‐cell stage. At 4 DPF, these mutant fish had an impaired but functional complement of ISVs. Needle‐stick injuries performed on these mutants and their siblings at 4 DPF indicated a failure of wound angiogenesis by 4 DPI, despite a relatively normal inflammatory response. Boxed area denotes wound site.
Quantification of total blood vessel length at 4 DPI, measured from images represented in (D), using Angioanalyser. N = 12 independent fish per condition. Statistical significance is indicated, as determined by two‐tailed t‐test.
Representative confocal projection image taken from needle‐stick wounded Tg(fli:GFP) transgenic zebrafish, imaged 4 DPI and treated with vegfr2 inhibitor SKLB1002 from the moment of injury. Boxed area denotes wound site.
Quantification of total blood vessel length, measured from images represented in (F) using Angioanalyser. N = 14 independent fish. Statistical significance is indicated, as determined by two‐tailed t‐test.
Representative confocal projection images taken from laser wounded Tg(fli:GFP), Tg(mpeg:mCherry) double‐transgenic zebrafish, imaged 30–930 MPI and treated with SKLB1002 from moment of injury. Macrophages still associate with damaged vessels (arrowheads), but these vessels do not sprout appropriately and fail to repair. Boxed area denotes wound site.
Graphical representation of common cellular interaction events and their time course, measured from movies represented in (H) and compared to events observed in Fig 3C. N = 8 independent fish.

Representative confocal projection image taken from needle‐stick wounded Tg(fli:GFP) transgenic zebrafish, imaged 4 DPI and treated with vegfr2 inhibitor SU5416 from the moment of injury. Boxed area denotes wound site. Scale bar, 100 μm.
Quantification of total blood vessel length, measured from images represented in (A) using Angioanalyser. N = 10 independent fish. Statistical significance is indicated, as determined by two‐tailed t‐test. Error bars indicate mean ± SD.

Representative confocal projection images taken from needle‐stick wounded Tg(fli:GFP); Tg(mpeg:mCherry), double‐transgenic zebrafish, imaged at 7 DPI. Some macrophages at this later wound repair timepoint contain phagocytosed GFP tagged endothelial material (arrowhead). Boxed area denotes macrophage containing endothelial cell material. N = 9 independent fish.
Representative confocal projection images taken from needle‐stick wounded Tg(fli:GFP); Tg(mpeg:KalTA4); Tg(UAS:nfsB‐mCherry) triple transgenic zebrafish, imaged at 10 DPI, treated with vehicle control, metronidazole or QVD pan‐caspase inhibitor from 6 DPI. Both macrophage ablation and caspase blockade resulted in a failure to remodel vessels. Boxed area denotes wound site.
Quantification of total blood vessel length, measured from images represented in (B). N = 12 independent fish per timepoint per condition. Statistical significance, as determined by one‐way ANOVA, is P ≤ 0.0001.
Representative confocal projection images taken from needle‐stick wounded Tg(kdrl:mCherry‐CAAX); Tg(secA5‐YFP); Tg(mpeg:mCherry) transgenic zebrafish, imaged at 8 DPI, injected with control liposomes or clodronate liposomes as indicated. Macrophages are observed within the wound site in control liposome‐treated fish (arrowheads). The apoptotic marker is seen in thin, unicellular tubes during the regression phase (arrows). Ablation of macrophages during the regression phase results in decreased levels of vessel apoptosis.
Quantification of apoptotic endothelial cells during vessel regression, measured from images represented in (D). N = 12 independent fish per timepoint per condition. Statistical significance, as determined by one‐way ANOVA, is P ≤ 0.0001.
Representative confocal projection images taken from either 8 DPI Tg(mpeg:mCherry); Tg(tnfα:GFP) transgenic fish or 10 DPI Tg(fli:GFP) transgenic fish, treated as indicated from 6 DPI, following needle‐stick injury. Inflammatory tnfα‐positive macrophages are indicated (arrows). Boxed area denotes wound site.
Quantification of number of macrophages at the wound site at 8 DPI, measured from images represented in (F). N = 12 independent fish per timepoint per condition. Statistical significance, as determined by one‐way ANOVA, is P = 0.7412 (not significant).
Quantification of proportion of macrophages that are tnfα‐positive inflammatory macrophages at the wound site at 8 DPI, measured from images represented in (F). N = 12 independent fish per timepoint per condition. Statistical significance, as determined by one‐way ANOVA, is P ≤ 0.0001.
Quantification of total blood vessel length at 10 DPI, measured from images represented in (F) using Angioanalyser. N = 12 independent fish per timepoint per condition. Statistical significance, as determined by one‐way ANOVA, is P ≤ 0.0001.
Gene expression for FAC‐sorted Tg(mpeg:mCherry); Tg(tnfα:GFP) zebrafish wound macrophages extracted at 7 DPI following needle‐stick injury. tnfα‐positive inflammatory macrophages express higher levels of vegfaa than tnfα‐negative non‐inflammatory macrophages. N = 100 independent fish per condition, 3 replicates. Statistical significance is indicated, as determined by two‐tailed t‐test.
References
-
- Bishop ET, Bell GT, Bloor S, Broom IJ, Hendry NF, Wheatley DN (1999) An in vitro model of angiogenesis: basic features. Angiogenesis 3: 335–344 - PubMed
-
- Carrillo SA, Anguita‐Salinas C, Pena OA, Morales RA, Munoz‐Sanchez S, Munoz‐Montecinos C, Paredes‐Zuniga S, Tapia K, Allende ML (2016) Macrophage recruitment contributes to regeneration of mechanosensory hair cells in the zebrafish lateral line. J Cell Biochem 117: 1880–1889 - PubMed
-
- Cash JL, Martin P (2016) Myeloid cells in cutaneous wound repair. Microbiol Spectr 4: MCHD‐0017‐2015 - PubMed
Publication types
MeSH terms
Grants and funding
LinkOut - more resources
Full Text Sources
Other Literature Sources
Molecular Biology Databases

