

Pronounced summer warming in northwest Greenland during the Holocene and Last Interglacial
- PMID: 29866819
- PMCID: PMC6016770
- DOI: 10.1073/pnas.1720420115
Pronounced summer warming in northwest Greenland during the Holocene and Last Interglacial
Abstract
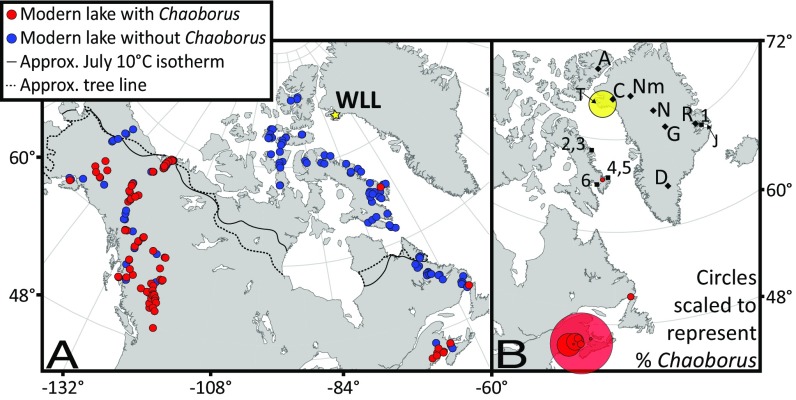
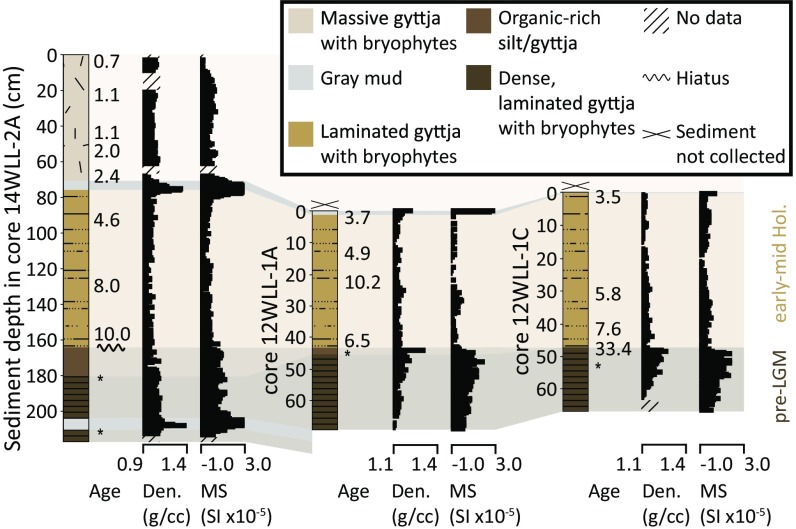
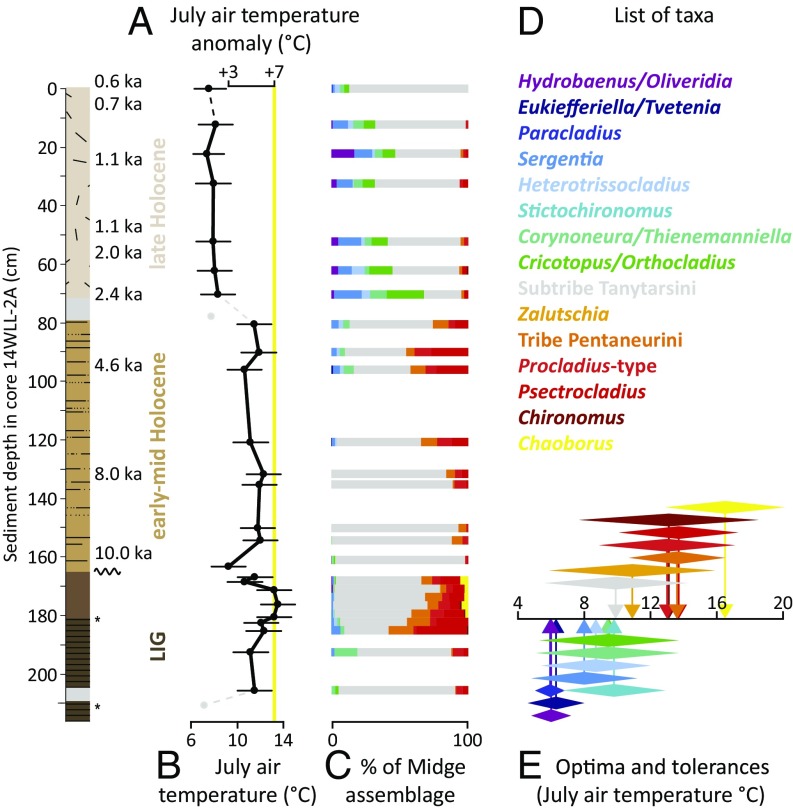
Projections of future rates of mass loss from the Greenland Ice Sheet are highly uncertain because its sensitivity to warming is unclear. Geologic reconstructions of Quaternary interglacials can illustrate how the ice sheet responded during past warm periods, providing insights into ice sheet behavior and important tests for data-model comparisons. However, paleoclimate records from Greenland are limited: Early Holocene peak warmth has been quantified at only a few sites, and terrestrial sedimentary records of prior interglacials are exceptionally rare due to glacial erosion during the last glacial period. Here, we discuss findings from a lacustrine archive that records both the Holocene and the Last Interglacial (LIG) from Greenland, allowing for direct comparison between two interglacials. Sedimentary chironomid assemblages indicate peak July temperatures 4.0 to 7.0 °C warmer than modern during the Early Holocene maximum in summer insolation. Chaoborus and chironomids in LIG sediments indicate July temperatures at least 5.5 to 8.5 °C warmer than modern. These estimates indicate pronounced warming in northwest Greenland during both interglacials. This helps explain dramatic ice sheet thinning at Camp Century in northwest Greenland during the Early Holocene and, for the LIG, aligns with controversial estimates of Eemian warming from ice core data retrieved in northern Greenland. Converging geologic evidence for strong LIG warming is challenging to reconcile with inferred Greenland Ice Sheet extent during the LIG, and the two appear incompatible in many models of ice sheet evolution. An increase in LIG snowfall could help resolve this problem, pointing to the need for hydroclimate reconstructions from the region.
Keywords: Eemian; Greenland; Holocene thermal maximum; Last Interglacial; paleotemperature.
Conflict of interest statement
The authors declare no conflict of interest.
Figures
References
-
- Collins M, et al. Long-term climate change: Projections, commitments and irreversibility. In: Stocker TF, et al., editors. Climate Change 2013: The Physical Science Basis. Contribution of Working Group I to the Fifth Assessment Report of the Intergovernmental Panel on Climate Change. Cambridge Univ Press; Cambridge, UK: 2013. pp. 1029–1136.
-
- Miller GH, et al. Arctic amplification: Can the past constrain the future? Quat Sci Rev. 2010;29:1779–1790.
-
- Marcott SA, Shakun JD, Clark PU, Mix AC. A reconstruction of regional and global temperature for the past 11,300 years. Science. 2013;339:1198–1201. - PubMed
-
- Lecavalier BS, et al. A model of Greenland ice sheet deglaciation constrained by observations of relative sea level and ice extent. Quat Sci Rev. 2014;102:54–84.
-
- Simpson MJR, Milne GA, Huybrechts P, Long AJ. Calibrating a glaciological model of the Greenland ice sheet from the Last Glacial Maximum to present-day using field observations of relative sea level and ice extent. Quat Sci Rev. 2009;28:1631–1657.
Publication types
LinkOut - more resources
Full Text Sources
Other Literature Sources
Miscellaneous
