. 2018 Jun 19;115(25):E5746-E5755.
doi: 10.1073/pnas.1802079115. Epub 2018 Jun 4.

Gastrointestinal stromal tumor enhancers support a transcription factor network predictive of clinical outcome

Affiliations

Gastrointestinal stromal tumor enhancers support a transcription factor network predictive of clinical outcome

Matthew L Hemming et al. Proc Natl Acad Sci U S A. .

Abstract

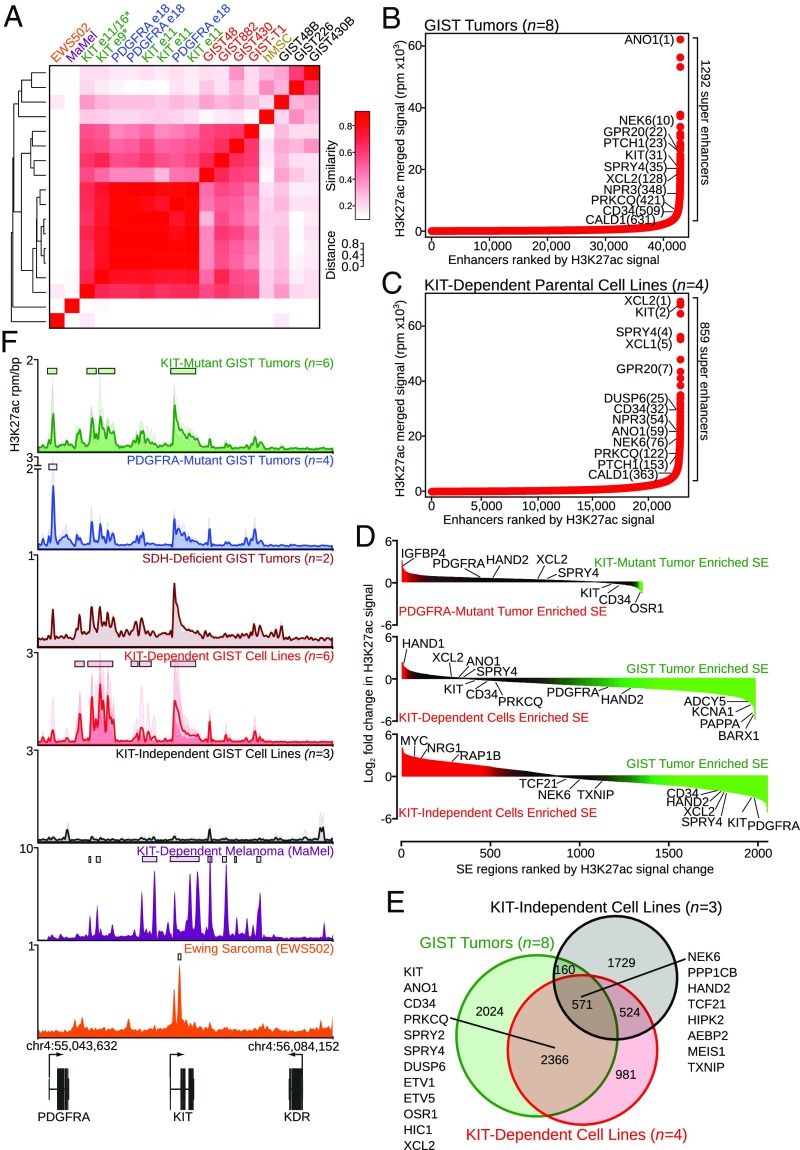
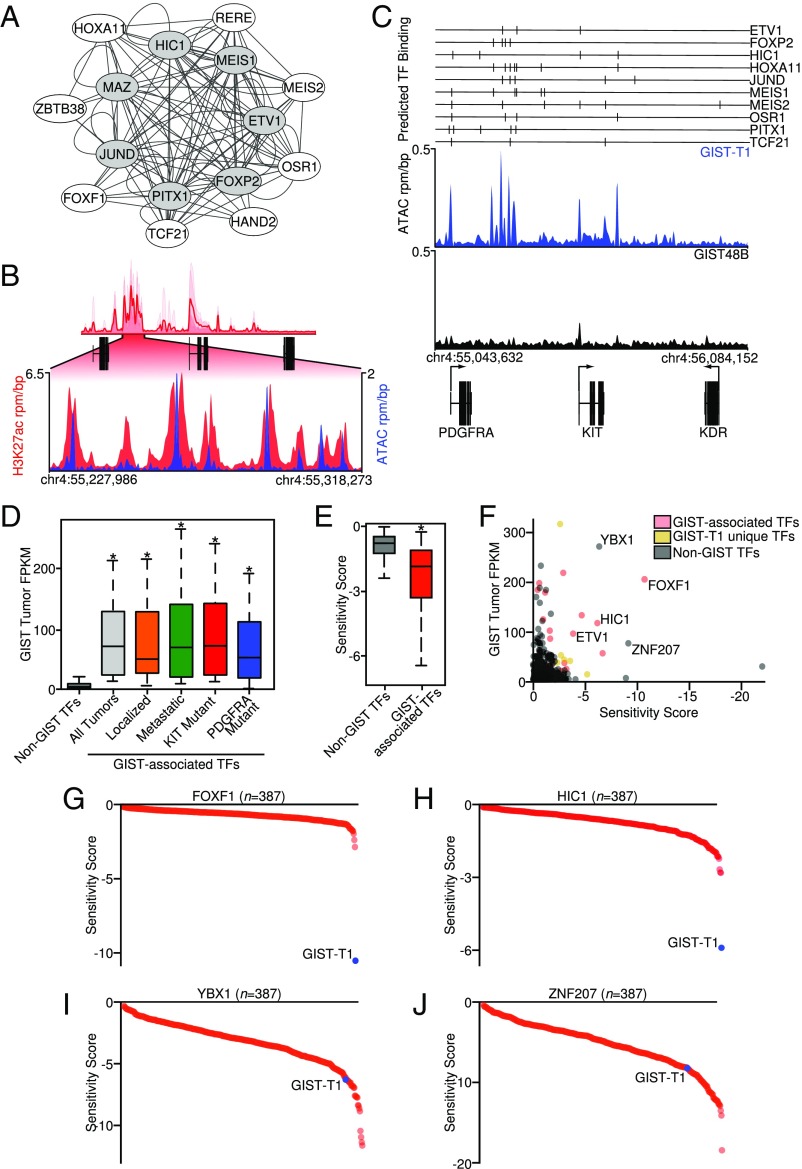
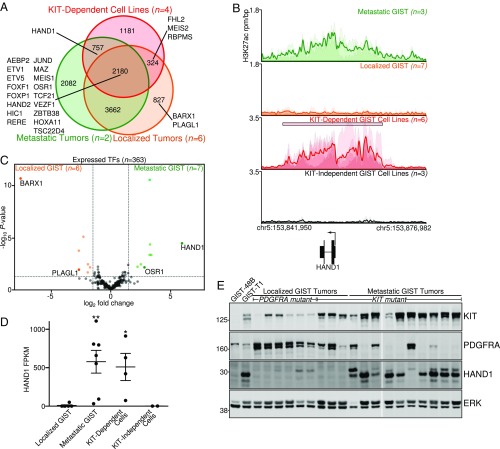
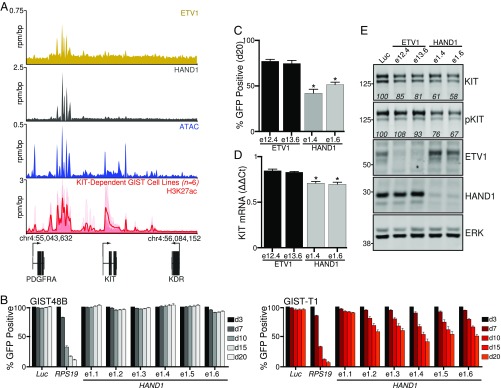
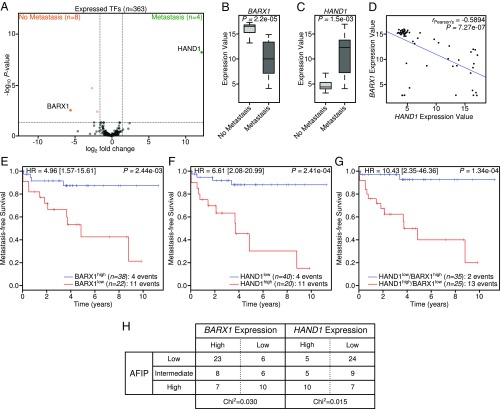
Activating mutations in the KIT or PDGFRA receptor tyrosine kinases are hallmarks of gastrointestinal stromal tumor (GIST). The biological underpinnings of recurrence following resection or disease progression beyond kinase mutation are poorly understood. Utilizing chromatin immunoprecipitation with sequencing of tumor samples and cell lines, we describe the enhancer landscape of GIST, highlighting genes that reinforce and extend our understanding of these neoplasms. A group of core transcription factors can be distinguished from others unique to localized and metastatic disease. The transcription factor HAND1 emerges in metastatic disease, binds to established GIST-associated enhancers, and facilitates GIST cell proliferation and KIT gene expression. The pattern of transcription factor expression in primary tumors is predictive of metastasis-free survival in GIST patients. These results provide insight into the enhancer landscape and transcription factor network underlying GIST, and define a unique strategy for predicting clinical behavior of this disease.

Keywords: GIST; epigenetics; sarcoma; transcription factor.


Conflict of interest statement

Conflict of interest statement: R.Z. is currently an employee at C4 Therapeutics. S.A.A. is a consultant for Epizyme Inc., Vitae Inc., and Imago Biosciences. G.D.D. reports financial relationships with Ariad, Astra-Zeneca, Bayer, Blueprint Medicines, Kolltan Pharmaceuticals, and Pfizer. J.E.B. is an employee, shareholder, and executive of Novartis Pharmaceuticals. J.E.B. is a scientific founder of Syros Pharmaceuticals, SHAPE Pharmaceuticals, Acetylon Pharmaceuticals, Tensha Therapeutics (now Roche), and C4 Therapeutics, and is the inventor on intellectual property licensed to these entities. None of these relationships constitute a conflict of interest for the present work. The remaining authors declare no conflict of interest.

Figures

Fig. 1.
Fig. 1.
Enhancer profiling identifies a conserved GIST program. (A) Heatmap clustering of SEs across tumor samples and cell lines, as defined by H3K27ac ChIP-seq. Sample names are color-coded to indicate tumors (KIT-mutant in green; PDGFRA-mutant in blue; metastatic samples are designated with an asterisk) and cell lines (KIT-dependent in red; KIT-independent in black). Additional comparators include a Ewing sarcoma cell line expressing wild-type KIT (EWS502), a KIT-mutant melanoma cell line (MaMel), and hMSCs. (B and C) Ranked enhancer plots in GIST tumors (n = 8) (B) and KIT-dependent parental cell lines (n = 4) (C). (D) Waterfall plots comparing log2 fold change of SE regions between localized KIT- and PDGFRA-mutant tumors (n = 3 each) (Top), KIT-dependent cell lines (n = 4) and localized GIST tumors (n = 6) (Middle), and KIT-independent cell lines (n = 3) and localized GIST tumors (n = 6) (Bottom). (E) Venn diagram of enhancer peaks conserved in all subgroup samples comparing GIST tumors and cell lines. (F) H3K27ac meta tracks at the KIT locus in GIST tumors and cell lines, in which tracks from individual samples are translucent and the opaque line represents the average signal across all samples. y-axis heights are variable to emphasize peak morphology. SE regions are indicated with rectangles above the associated peaks.
Fig. 2.
Fig. 2.
Transcriptional regulatory circuitry in GIST. (A) Core (gray) and extended (white) regulatory TF circuitry identified in GIST tumors from core regulatory circuitry analysis. Each GIST-associated TF represents a node in the network, with edges connecting coregulated TFs. (B) Overlap of H3K27ac and ATAC peaks at the KIT SE in the GIST-T1 cell line. (C) ATAC-seq from the KIT-dependent cell line GIST-T1 and the KIT-independent cell line GIST48B at the KIT locus. Predicted binding sites of 10 GIST-associated TFs are indicated with vertical lines. (D) Expression of GIST-associated TFs (n = 24) compared with all other putative TFs (n = 1,410) in all GIST tumors (n = 13) and the disease subtypes including localized (n = 6), metastatic (n = 7), KIT-mutant (n = 10), and PDGFRA-mutant (n = 3). Data were analyzed by one-way ANOVA with Tukey’s post hoc test (compared with non-GIST TFs; *P < 0.001). (E) Sensitivity score comparing GIST-associated TFs (n = 21) with non-GIST TFs (n = 794) present in Project DRIVE data for GIST-T1 (Welch’s t test; *P < 0.005). (F) Scatterplot of average GIST tumor FPKM (n = 13) and sensitivity score from all TFs in Project DRIVE. Data points are colored according to grouping in GIST-associated TFs (red), TFs with unique SEs in the GIST-T1 cell line used in Project DRIVE compared with all GIST tumors (yellow), or non-GIST TFs (gray). (G and H) Plot of sensitivity score and cell line rank (n = 387) for the GIST-associated TFs FOXF1 (G) and HIC1 (H). (I and J) Plot of sensitivity score and cell line rank for non-GIST TFs YBX1 (I) and ZNF207 (J); the values for the GIST-T1 cell line are indicated in blue.
Fig. 3.
Fig. 3.
Evaluation of TFs enriched in metastatic GIST identifies HAND1. (A) Venn diagram of enhancer peaks comparing metastatic (n = 2) and localized GIST (n = 6) tumors and parental KIT-dependent GIST cell lines (n = 4). Transcriptional regulatory genes are listed, with HAND1 being unique to the metastatic tumors and BARX1 to localized tumors. (B) Meta tracks of GIST tumors and cell lines at the HAND1 locus. y-axis heights are variable to emphasize peak morphology. The SE region is indicated with a rectangle. (C) Volcano plot of RNA-seq data in all expressed TFs comparing localized and metastatic GIST tumors. Differentially and highly expressed TFs are labeled. (D) FPKM of HAND1 in tumor and cell line subtypes. RNA-seq samples include localized tumors with either KIT (n = 3) or PDGFRA (n = 3) mutations, KIT-mutant metastatic tumors (n = 7), KIT-dependent cell lines (n = 4), and KIT-independent cell lines (n = 2). Data were analyzed by one-way ANOVA with Dunnett’s multiple comparisons test (compared with localized GIST tumors; *P < 0.05, **P < 0.01). (E) Western blot of localized and metastatic GIST tumors probing for KIT, PDGFRA, HAND1, or ERK as a loading control. The tumor’s activating mutation (KIT or PDGFRA) is indicated above the lane.
Fig. 4.
Fig. 4.
HAND1 is required for GIST cellular proliferation and KIT expression. (A) ChIP-seq of ETV1 and HAND1, ATAC-seq, and H3K27ac ChIP-seq meta tracks at the KIT locus. (B) CRISPR/Cas9 GFP-competition assay over time with sgRNAs targeting HAND1 in the KIT-independent GIST48B cell line (grayscale) and KIT-dependent cell line GIST-T1 (red). sgRNAs against luciferase (Luc) and RPS19 were used as negative and positive controls, respectively. Gene-specific sgRNAs are named after the targeted exon. Mean ± SEM; n = 4. (C) Comparison of percent GFP-positive cell depletion at day 20 arising from ETV1 and HAND1 sgRNAs in GIST-T1. Mean ± SEM; n = 4. (D and E) Relative KIT mRNA levels by RT-PCR normalized to Luc sgRNA control and Western blot for the indicated proteins following 10 d of treatment with the indicated control or ETV1 or HAND1 sgRNAs in GIST-T1. Mean ± SEM; n = 3. Values within the Western blots represent average band signal intensity across three independent experiments with experimental samples processed in parallel and normalized to Luc sgRNA control. Data in C and D were analyzed by one-way ANOVA with Dunnett’s multiple comparisons test (compared with Luc sgRNA control; *P < 0.05).
Fig. 5.
Fig. 5.
HAND1 and BARX1 expression predicts subsequent metastasis in primary GIST. (A) Volcano plot of RNA-seq data of TFs from untreated, localized primary GIST comparing tumors with and without subsequent metastasis. (B and C) Boxplots showing array expression values of BARX1 (B) and HAND1 (C) and in cases of untreated, localized primary GIST tumors that did (n = 15) or did not (n = 45) subsequently develop metastatic disease; Wilcoxon signed-rank test. (D) Scatterplot showing negative correlation between HAND1 and BARX1 expression (n = 60). (EG) Kaplan–Meier analysis of metastasis-free survival in 60 primary GIST tumors stratified by BARX1 expression, HAND1 expression, or combined HAND1/BARX1 expression. HR, hazard ratio. (H) Table of BARX1 and HAND1 expression values in primary GIST tumors separated by AFIP risk category. The χ2 test P value evaluating association of AFIP stratification versus BARX1 or HAND1 expression is indicated.

References

    1. Burningham Z, Hashibe M, Spector L, Schiffman JD. The epidemiology of sarcoma. Clin Sarcoma Res. 2012;2:14. - PMC - PubMed
    1. Demetri GD, et al. Efficacy and safety of imatinib mesylate in advanced gastrointestinal stromal tumors. N Engl J Med. 2002;347:472–480. - PubMed
    1. von Mehren M. Management of gastrointestinal stromal tumors. Surg Clin North Am. 2016;96:1059–1075. - PubMed
    1. Whyte WA, et al. Master transcription factors and mediator establish super-enhancers at key cell identity genes. Cell. 2013;153:307–319. - PMC - PubMed
    1. Hnisz D, et al. Super-enhancers in the control of cell identity and disease. Cell. 2013;155:934–947. - PMC - PubMed

Publication types

MeSH terms

Substances