. 2018 Jun 19;115(25):6470-6475.
doi: 10.1073/pnas.1720273115. Epub 2018 Jun 4.

Transdifferentiation of human adult peripheral blood T cells into neurons

Affiliations

Transdifferentiation of human adult peripheral blood T cells into neurons

Koji Tanabe et al. Proc Natl Acad Sci U S A. .

Abstract

Human cell models for disease based on induced pluripotent stem (iPS) cells have proven to be powerful new assets for investigating disease mechanisms. New insights have been obtained studying single mutations using isogenic controls generated by gene targeting. Modeling complex, multigenetic traits using patient-derived iPS cells is much more challenging due to line-to-line variability and technical limitations of scaling to dozens or more patients. Induced neuronal (iN) cells reprogrammed directly from dermal fibroblasts or urinary epithelia could be obtained from many donors, but such donor cells are heterogeneous, show interindividual variability, and must be extensively expanded, which can introduce random mutations. Moreover, derivation of dermal fibroblasts requires invasive biopsies. Here we show that human adult peripheral blood mononuclear cells, as well as defined purified T lymphocytes, can be directly converted into fully functional iN cells, demonstrating that terminally differentiated human cells can be efficiently transdifferentiated into a distantly related lineage. T cell-derived iN cells, generated by nonintegrating gene delivery, showed stereotypical neuronal morphologies and expressed multiple pan-neuronal markers, fired action potentials, and were able to form functional synapses. These cells were stable in the absence of exogenous reprogramming factors. Small molecule addition and optimized culture systems have yielded conversion efficiencies of up to 6.2%, resulting in the generation of >50,000 iN cells from 1 mL of peripheral blood in a single step without the need for initial expansion. Thus, our method allows the generation of sufficient neurons for experimental interrogation from a defined, homogeneous, and readily accessible donor cell population.

Keywords: direct conversion; disease modeling; iN cells; induced neuronal cells; transdifferentiation.


Conflict of interest statement

The authors declare no conflict of interest.

Figures
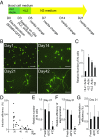
Fig. 1.
Fig. 1.
Generation of neuronal cells from peripheral blood cells. (A) Experimental outline of iN cell induction from PBMCs. (B) Morphological changes during iN cell induction from PBMCs. (Scale bars: 50 μm.) (C) The relative number of iN cells from T cells with or without T cell activator (anti-CD3/CD28), with or without IL-2, or a change to N3 media on day 3. n = 3 individuals. (D) Efficiency of iN cell induction of transduced cells from 35 individual donors without inhibitors at day 21. n = 1 for each donor. The number of iN cells on day 21 was divided by the number of total EGFP+ cells counted on day 1. (E and F) Relative iN cell induction (E) and efficiency of electroporation (F) from PBMCs of three individual donors that were kept at −80 °C or at 4 °C for 2 d relative to the fresh sample. *P < 0.05, paired t test. (G) Transdifferentiation efficiency of PBMCs from three individual donors kept at −80 °C or at 4 °C for 2 d relative to the fresh sample. Error bars represent SD.
Fig. 2.
Fig. 2.
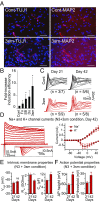
Small molecule treatment improves iN cell conversion efficiency and maturation. (A) Immunofluorescence analysis of iN cells with and without small molecules (3sm, three small molecules: forskolin, dorsomorphin, and SB431542; Cont, DMSO). (Scale bars: 50 µm.) (B) Fold change of improved iN cell formation on day 21 following various small molecule treatments as indicated. Do, dorsomorphin; Fo, forskolin; SB, SB431542. Data shown are average fold changes of three independent experiments using PBMCs from three different donors. The fold change over the control condition was plotted because the absolute reprogramming efficiency was variable among the three donors, but the fold change was consistent. *P < 0.05, paired t test. The error bars indicate SDs. Similar results were obtained with PBMCs from another set of three different donors. (C) Example traces of action potential firing recorded from PBMC-derived iN cells with or without 3sm at days 21 and 42 (n represents the number of cells patched that shows action potentials over the total number of cells patched). The experiment was performed with cells from three different donors, yielding similar results. (D) Sample traces (Left) and average values (mean ± SEM; Right) demonstrating the presence of voltage-gated Na+ and K+ channels in blood iN cells cocultured with glia with 3sm for 42 d. (Inset) Expanded view of the dotted boxed area. (E) Intrinsic properties of membrane potential (Vrest), capacitance (Cm), and input resistance (Rm) approach more mature values over time. (F) Maturation of blood iN cells on extended coculture with glia in 3sm from day 21 to day 42 as determined by increased action potential (AP) height and threshold. Bar graphs represent mean ± SEM. *P < 0.05; **P < 0.01. ns, not significant.
Fig. 3.
Fig. 3.
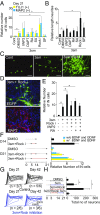
ROCK inhibition improves morphological maturation, but not functional maturation. (A) Relative number of TUJ1-positive (yellow bars) or MAP2-positive (blue bars) cells with 3sm (forskolin, dorsomorphin, and SB431542) and additional small molecules from PBMCs from three individual donors on day 21, normalized to the no treatment control condition (Cont). n = 3 individuals. *P < 0.05 relative to DMSO (only with 3sm). (B) Relative average length of neurites with small molecules from PBMCs from three individual donors. The length was normalized to the no treatment control (Cont). n = 3 individuals. *P < 0.05 relative to the DMSO. (C) Example pictures of iN cells with indicated inhibitors. Green, EGFP fluorescence (Scale bars: 50 µm.). (D) iN cells generated with 3sm plus ROCK inhibitor express neuronal markers, including MAP2. (Scale bars: 50 µm.) (E) The effect of indicated small molecule combinations on reprogramming efficiency. *P <0.05, paired t test. n = 3 individuals. (F) The effect of the duration of 3sm plus ROCK inhibitor with (yellow bars) or without (blue bars) GDNF and BDNF on reprogramming efficiency. n = 3 individuals. (G) Representative traces of action potential responses of PBMC-derived iN cells under control condition (N3 only; Top) and in the presence of 3sm plus ROCK inhibitor when cocultured with glia for 21 d (Left) or 42 d (Right). (H) Graph showing the total number of neurons in four conditions: DMSO control (black line), 3sm treatment for 21 d (blue line), 3sm plus ROCK inhibitor for 21 d (red line), and 3sm plus ROCK for 14 d and 3sm for 7 d. n = 3 individuals. *P < 0.05.
Fig. 4.
Fig. 4.
Blood iN cells express genes characteristic of excitatory, postmitotic neurons. (A) Heatmap showing 6,941 genes differentially expressed between PBMC and blood iN cells. Two biological replicates per population, greater than twofold change and P < 0.05. Shown are the seven most significant (P < 0.05, Bonferroni-corrected) Gene Ontology terms among up- and down-regulated genes using PANTHER. (B) Induction of pan-neuronal markers. (C) Suppression of blood cell genes. (D) Down-regulation of cell cycle activators. (E) Induction of antiproliferative cyclin-dependent kinase inhibitors. (F) Immunofluorescence of blood iN cells showing expression of the excitatory marker vGLUT and subtype markers SATB2 and CTIP2 at 21 d after infection and cultured with 3sm on glia (Scale bars: 50 µm.). (G) Quantification of day 21 blood iN cells grown on glia in 3sm conditions by immunofluorescence for indicated markers. (H) Expression of region-specific markers by the PBMC-derived iN cells by RNA-seq. (I) Validation of the neurotransmitter-specific markers by RNA-seq. (J) Validation of the cortical subtype-specific markers by RNA-seq.
Fig. 5.
Fig. 5.
Generation of synaptically competent iN cells from T cells. (A) Relative reprogramming efficiency of iN cells from the four indicated PBMC populations. The plotted efficiency was normalized by the electroporation efficiency and the efficiency of the CD3+/CD4 cell population was set to 1 (n = 3 individuals). (B) Recording configuration of EGFP-labeled blood iN cells cocultured with unlabeled iPS cell-derived neurons. The recording electrode (Rec) was placed onto an EGFP-positive blood iN cell (white arrowhead) surrounded by nonfluorescent human iPS cell-derived neurons (black arrowheads). (Scale bar: 50 µm.) (C) Example traces of action potential firing recorded from iN cells derived from CD3+/CD4 (red) or CD3+/CD4+ (blue) T cells. N represents the number of cells patched that show action potentials over the total number of cells patched. (D) Representative traces of AMPA receptor-mediated spontaneous network activity (Top, black) recorded from a T cell-derived iN cell, indicating successful integration into the human synaptic network. The trace in red (Bottom) represents an expanded view of the boxed area. Spontaneous PSCs recorded from a T cell-derived iN cell (Top, black) and subsequently blocked by CNQX and picrotoxin (Bottom, black). The trace in red (Middle) represents and expanded view of the boxed area. This pattern was observed in 2 of the 27 cells patched. (E) Evoked PSCs (five trials) in response to extracellular field stimulation recorded from a blood iN cell (Top), which was subsequently blocked by CNQX and picrotoxin application (Bottom).

References

    1. Turner TN, et al. Genomic patterns of de novo mutation in simplex autism. Cell. 2017;171:710–722.e12. - PMC - PubMed
    1. Ang CE, Wernig M. Induced neuronal reprogramming. J Comp Neurol. 2014;522:2877–2886. - PMC - PubMed
    1. Treutlein B, et al. Dissecting direct reprogramming from fibroblast to neuron using single-cell RNA-seq. Nature. 2016;534:391–395. - PMC - PubMed
    1. Takahashi K, et al. Induction of pluripotent stem cells from adult human fibroblasts by defined factors. Cell. 2007;131:861–872. - PubMed
    1. Nichols J, Smith A. Naive and primed pluripotent states. Cell Stem Cell. 2009;4:487–492. - PubMed

Publication types