. 2018 Jun 19;115(25):6410-6415.
doi: 10.1073/pnas.1719076115. Epub 2018 Jun 4.

Altered p53 functionality in cancer-associated fibroblasts contributes to their cancer-supporting features

Affiliations

Altered p53 functionality in cancer-associated fibroblasts contributes to their cancer-supporting features

Sharathchandra Arandkar et al. Proc Natl Acad Sci U S A. .

Abstract

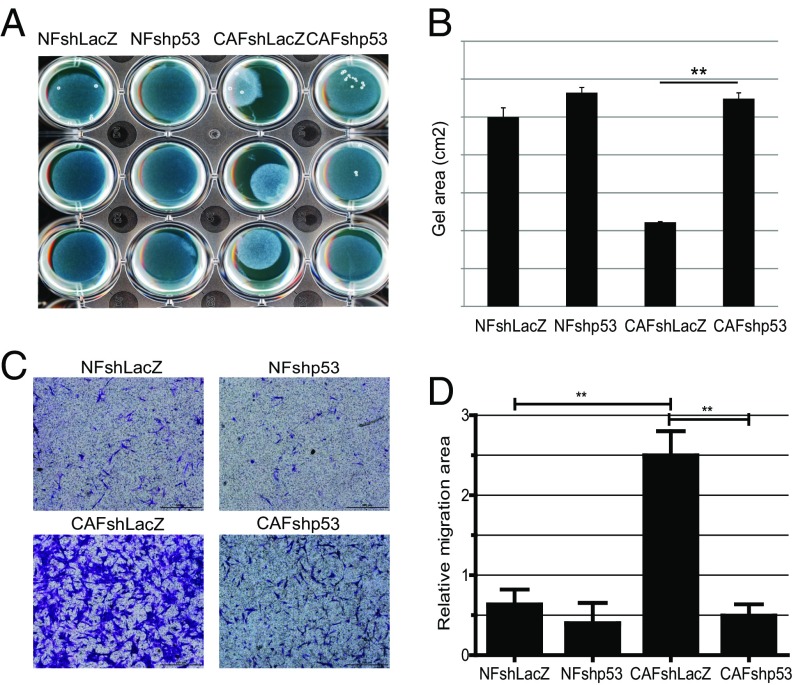
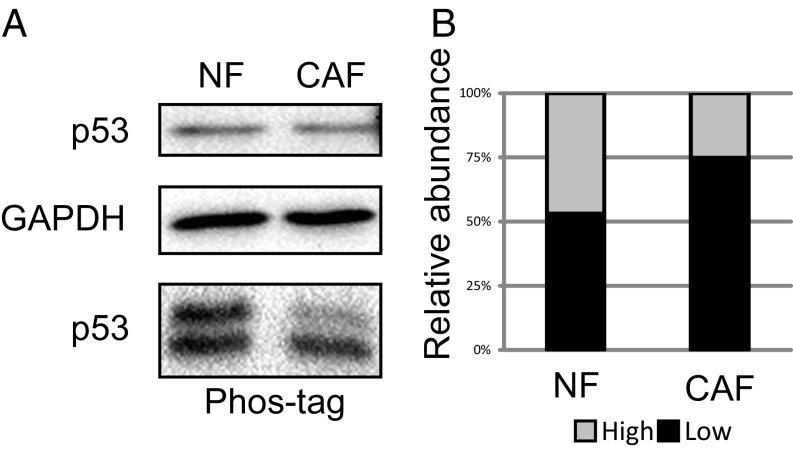
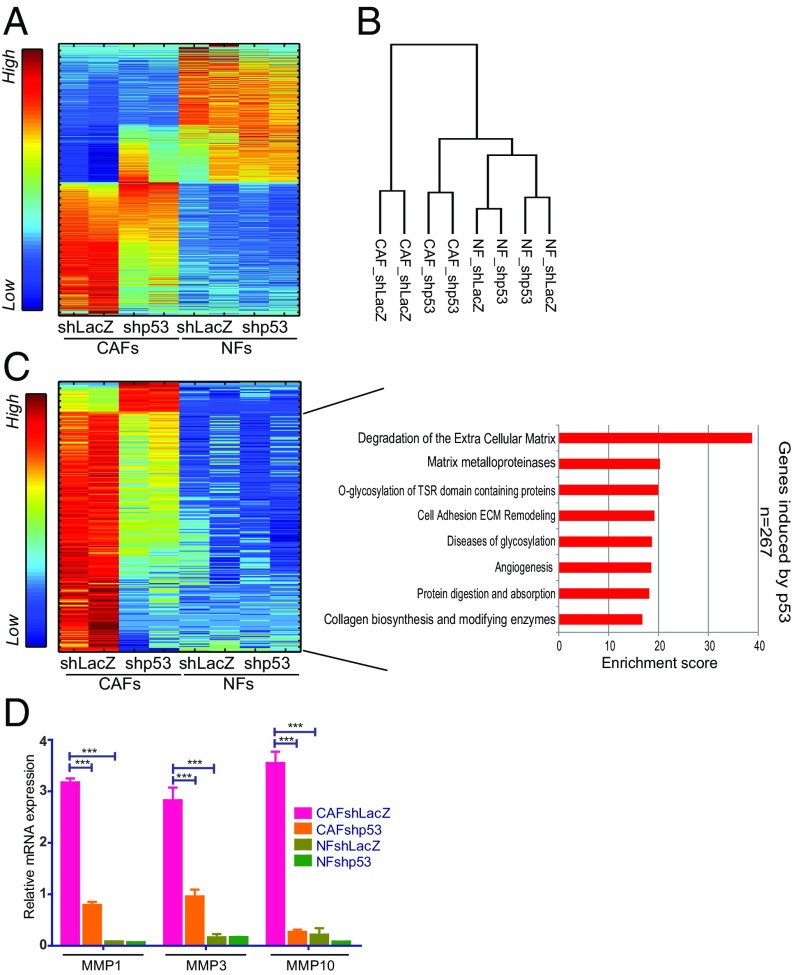
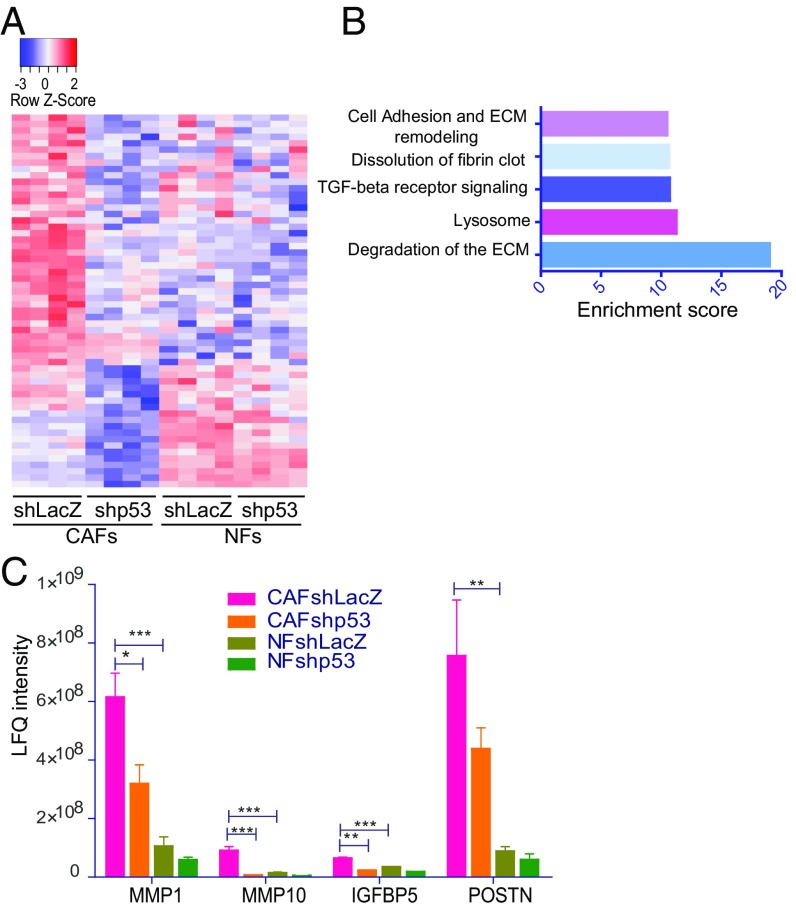
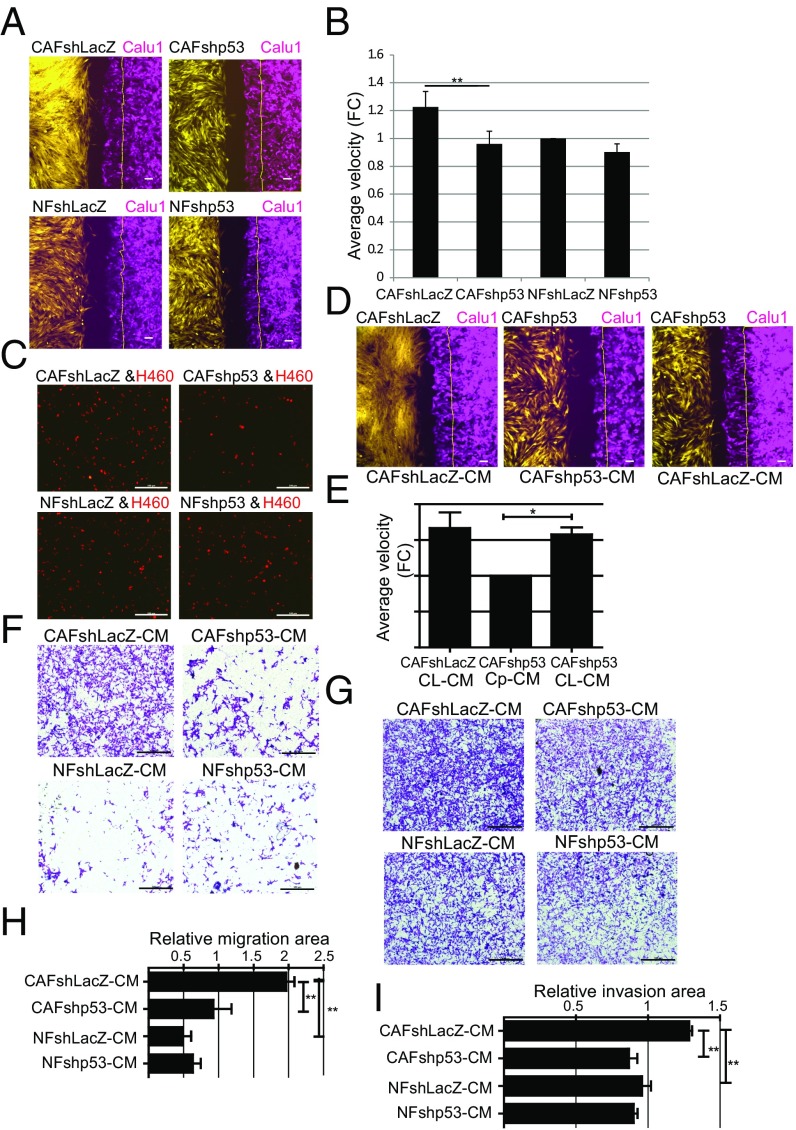
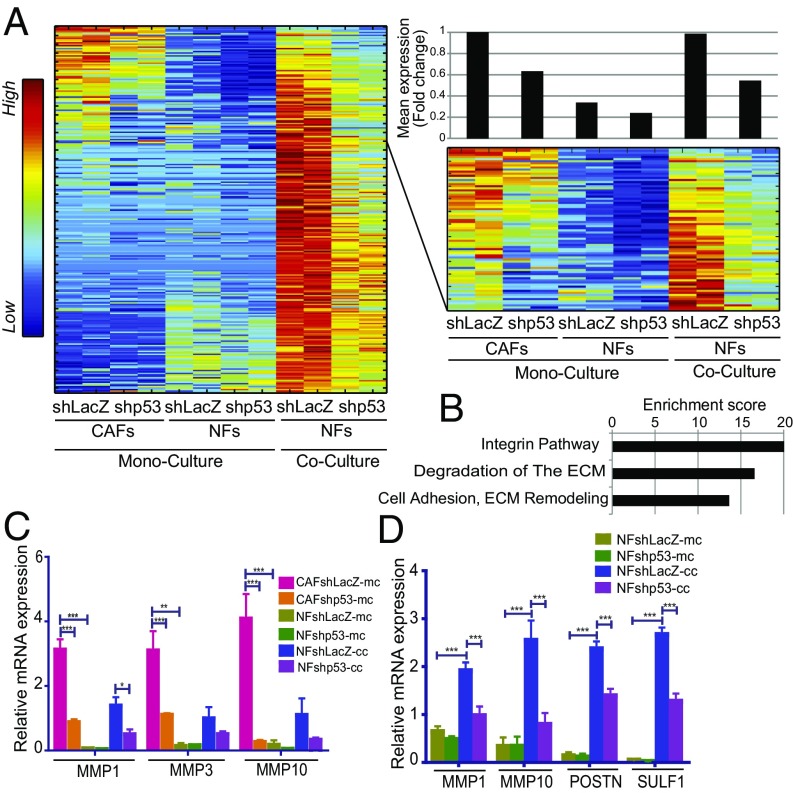
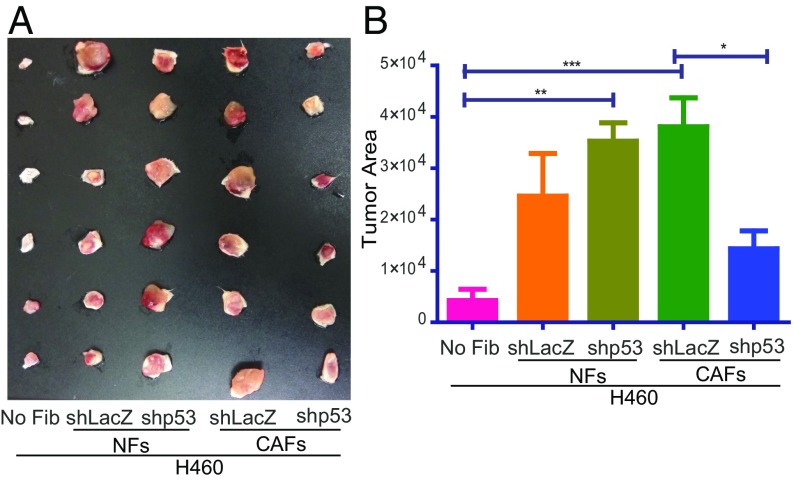
Within the tumor microenvironment, cancer cells coexist with noncancerous adjacent cells that constitute the tumor microenvironment and impact tumor growth through diverse mechanisms. In particular, cancer-associated fibroblasts (CAFs) promote tumor progression in multiple ways. Earlier studies have revealed that in normal fibroblasts (NFs), p53 plays a cell nonautonomous tumor-suppressive role to restrict tumor growth. We now wished to investigate the role of p53 in CAFs. Remarkably, we found that the transcriptional program supported by p53 is altered substantially in CAFs relative to NFs. In agreement, the p53-dependent secretome is also altered in CAFs. This transcriptional rewiring renders p53 a significant contributor to the distinct intrinsic features of CAFs, as well as promotes tumor cell migration and invasion in culture. Concordantly, the ability of CAFs to promote tumor growth in mice is greatly compromised by depletion of their endogenous p53. Furthermore, cocultivation of NFs with cancer cells renders their p53-dependent transcriptome partially more similar to that of CAFs. Our findings raise the intriguing possibility that tumor progression may entail a nonmutational conversion ("education") of stromal p53, from tumor suppressive to tumor supportive.

Keywords: fibroblasts; lung cancer; matrix metalloproteinases; p53; tumor microenvironment.


Conflict of interest statement

The authors declare no conflict of interest.

Figures

Fig. 1.
Fig. 1.
p53 controls the cell-autonomous functions in CAFs. (A) hTERT-immortalized NFs and CAFs from patient 4731, stably expressing either p53 shRNA or control LacZ shRNA, were subjected to a collagen gel contraction assay in triplicate and imaged after 24 h. (B) Quantification of the collagen gel area, analyzed as in A. Values represent averages ± SEMs from three independent experiments. (C) Cells as in A were grown in trans-well inserts. The lower chamber was loaded with medium containing EGF (10 ng/mL). Sixteen hours later, cells that had migrated across the membrane were stained with crystal violet and photographed. (Scale bars, 500 μm.) (D) Average migration ± SEM from three independent experiments performed as in C; quantification is described in SI Appendix. **P < 0.01.
Fig. 2.
Fig. 2.
CAF p53 is hypophosphorylated. (A) Extracts from immortalized NFs and CAFs (patient 4731) were subjected to either standard SDS/PAGE (Top) or 30 µM Phos-tag SDS/PAGE (Bottom), followed by Western blot analysis with the indicated antibodies. (B) The relative abundance of each band in the Phos-tag gel, denoted by its position in the autoradiogram.
Fig. 3.
Fig. 3.
CAF p53 regulates genes associated with ECM remodeling. (A) SPIN-ordered expression matrix of genes differentially expressed between immortalized NFs and CAFs (patient 4731) (fold-change >1.5 and adjusted P value <0.05; 1,662 genes). Colors indicate relative expression after standardizing each gene (Left bar). (B) Dendrogram showing hierarchical clustering of data from transcriptome analysis of duplicate control and p53-depleted CAF and NF samples (average linkage, Pearson correlation). (C) p53-dependent genes in CAFs (fold-change >1.5 between shLacZ and shp53 in both replicates; 300 genes) were extracted from the set of genes more abundantly expressed in CAFs compared with NFs. Expression levels in both CAFs and NFs were visualized by SPIN-ordered expression matrix; colors indicate relative expression after standardizing each gene (Left bar). Pathway enrichment analysis (GeneAnalytics) for genes expressed preferentially and activated by p53 in CAFs is shown on the Right. (D) Quantification of MMP1, MMP3, and MMP10 mRNA from immortalized fibroblasts (patient 4731) by qRT-PCR. Values (mean ± SEM) were derived from five independent experiments. ***P ≤ 0.001 using one-way ANOVA and Tukey post hoc test. SPIN, sorting points into neighborhood; TSR, thrombospondin type I repeat.
Fig. 4.
Fig. 4.
p53 regulates the CAF secretome. (A) Conditioned media of immortalized fibroblasts (patient 4731) were subjected to LC-MS analysis. The heatmap was generated using differentially secreted proteins between CAFshLacZ and CAFshp53 (fold-change >1.5 and adjusted P value <0.05 in four repeats; total = 58 proteins). Colors indicate relative expression (Top bar). (B) Pathway enrichment analysis (GeneAnalytics) for secreted proteins expressed differentially between CAFshLacZ and shp53. (C) Relative abundance of the indicated proteins in CM from immortalized CAFs and NFs, with and without p53 silencing, deduced from the LC-MS analysis. Bars represent normalized LFQ intensities. Values (mean ± SEM) were derived from four independent experiments. *P ≤ 0.05, **P < 0.01, ***P ≤ 0.001 using one-way ANOVA and Tukey post hoc test. LC-MS, liquid chromatography-MS; LFQ, label-free quantification.
Fig. 5.
Fig. 5.
CAFs promote p53-dependent cancer cell migration and invasion. (A) GFP-expressing immortalized fibroblasts from patient 4731 (yellow) and mCherry-expressing Calu1 cells (magenta) were seeded in 12-well plates containing ibidi culture inserts. The next day, inserts were removed and cells were allowed to migrate. Shown are images snap-captured at 6 h. The thin yellow line on the right indicates the position of the Calu1 front at time = 0. (Scale bars, 100 μm.) (B) Average velocity of Calu1 migration toward the indicated fibroblasts, relative to migration of tumor cells alone, based on 6-h measurements. Values are means ± SEMs of three independent experiments, **P < 0.01. (C) mCherry-labeled H460 cells were seeded together with the indicated immortalized fibroblasts and subjected to a trans-well migration assay toward EGF. mCherry-positive cells that had migrated across the membrane were photographed 16 h later. (Scale bars, 500 μm.) (D) Live cell migration analysis as in A, except that cultures were supplemented with CM from the indicated fibroblasts (listed below the panel) after removal of the insert. (Scale bars, 100 μm.) (E) Average velocity of Calu1 cell migration toward the fibroblasts as assayed in D, relative to the CAFshp53-CM samples. CL-CM, CAFshLacZ-CM; Cp-CM, CAFshp53-CM. Values are means ± SEMs of three independent experiments, *P < 0.05. (F) Calu1 cells were grown in trans-well inserts, and the lower chamber was loaded with CM from the different indicated fibroblasts. Sixteen hours later, migrated cells were stained with crystal violet and photographed. (Scale bars, 500 μm.) (G) Calu1 cells were grown in Matrigel-coated trans-well inserts, and the lower chamber was loaded with CM from the different indicated fibroblasts. Twenty hours later, cells that had invaded across the membrane were stained with crystal violet and photographed. (Scale bars, 500 μm.) (H) Average migration ± SEMs from three independent experiments performed as in F; quantification is described in SI Appendix. **P < 0.01 using one-way ANOVA and Tukey post hoc test. (I) Average invasion ± SEMs from three independent experiments performed as in G, quantified as in H. **P < 0.01 using one-way ANOVA and Tukey post hoc test. FC, fold-change.
Fig. 6.
Fig. 6.
Tumor cells promote p53-dependent expression of CAF-associated genes in cocultured NFs. (A) SPIN-ordered expression matrix of genes up-regulated in a p53-dependent manner in immortalized NFs (patient 4731) cocultured with H460 cells, isolated by FACS sorting before RNA extraction. The upper portion of the heatmap is enlarged on the right side of the panel, to highlight the subset of genes also expressed highly in monocultured CAFs. Top Right shows mean fold-change relative to control (column 1) in each pair of replicate samples, calculated for the 77 genes shown in the enlarged panel. (B) Pathway enrichment analysis (GeneAnalytics) of the 77 genes in the right matrix in A. (C) Expression of MMP1, MMP3, and MMP10 mRNA in immortalized CAFs and NFs, grown as monoculture or cocultured with H460 cells and FACS-sorted before RNA extraction. The monoculture data are the same as in Fig. 3D and are included only for comparison. Values are means ± SEMs from four independent experiments. (D) Expression of MMP1, MMP10, POSTN, and SULF1 mRNA in immortalized NFs (patient 4731), grown as monoculture or cocultured with H1299 cells, and FACS-sorted before RNA extraction. Values are means ± SEMs from at least three independent experiments. *P ≤ 0.05, **P < 0.01, and ***P ≤ 0.001 using one-way ANOVA and Tukey post hoc test. SPIN, sorting points into neighborhood.
Fig. 7.
Fig. 7.
CAF p53 promotes tumor growth in SCID mice. mCherry-expressing H460 cells (5 × 10⁵) were injected, either alone or together, with 1.5 × 10⁶ immortalized NFs or CAFs (patient 4731) stably expressing either shLacZ or shp53, into the right flank of male SCID mice (n = 6 per group; total inoculation volume = 80 µL). (A) Tumors were excised and photographed 9 d later. (B) Relative tumor size was deduced from the photograph by calculating the tumor area with Fiji software (values are means ± SEM from six mice in each group). No Fib, no fibroblasts.

References

    1. Bieging KT, Mello SS, Attardi LD. Unravelling mechanisms of p53-mediated tumour suppression. Nat Rev Cancer. 2014;14:359–370. - PMC - PubMed
    1. Zhang Y, Lozano G. p53: Multiple facets of a Rubik’s cube. Annu Rev Cancer Biol. 2017;1:185–201. - PMC - PubMed
    1. Vousden KH, Prives C. Blinded by the light: The growing complexity of p53. Cell. 2009;137:413–431. - PubMed
    1. Aylon Y, Oren M. The paradox of p53: What, how, and why? Cold Spring Harb Perspect Med. 2016;6:a026328. - PMC - PubMed
    1. Kastenhuber ER, Lowe SW. Putting p53 in context. Cell. 2017;170:1062–1078. - PMC - PubMed

Publication types

MeSH terms

Substances