. 2018 Apr 22;9(6):671.
doi: 10.1038/s41419-018-0587-9.

Metabolic patterns in insulin-resistant male hypogonadism

Affiliations

Metabolic patterns in insulin-resistant male hypogonadism

Federica Gevi et al. Cell Death Dis. .

Abstract

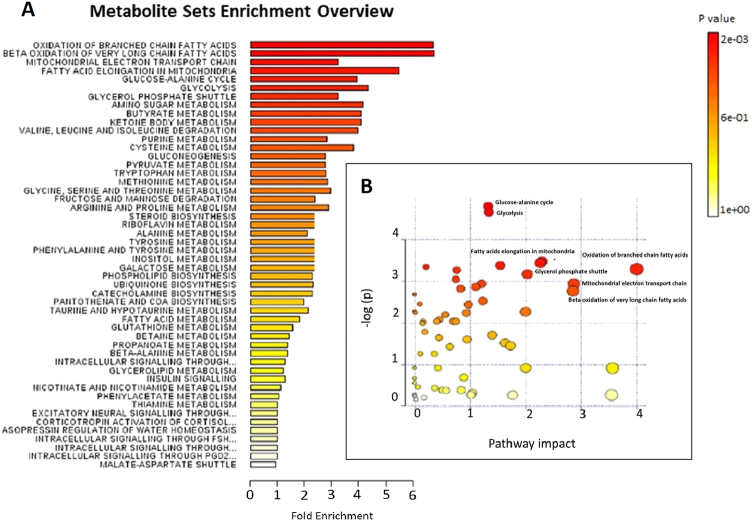
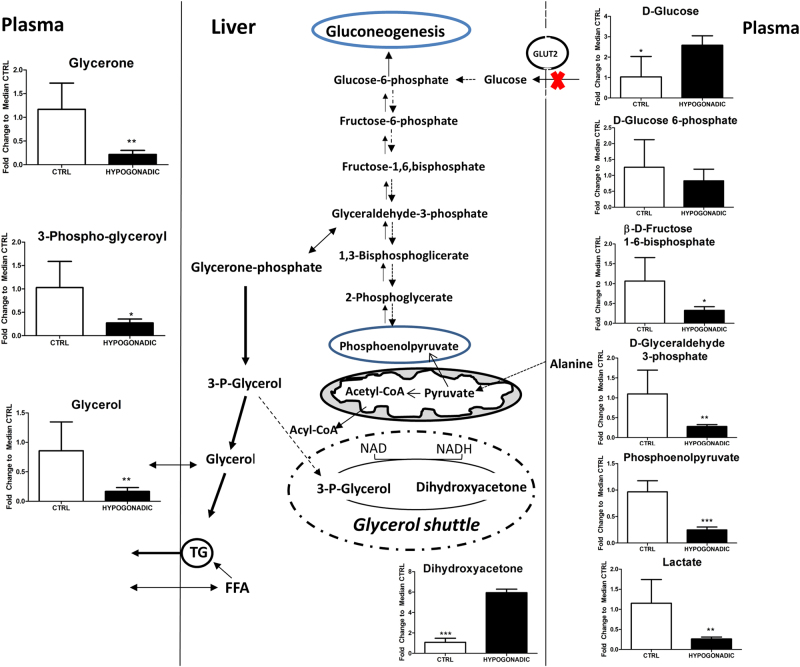
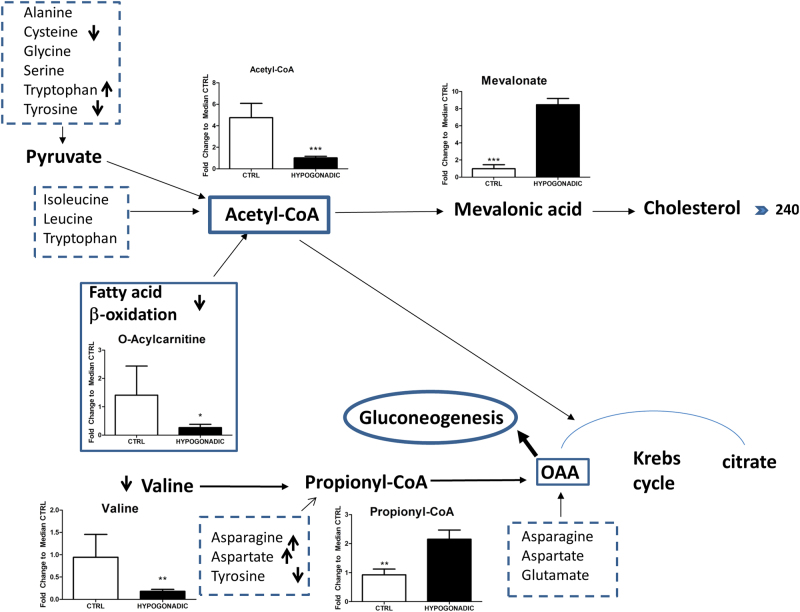
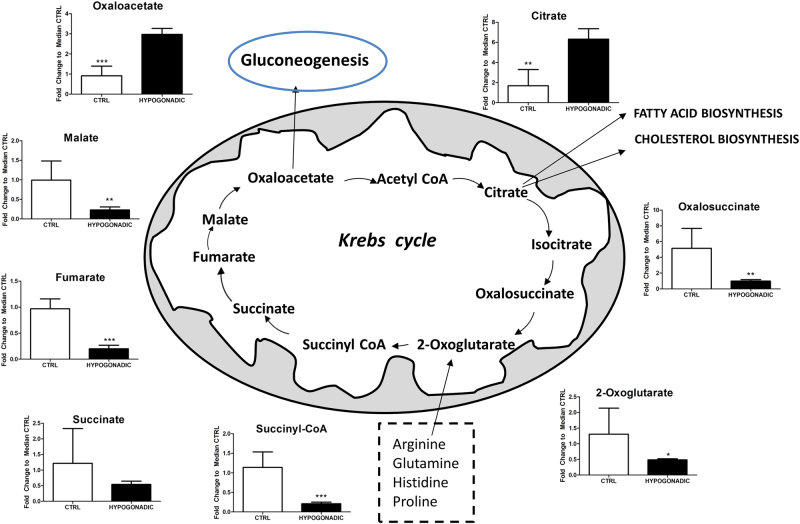
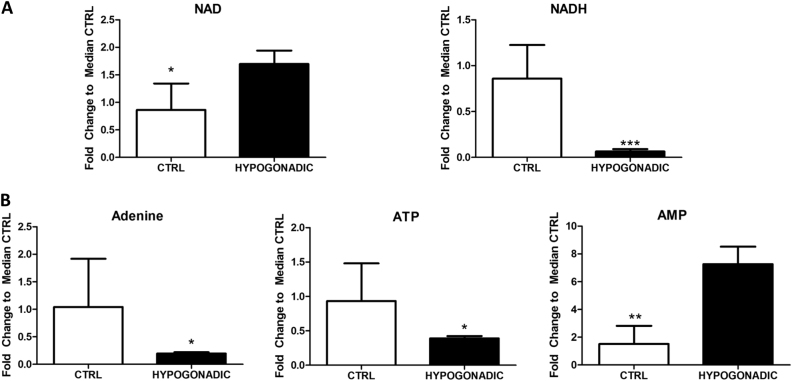
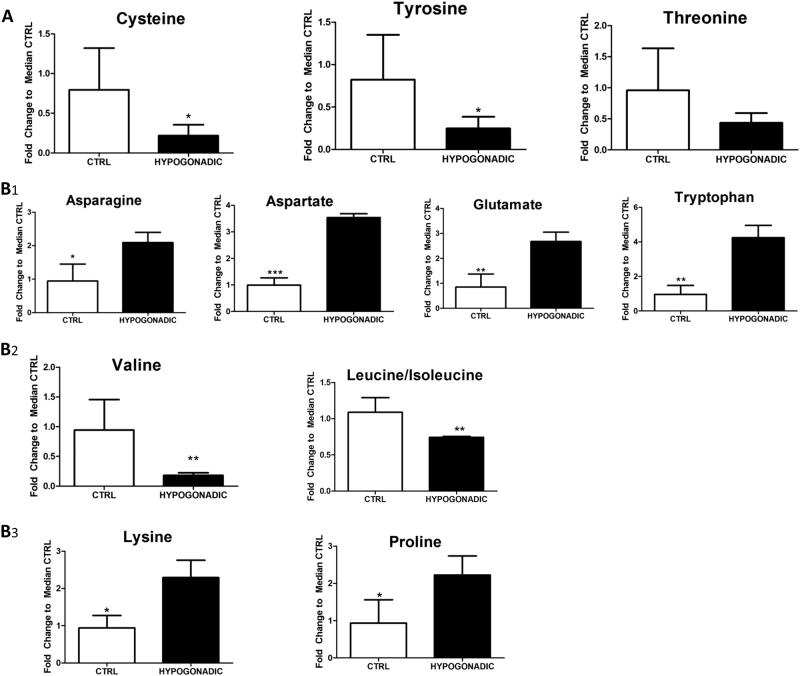
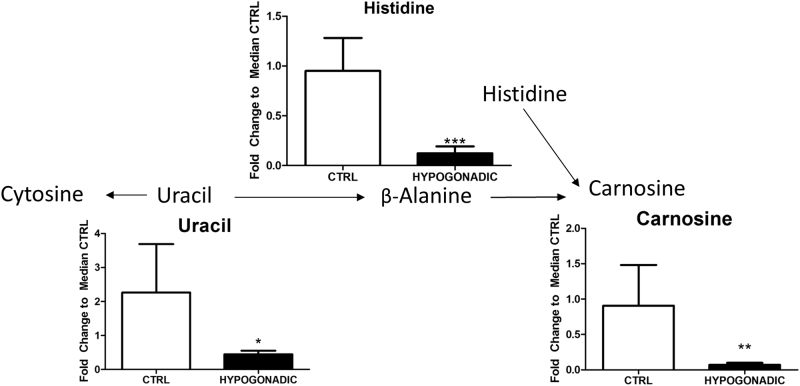
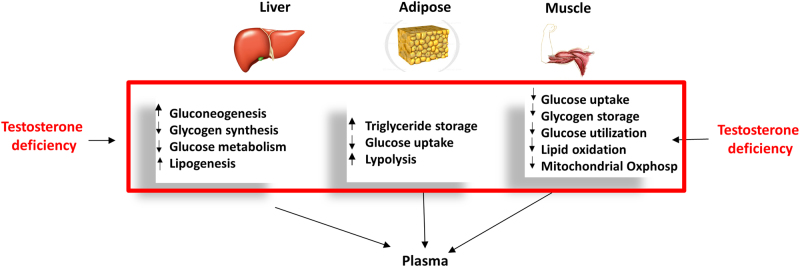
Male hypogonadism associated with insulin resistance (IR) very often leads to metabolic syndrome, at variance with hypogonadism in its first stadium of insulin sensitivity (IS). A plasma metabolomic investigation of these patients can provide useful information in comparison with the values of IS patients. To this aim plasma from insulin-resistant males with hypogonadism were analysed by using ultra high-performance liquid chromatography (UHPLC) and high-resolution mass spectrometry (HRMS). Thus, metabolites were compared to the controls through multivariate statistical analysis and grouped by metabolic pathways. Metabolite database searches and pathway analyses identified imbalances in 18-20 metabolic pathways. Glucose metabolism (e.g., glycolysis and the Krebs cycle) is fuelled by amino acids degradation, in particular of branched amino acids, in individuals with lean body mass. Gluconeogenesis is strongly activated. Some crucial pathways such as glycerol are skewed. Mitochondrial electron transport is affected with a reduction in ATP production. Beta-oxidation of short and medium chain fatty acids did not represent an energy source in hypogonadism, at variance with long and branched fatty acids, justifying the increase in fat mass. Carnosine and β-alanine are strongly reduced resulting in increased fatigue and mental confusion. A comparison of IR with IS male hypogonadism will contribute to a better understanding of how these two hormones work in synergy or antagonise each other in humans. It could also help to select patients who will respond to hormone treatment, and provide accurate biomarkers to measure the response to treatment eventually leading to better strategies in preventing systemic complications in patients not fit for hormone replacement therapy.


Conflict of interest statement

The authors declare that they have no conflict of interest.

Figures

Fig. 1
Fig. 1
Metabolic Set Enrichment Analysis showing the most altered metabolisms as revealed in the plasma of hypogonadal men. Colour intensity (white-to-red) reflects increasing statistical significance, while the circle diameter covaries with pathway impact. The graph was obtained by plotting –log of p-values from pathway enrichment analysis on the y-axis the and the pathway impact values derived from pathway topology analysis on the x-axis. (a) Metabolic Pathway Analysis (MetPA). All the matched pathways are displayed as circles. The colour and size of each circle are based on the p-value and pathway impact value, respectively. The graph was obtained by plotting on the y-axis the −log of p values from the pathway enrichment analysis and on the x-axis the pathway impact values derived from the pathway topology analysis (b)
Fig. 2
Fig. 2
Intermediates of glycolysis and glycerol shuttling represented as the fold change of differences from control subjects vs hypogonadal patients. The total amount of glycolytic metabolites in the plasma appears to be reduced with respect to the levels in the control subjects. The columns present are expressed as the mean ± SD (n = 15) of the fold change in the metabolite concentration over hypogonadal plasma. *p < 0.05, **p < 0.01 ***p < 0.001 against hypogonadal men
Fig. 3
Fig. 3
Metabolisms involved in Acetyl-CoA consumption or production as the main metabolite in glycolytic altered metabolism. Acetyl-CoA levels are strongly decreased in the plasma of hypogonadic men. Metabolites measured in the plasma are represented as the fold change of differences from control subjects vs hypogonadal patients. OAA is significantly re-increased as it is a precursor of gluconeogenesis produced from valine, asparagine, aspartate or tyrosine via fumarate. The columns present are expressed as the mean ± SD (n = 15) of the fold change in the metabolite concentration over hypogonadal plasma. *p < 0.05, **p < 0.01, ***p < 0.001 against hypogonadism
Fig. 4
Fig. 4
Intermediates of TCA measured in the plasma of hypogonadal patients, revealing that this metabolic pathway was strongly reduced. Metabolite levels are expressed as the mean ± SD (n = 15) of the fold change in the metabolite concentration over hypogonadal plasma. *p < 0.05, **p < 0.01, ***p < 0.001 against hypogonadal men
Fig. 5
Fig. 5
NAD, NADH, AMP and ATP changes in hypogonadism. Reduced Krebs cycle activity and glycerol shuttling induced reduced production of NADH (a) in hypogonadism, as well as that of ATP (b), both of which were paralleled by increase concentrations of NAD and AMP. Metabolite levels are expressed as the mean ± SD (n = 15) of the fold change in the metabolite concentration over hypogonadal plasma. *p < 0.05, **p < 0.01 ***p < 0.001 against hypogonadal men
Fig. 6
Fig. 6
In insulin-resistant hypogonadism, some plasma amino acids were significantly reduced, while others were increased. Amino acids are represented as fold change of the differences from control subjects vs. hypogonadal patients. (a) Plasma amino acids reduced. (b1) Plasma amino acids that were significantly increased. (b2) Branched-chain amino acids (BCAAs): leucine, isoleucine and valine. (b3) Proline and lysine: amino acids that participate to form collagen fibres
Fig. 7
Fig. 7
Metabolism of the production of carnosine from β-alanine. The metabolites are represented as the fold change of differences from control subjects vs hypogonadal patients. The columns present are expressed as the mean ± SD (n = 15) of the fold change in the metabolite concentration over hypogonadal plasma. *p < 0.05, **p < 0.01 ***p < 0.001 against hypogonadal men
Fig. 8
Fig. 8
Schematic representation of the metabolisms affected by testosterone deficiency in the three main tissues affected by hypogonadism. Boxes report metabolisms notoriously altered by testosterone deficiency (increased or decreased). This figure also shows that plasma from a male with hypogonadism is the biofluid in which the metabolites are passively excreted from all other tissues

References

    1. Muraleedharan V, Jones TH. Testosterone and the metabolic syndrome. Ther. Adv. Endocrinol. Metab. 2010;5:207–223. doi: 10.1177/2042018810390258. - DOI - PMC - PubMed
    1. Naifar M, et al. Male hypogonadism and metabolic syndrome. Andrologia. 2010;47:579–586. doi: 10.1111/and.12305. - DOI - PubMed
    1. Hamilton EJ, et al. Increase in visceral and subcutaneous abdominal fat in men with prostate cancer treated with androgen deprivation therapy. Clin. Endocrinol. 2011;74:377–383. doi: 10.1111/j.1365-2265.2010.03942.x. - DOI - PubMed
    1. Gianatti EJ, et al. Effect of testosterone treatment on glucose metabolism in men with type 2 diabetes: a randomized controlled trial. Diabetes Care. 2014;37:2098–2107. doi: 10.2337/dc13-2845. - DOI - PubMed
    1. Jones TH, et al. Testosterone replacement in hypogonadal men with type 2 diabetes and/or metabolic syndrome (the TIMES2 Study) Diabetes Care. 2011;34:828–837. doi: 10.2337/dc10-1233. - DOI - PMC - PubMed

Publication types

LinkOut - more resources