

Sorting nexin 10 controls mTOR activation through regulating amino-acid metabolism in colorectal cancer
- PMID: 29867114
- PMCID: PMC5986761
- DOI: 10.1038/s41419-018-0719-2
Sorting nexin 10 controls mTOR activation through regulating amino-acid metabolism in colorectal cancer
Abstract
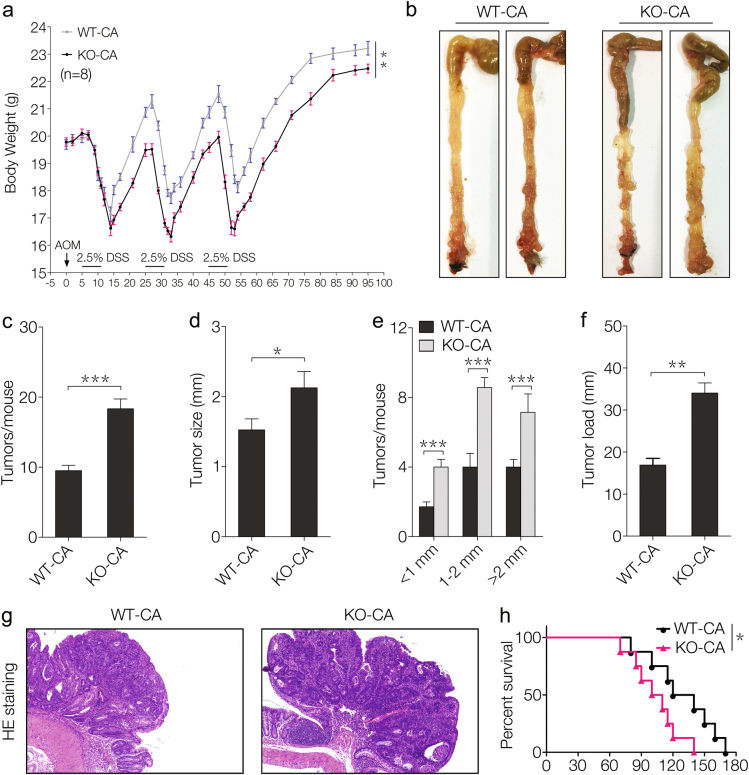
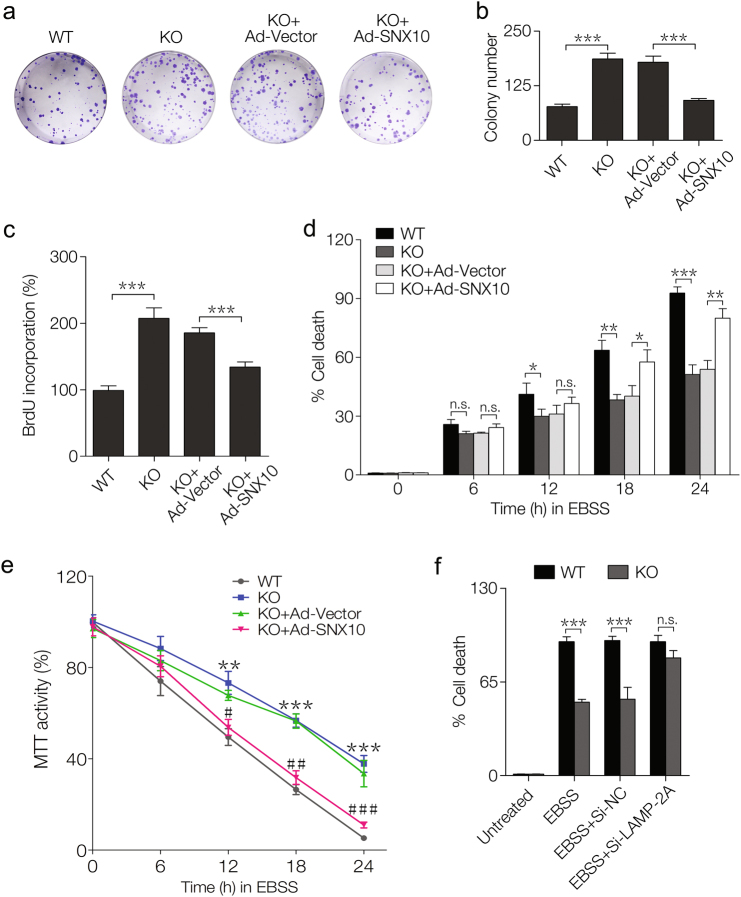
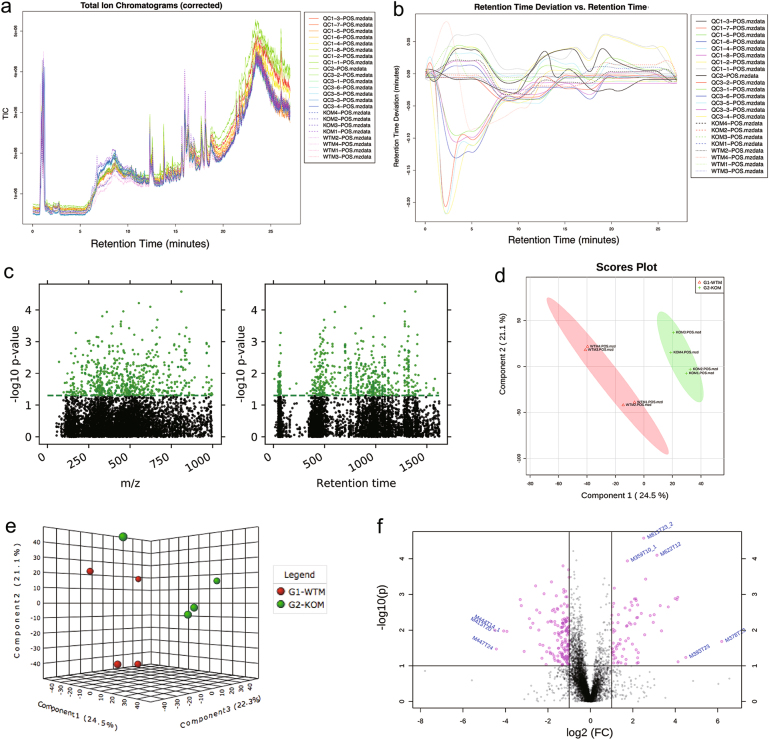
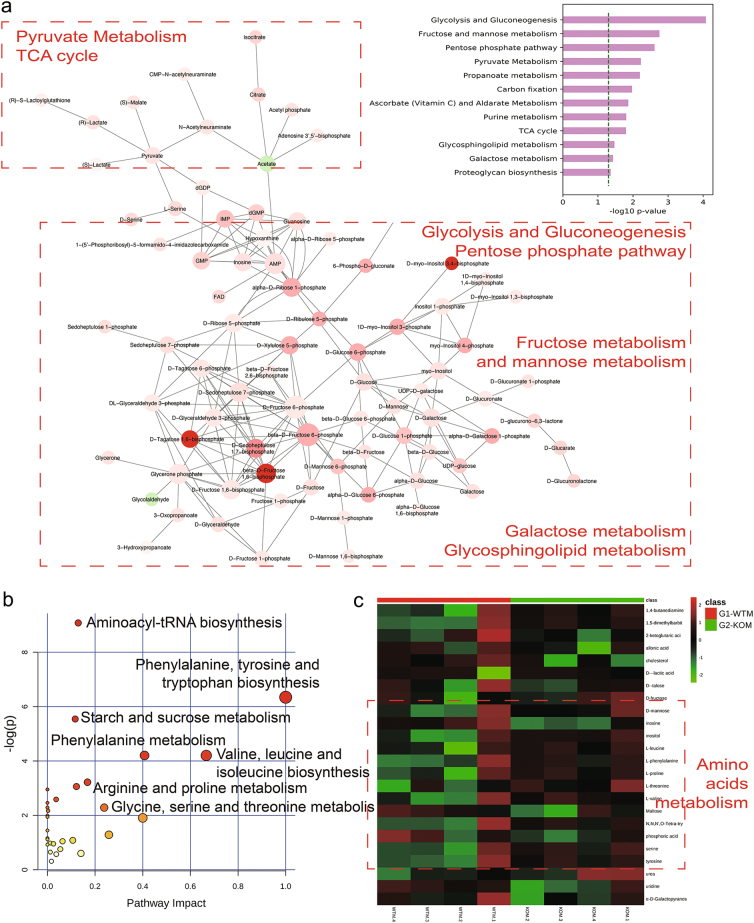
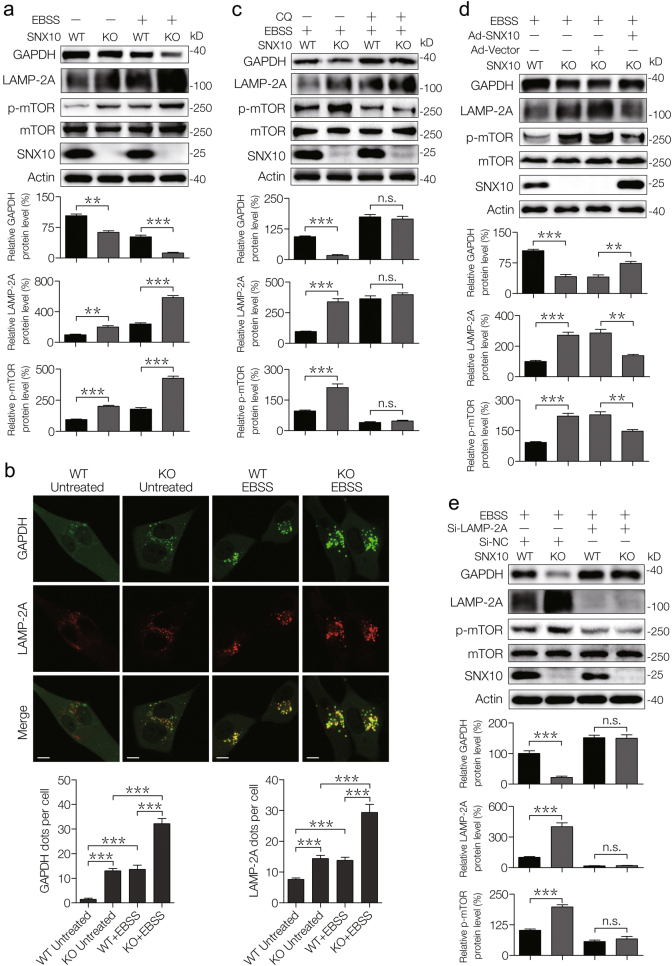
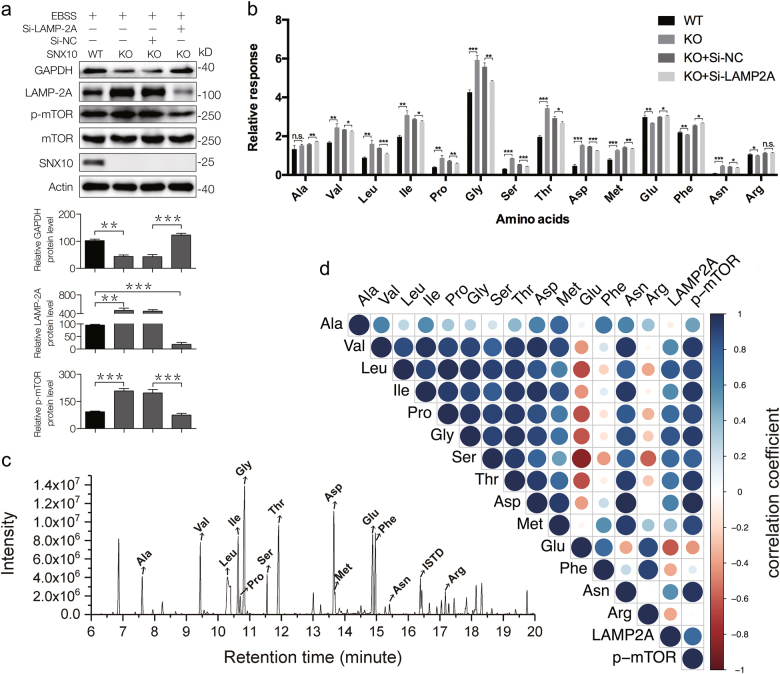
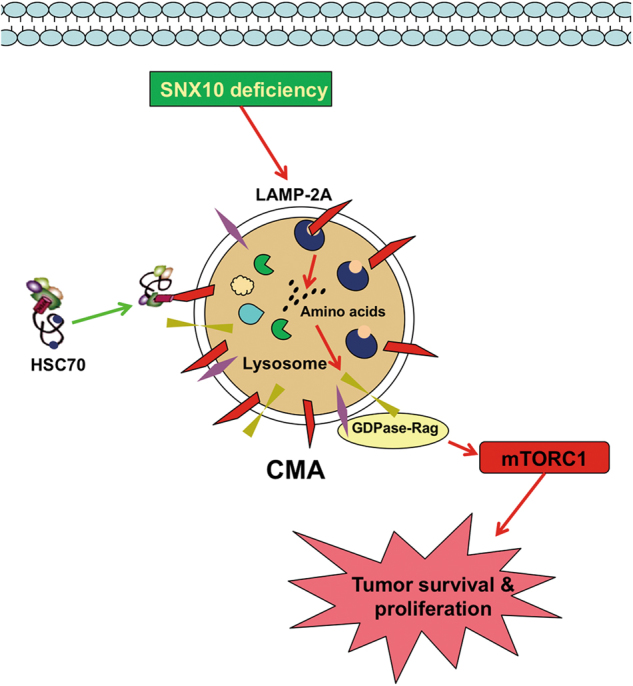
Amino-acid metabolism plays a vital role in mammalian target of rapamycin (mTOR) signaling, which is the pivot in colorectal cancer (CRC). Upregulated chaperone-mediated autophagy (CMA) activity contributes to the regulation of metabolism in cancer cells. Previously, we found that sorting nexin 10 (SNX10) is a critical regulator in CMA activation. Here we investigated the role of SNX10 in regulating amino-acid metabolism and mTOR signaling pathway activation, as well as the impact on the tumor progression of mouse CRC. Our results showed that SNX10 deficiency promoted colorectal tumorigenesis in male FVB mice and CRC cell proliferation and survival. Metabolic pathway analysis of gas chromatography-mass spectrometry (GC-MS) data revealed unique changes of amino-acid metabolism by SNX10 deficiency. In HCT116 cells, SNX10 knockout resulted in the increase of CMA and mTOR activation, which could be abolished by chloroquine treatment or reversed by SNX10 overexpression. By small RNA interference (siRNA), we found that the activation of mTOR was dependent on lysosomal-associated membrane protein type-2A (LAMP-2A), which is a limiting factor of CMA. Similar results were also found in Caco-2 and SW480 cells. Ultra-high-performance liquid chromatography-quadrupole time of flight (UHPLC-QTOF) and GC-MS-based untargeted metabolomics revealed that 10 amino-acid metabolism in SNX10-deficient cells were significantly upregulated, which could be restored by LAMP-2A siRNA. All of these amino acids were previously reported to be involved in mTOR activation. In conclusion, this work revealed that SNX10 controls mTOR activation through regulating CMA-dependent amino-acid metabolism, which provides potential target and strategy for treating CRC.
Conflict of interest statement
The authors declare that they have no conflict of interest.
Figures
Similar articles
-
Sorting nexin 10 acts as a tumor suppressor in tumorigenesis and progression of colorectal cancer through regulating chaperone mediated autophagy degradation of p21Cip1/WAF1.Cancer Lett. 2018 Apr 10;419:116-127. doi: 10.1016/j.canlet.2018.01.045. Cancer Lett. 2018. PMID: 29355659
-
SNX10 mediates alcohol-induced liver injury and steatosis by regulating the activation of chaperone-mediated autophagy.J Hepatol. 2018 Jul;69(1):129-141. doi: 10.1016/j.jhep.2018.01.038. Epub 2018 Feb 13. J Hepatol. 2018. PMID: 29452206
-
SNX10 (sorting nexin 10) inhibits colorectal cancer initiation and progression by controlling autophagic degradation of SRC.Autophagy. 2020 Apr;16(4):735-749. doi: 10.1080/15548627.2019.1632122. Epub 2019 Jul 4. Autophagy. 2020. PMID: 31208298 Free PMC article.
-
Regulation of autophagy by amino acids and MTOR-dependent signal transduction.Amino Acids. 2015 Oct;47(10):2037-63. doi: 10.1007/s00726-014-1765-4. Epub 2014 Jun 1. Amino Acids. 2015. PMID: 24880909 Free PMC article. Review.
-
Chaperone-mediated autophagy.Autophagy. 2007 Jul-Aug;3(4):295-9. doi: 10.4161/auto.4144. Epub 2007 Jul 15. Autophagy. 2007. PMID: 17404494 Review.
Cited by
-
Sorting nexin 10 sustains PDGF receptor signaling in glioblastoma stem cells via endosomal protein sorting.JCI Insight. 2023 Mar 22;8(6):e158077. doi: 10.1172/jci.insight.158077. JCI Insight. 2023. PMID: 36795488 Free PMC article.
-
Identification of specific role of SNX family in gastric cancer prognosis evaluation.Sci Rep. 2022 Jun 17;12(1):10231. doi: 10.1038/s41598-022-14266-y. Sci Rep. 2022. PMID: 35715463 Free PMC article.
-
Construction and Analysis of Human Diseases and Metabolites Network.Front Bioeng Biotechnol. 2020 Apr 30;8:398. doi: 10.3389/fbioe.2020.00398. eCollection 2020. Front Bioeng Biotechnol. 2020. PMID: 32426349 Free PMC article.
-
Effect of Early Pathogenic Escherichia coli Infection on the Intestinal Barrier and Immune Function in Newborn Calves.Front Cell Infect Microbiol. 2022 Feb 21;12:818276. doi: 10.3389/fcimb.2022.818276. eCollection 2022. Front Cell Infect Microbiol. 2022. PMID: 35265533 Free PMC article.
-
SNX9 determines the surface levels of integrin β1 in vascular endothelial cells: Implication in poor prognosis of human colorectal cancers overexpressing SNX9.J Cell Physiol. 2019 Aug;234(10):17280-17294. doi: 10.1002/jcp.28346. Epub 2019 Feb 19. J Cell Physiol. 2019. PMID: 30784076 Free PMC article.
References
-
- American Cancer Society. Cancer facts and figures 2015. https://www.cancer.org/acs/groups/content/@editorial/documents/document/... (2015).
-
- Nappi, A. et al. Metastatic colorectal cancer: role of target therapies and future perspectives. Preprint at 10.2174/1568009617666170209095143 (2017). - PubMed
Publication types
MeSH terms
Substances
Grants and funding
LinkOut - more resources
Full Text Sources
Other Literature Sources
Medical
Molecular Biology Databases
Miscellaneous
