. 2018 Jun 4;9(6):674.
doi: 10.1038/s41419-018-0718-3.

RAGE-dependent mitochondria pathway: a novel target of silibinin against apoptosis of osteoblastic cells induced by advanced glycation end products

Affiliations

RAGE-dependent mitochondria pathway: a novel target of silibinin against apoptosis of osteoblastic cells induced by advanced glycation end products

Y X Mao et al. Cell Death Dis. .

Abstract

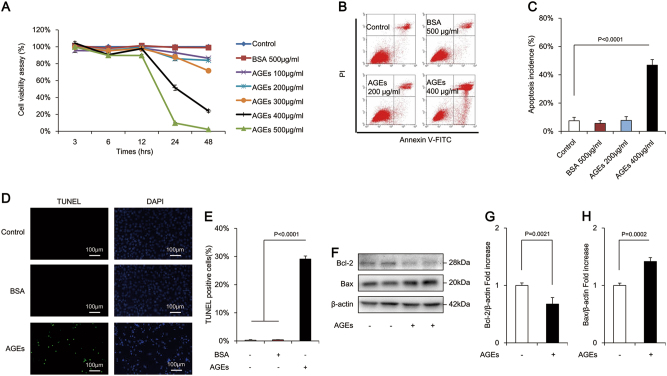
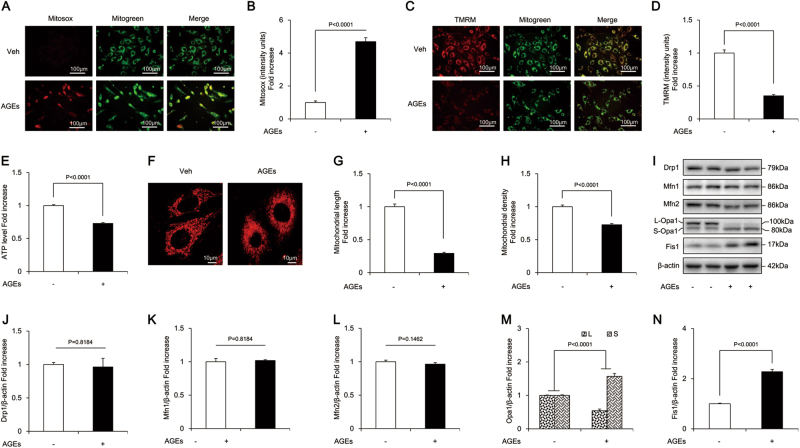
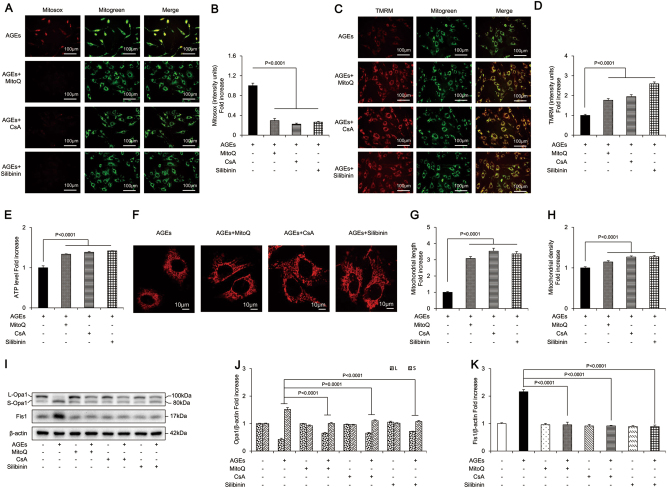
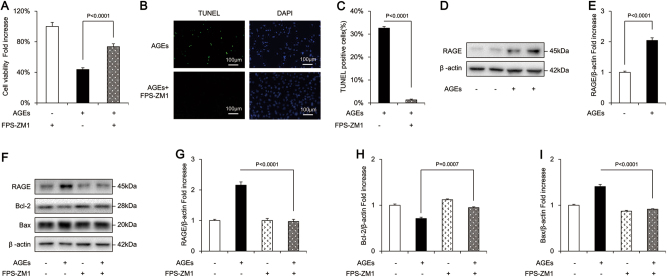
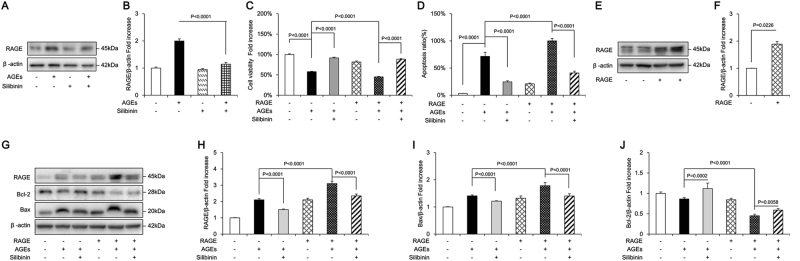
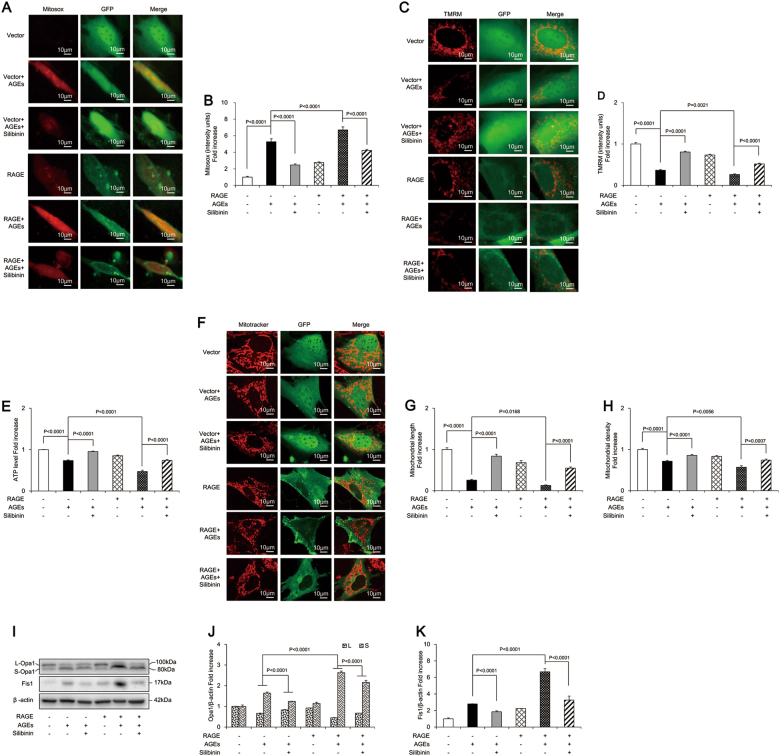
Advanced glycation end products (AGEs) can stimulate osteoblast apoptosis and have a critical role in the pathophysiology of diabetic osteoporosis. Mitochondrial abnormalities are closely related to osteoblast dysfunction. However, it remains unclear whether mitochondrial abnormalities are involved in AGE-induced osteoblastic cell apoptosis. Silibinin, a major flavonolignan compound of silimarin, has strong antioxidant and mitochondria-protective properties. In the present study, we explored the possible mitochondrial mechanisms underlying AGE-induced apoptosis of osteoblastic cells and the effect of silibinin on osteoblastic cell apoptosis. We demonstrated that mitochondrial abnormalities largely contributed to AGE-induced apoptosis of osteoblastic cells, as evidenced by enhanced mitochondrial oxidative stress, conspicuous reduction in mitochondrial membrane potential and adenosine triphosphate production, abnormal mitochondrial morphology, and altered mitochondrial dynamics. These AGE-induced mitochondrial abnormalities were mainly mediated by the receptor of AGEs (RAGE). In addition, we found that silibinin directly downregulated the expression of RAGE and modulated RAGE-mediated mitochondrial pathways, thereby preventing AGE-induced apoptosis of osteoblastic cells. This study not only provides a new insight into the mitochondrial mechanisms underlying AGE-induced osteoblastic cell apoptosis, but also lays a foundation for the clinical use of silibinin for the prevention or treatment of diabetic osteoporosis.


Conflict of interest statement

The authors declare that they have no conflict of interest.

Figures

Fig. 1
Fig. 1. AGEs-induced apoptosis in osteoblastic MC3T3-E1 cells.
a Cell viability was determined by MTT reduction in osteoblastic cells in the presence of AGEs. Error bars indicate SEM (n = 6). b, c Flow cytometric quantification of apoptosis. Error bars indicate SEM (n = 6). d, e TUNEL staining and assay. Error bars indicate SEM (n = 300). Scale bars = 100 μm. f Representative immunoreactive bands for Bcl-2 and Bax in osteoblastic cells in the presence of AGEs. Full-length blots are presented in Supplementary Figure 4. g Quantification of immunoreactive bands for Bcl-2 and Bax relative to β-actin. Error bars indicate SEM (n = 6)
Fig. 2
Fig. 2. AGEs-induced mitochondrial abnormalities in osteoblastic MC3T3-E1 cells.
a, b Representative images showing MitoSOX staining and quantification in the indicated groups. Scale bars = 100 μm. c, d Representative images with TMRM staining and quantification in the indicated groups. Scale bars = 100 μm. e ATP production in the indicated groups. fh Representative images of mitochondrial morphology, and measurements of mitochondrial length and density in the indicated groups. Error bars indicate SEM (n = 15) Scale bars = 10 μm. in Representative immunoreactive bands and quantification of immunoreactive bands for Drp1, Mfn1, Mfn2, Opa1, and Fis1 in osteoblasts in the presence of AGES. Error bars indicate SEM (n = 6). Full-length blots are presented in Supplementary Figure 4
Fig. 3
Fig. 3. MitoQ, CsA, and silibinin attenuated AGEs-induced apoptosis in osteoblastic MC3T3-E1 cells.
a Cell viability determined by MTT reduction in osteoblastic cells in the presence of AGEs with or without MitoQ or CsA. Error bars indicate SEM (n = 6). b, c TUNEL staining and assay after treatment with MitoQ or CsA. Error bars indicate SEM (n = 300). Scale bars = 100 μm. d Representative immunoreactive bands for Bcl-2 and Bax in osteoblastic cells with (+) or without (−) treatment of MitoQ or CsA in the presence of AGEs (+) or culture medium (−). eg Quantification of immunoreactive bands for Bcl-2 and Bax relative to β-actin. Error bars indicate SEM (n = 6). Full-length blots are presented in Supplementary Figure 4
Fig. 4
Fig. 4. MitoQ, CsA, and silibinin attenuated mitochondrial abnormalities in osteoblastic MC3T3-E1 cells.
a, b Representative images showing MitoSOX staining and quantification in the indicated groups. Scale bars = 100 μm. c, d Representative images showing TMRM staining and quantification in the indicated groups. Scale bars = 100 μm. e ATP production in the indicated groups. fh Representative images of mitochondrial morphology and measurements of mitochondrial length and density in the indicated groups. Error bars indicate SEM (n = 15). Scale bars = 10 μm. ik Representative immunoreactive bands for Opa1 and Fis1 in osteoblastic cells in the presence of AGEs. Quantification of immunoreactive bands for Opa1 and Fis1 relative to β-actin. Error bars indicate SEM (n = 6). Full-length blots are presented in Supplementary Figure 4
Fig. 5
Fig. 5. FPS-ZM1 attenuated AGEs-induced apoptosis in osteoblastic MC3T3-E1 cells.
a Cell viability determined by MTT reduction in osteoblastic cells in the presence of AGEs with or without FPS-ZM1. Error bars indicate SEM (n = 6). b, c TUNEL staining and assay after FPS-ZM1 treatment. Error bars indicate SEM (n = 300). Scale bars = 100 μm. d, f Representative immunoreactive bands for RAGE, Bcl-2, and Bax in osteoblast with (+) or without (−) FPS-ZM1 treatment in the presence of AGES (+) or culture medium (−). Full-length blots are presented in Supplementary Figure 4. e, g, h, i Quantification of immunoreactive bands for RAGE, Bcl-2, and Bax relative to β-actin. Error bars indicate SEM (n = 6)
Fig. 6
Fig. 6. FPS-ZM1 attenuated AGEs-induced mitochondrial abnormalities in osteoblastic MC3T3-E1 cells.
a, b Representative images showing MitoSOX staining and quantification in the indicated groups. Scale bars = 100 μm. c, d Representative images showing TMRM staining and quantification in the indicated groups. Scale bars = 100 μm. e ATP production in the indicated groups. fh Representative images of mitochondrial morphology, and measurements of mitochondrial length and density in the indicated groups. Error bars indicate SEM (n = 15). Scale bars = 10 μm. ik Representative immunoreactive bands for Opa1 and Fis1 in osteoblastic cells in the presence of AGEs. Quantification of immunoreactive bands for Opa1 and Fis1 relative to β-actin. Error bars indicate SEM (n = 6). Full-length blots are presented in Supplementary Figure 4
Fig. 7
Fig. 7. Silibinin protects AGEs-induced osteoblastic MC3T3-E1 cells apoptosis through modulation of RAGE.
a, b Representative immunoreactive bands and relative levels of RAGE in osteoblastic cells with (+) or without (−) silibinin treatment in the presence of AGEs (+) or culture medium (−). c Cell viability determined by MTT reduction in osteoblastic cells treated with (+) or without (−) silibinin in the presence of AGEs (+). Error bars indicate SEM (n = 6). d Hoechst staining assay in the indicated groups. Error bars indicate SEM (n = 300). e, f Representative immunoreactive bands and relative levels of RAGE in osteoblastic cells transfected with plasmids carrying empty vectors or RAGE genes. g Representative immunoreactive bands for RAGE, Bcl-2, and Bax in in the indicated groups; hj Quantification of immunoreactive bands for RAGE, Bcl-2, and Bax relative to β-actin. Error bars indicate SEM (n = 6). Full-length blots are presented in Supplementary Figure 4
Fig. 8
Fig. 8. Silibinin prevented AGEs-induced osteoblastic MC3T3-E1 cells apoptosis through RAGE-dependent mitochondrial pathway.
a, b Representative images showing MitoSOX staining and quantification in the indicated groups. Scale bars = 10 μm. c, d Representative images showing TMRM staining and quantification in the indicated groups. Scale bars = 10 μm. e ATP production in the indicated groups. fh Representative images of mitochondrial morphology, and measurements of mitochondrial length and density in the indicated groups. Error bars indicate SEM (n = 15). Scale bars = 10 μm. i Representative immunoreactive bands for Opa1 and Fis1 in osteoblastic cells in the presence of AGEs. Full-length blots are presented in Supplementary Figure 4. j, k Quantification of immunoreactive bands for Opa1 and Fis1 relative to β-actin. Error bars indicate SEM (n = 6)

References

    1. Hofbauer LC, Lecka-Czernik B, Seibel MJ. Sweet and brittle: diabetes mellitus and the skeleton. Bone. 2016;82:1. doi: 10.1016/j.bone.2015.09.001. - DOI - PubMed
    1. Rachner TD, Khosla S, Hofbauer LC. Osteoporosis: now and the future. Lancet. 2011;377:1276–1287. doi: 10.1016/S0140-6736(10)62349-5. - DOI - PMC - PubMed
    1. Brownlee M. Advanced protein glycosylation in diabetes and aging. Annu. Rev. Med. 1995;46:223–234. doi: 10.1146/annurev.med.46.1.223. - DOI - PubMed
    1. Yamagishi S, Fukami K, Matsui T. Crosstalk between advanced glycation end products (AGEs)-receptor RAGE axis and dipeptidyl peptidase-4-incretin system in diabetic vascular complications. Cardiovasc. Diabetol. 2015;14:2. doi: 10.1186/s12933-015-0176-5. - DOI - PMC - PubMed
    1. Yamagishi S. Role of advanced glycation end products (AGEs) in osteoporosis in diabetes. Curr. Drug. Targets. 2011;12:2096–2102. doi: 10.2174/138945011798829456. - DOI - PubMed

Publication types

MeSH terms