. 2018 Jun 4;9(1):2160.
doi: 10.1038/s41467-018-04594-x.

Resolving molecule-specific information in dynamic lipid membrane processes with multi-resonant infrared metasurfaces

Affiliations

Resolving molecule-specific information in dynamic lipid membrane processes with multi-resonant infrared metasurfaces

Daniel Rodrigo et al. Nat Commun. .

Abstract

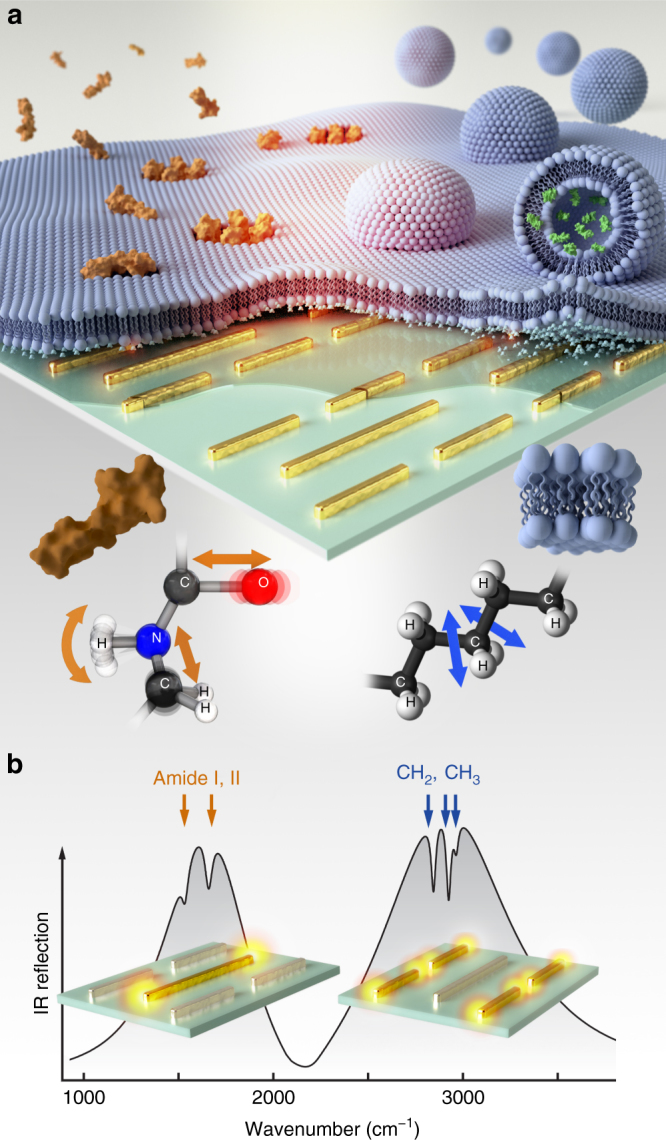
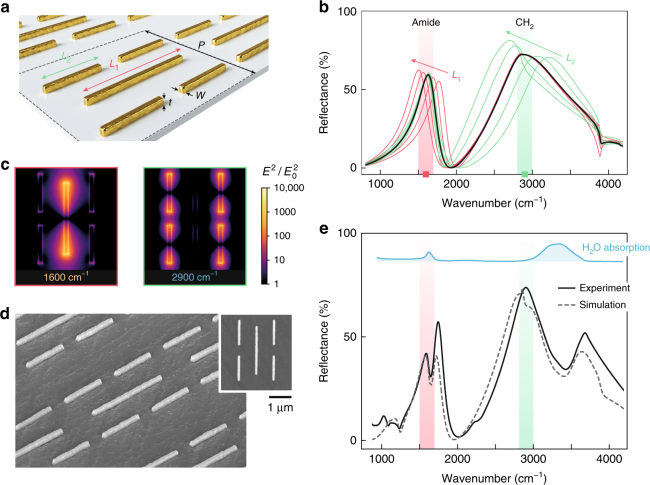
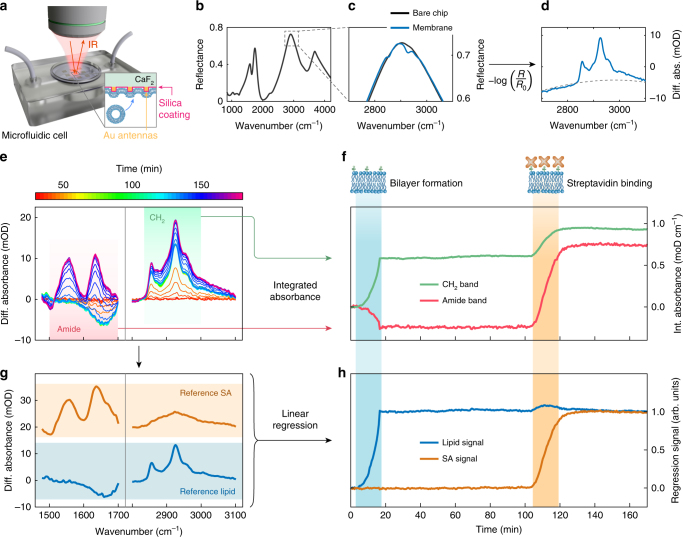
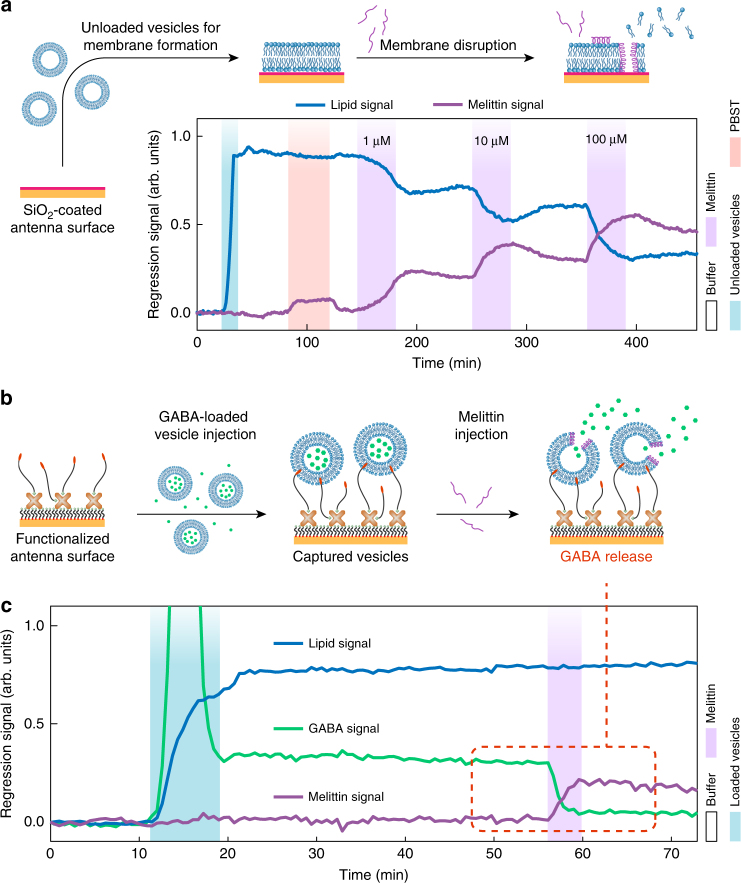
A multitude of biological processes are enabled by complex interactions between lipid membranes and proteins. To understand such dynamic processes, it is crucial to differentiate the constituent biomolecular species and track their individual time evolution without invasive labels. Here, we present a label-free mid-infrared biosensor capable of distinguishing multiple analytes in heterogeneous biological samples with high sensitivity. Our technology leverages a multi-resonant metasurface to simultaneously enhance the different vibrational fingerprints of multiple biomolecules. By providing up to 1000-fold near-field intensity enhancement over both amide and methylene bands, our sensor resolves the interactions of lipid membranes with different polypeptides in real time. Significantly, we demonstrate that our label-free chemically specific sensor can analyze peptide-induced neurotransmitter cargo release from synaptic vesicle mimics. Our sensor opens up exciting possibilities for gaining new insights into biological processes such as signaling or transport in basic research as well as provides a valuable toolkit for bioanalytical and pharmaceutical applications.


Conflict of interest statement

The authors declare no competing interests.

Figures

Fig. 1
Fig. 1
Nanophotonic label-free biosensor for chemically distinguishing multiple analytes in biological samples. a Multi-resonant mid-IR nanoantennas are leveraged to enhance the vibrational–absorption signals associated with biomimetic lipid membrane formation, polypeptide/membrane interaction, and vesicular cargo release on the sensor surface. b Antenna resonance positions are engineered to simultaneously overlap with the vibrational signatures of both the amide I, II, and the CH2, CH3 absorption bands, allowing for the simultaneous enhancement and detection of lipid- and protein-induced absorption changes. The 3D model of melittin used in this figure was imported from RSCB Protein Data Bank, DOI: 10.2210/pdb2MLT/pdb, which was deposited by D. Eisenberg, M. Gribskov, and T.C. Terwilliger. All rights reserved
Fig. 2
Fig. 2
Multi-resonant metasurface sensor platform. a Schematic of the multi-resonant mid-IR metasurface composed of two sets of gold nanodipoles (L1 = 1.8 µm, L2 = 0.95 µm, P= 2.6 µm, W=t= 100 nm). b Simulated reflectance spectrum of the multi-resonant metasurface for the nominal design (black curve), and with varying lengths L1 (red curves) and L2 (green curves) in a ±10% range. An immersion media with refractive index n = 1.32 has been considered to represent the aqueous environment. The two resonances are independently adjusted to overlap with amide and CH2 bands. c Near-field distribution of the multi-resonant metasurface parallel to the substrate plane at the amide and CH2 bands. Each set of dipole nanoantennas is excited and exhibits strong near fields (bright yellow color) only for the corresponding resonance frequency. d Scanning electron microscope image of the nanofabricated multi-resonant metasurface. e Experimental reflectance spectra of the multi-resonant metasurface in phosphate buffer saline (PBS) solution. The full frequency–dispersive complex refractive index of water has been considered in the simulated reflectance spectrum. Peak positions agree well with the simulations from (b). The additional dips in the peak lineshapes are due to the absorption bands of water in the mid-IR (blue-shaded area)
Fig. 3
Fig. 3
Simultaneous monitoring of multiple biological analytes. a Schematic of the experimental configuration. b Infrared reflectance spectrum of the multi-resonant sensor chip in PBS buffer solution. c Reflectance spectra before (R0) and after (R) lipid membrane formation in the CH2 band spectral region, magnified from marked area in (b). d Differential absorption spectrum calculated from the reflectance spectra in (c). The dashed line corresponds to the second-order polynomial used for baseline correction. e Color-coded time-dependent differential absorption spectra acquired during the lipid membrane formation and streptavidin-binding experiment. f Time trace of the integrated absorbance signal in the amide (red-shaded area) and CH2 (green-shaded area) bands from (e). The lipid and streptadivin injection steps are indicated by the blue- and orange-shaded areas, respectively. The integrated absorbance signals from the amide (red curve) and CH2 (green curve) bands exhibit pronounced signal modulations during the lipid membrane formation and streptavidin-binding steps, evidencing an inadequate discrimination of the two analytes. g Reference spectra for the lipid (blue-shaded area) and streptavidin (orange-shaded area) signal contributions. h Linear regression signals obtained from the spectral data in (e) with respect to the reference spectra in (g). Linear regression signals for lipid (blue curve) and streptadivin (orange curve) show a significant signal increase only during the corresponding lipid or streptavidin injection step, demonstrating effective chemical discrimination
Fig. 4
Fig. 4
Melittin-induced membrane disruption and vesicular cargo release. a Melittin association to the supported lipid bilayer (SLB) and melittin-induced disruption of the membrane for increasing melittin concentrations (1, 10, and 100 µM). The time evolution of the melittin linear regression signal (purple) shows melittin-membrane association and partial dissociation phases for each melittin injection time step. The increase in melittin signal is accompanied by a clear decrease in the lipid regression signal (blue) evidencing loss-of-membrane integrity, which intensifies with increasing melittin concentrations. b Sketch of the vesicle cargo release experiment. The sensor metasurface is functionalized with hydrophilic tethers displaying cholesterol moieties, which are then used to capture lipid vesicles loaded with the neurotransmitter gamma-aminobutyric acid (GABA). Injection of melittin perforates the lipid vesicle membrane, resulting in a release of GABA cargo molecules. c Time-resolved linear regression signals for the three characteristic biological components in the experiment: lipid, GABA, and melittin. After the injection of GABA-loaded vesicles, successful attachment of intact, loaded vesicles to the surface is corroborated by the stable lipid and GABA regression signals. The strong initial peak of the GABA signal is caused by the transient flow of extravesicular GABA molecules present in the bulk solution. Melittin injection results in a fast and pronounced decrease of the GABA signal, indicating efficient cargo release

References

    1. Fan X, et al. Sensitive optical biosensors for unlabeled targets: a review. Anal. Chim. Acta. 2008;620:8–26. doi: 10.1016/j.aca.2008.05.022. - DOI - PMC - PubMed
    1. Freudiger CW, et al. Label-free biomedical imaging with high sensitivity by stimulated raman scattering microscopy. Science. 2008;322:1857–1861. doi: 10.1126/science.1165758. - DOI - PMC - PubMed
    1. Braiman MS, Rothschild KJ. Fourier transform infrared techniques for probing membrane protein structure. Annu. Rev. Biophys. Biophys. Chem. 1988;17:541–570. doi: 10.1146/annurev.bb.17.060188.002545. - DOI - PubMed
    1. Fan M, Andrade GFS, Brolo AG. A review on the fabrication of substrates for surface enhanced Raman spectroscopy and their applications in analytical chemistry. Anal. Chim. Acta. 2011;693:7–25. doi: 10.1016/j.aca.2011.03.002. - DOI - PubMed
    1. Stuart, B. H. Infrared Spectroscopy: Fundamentals and Applications (John Wiley & Sons, New York, 2005).

Publication types

MeSH terms