. 2018 Jul;15(7):505-511.
doi: 10.1038/s41592-018-0014-2. Epub 2018 Jun 4.

Comprehensive comparative analysis of 5'-end RNA-sequencing methods

Affiliations

Comprehensive comparative analysis of 5'-end RNA-sequencing methods

Xian Adiconis et al. Nat Methods. 2018 Jul.

Erratum in

Abstract

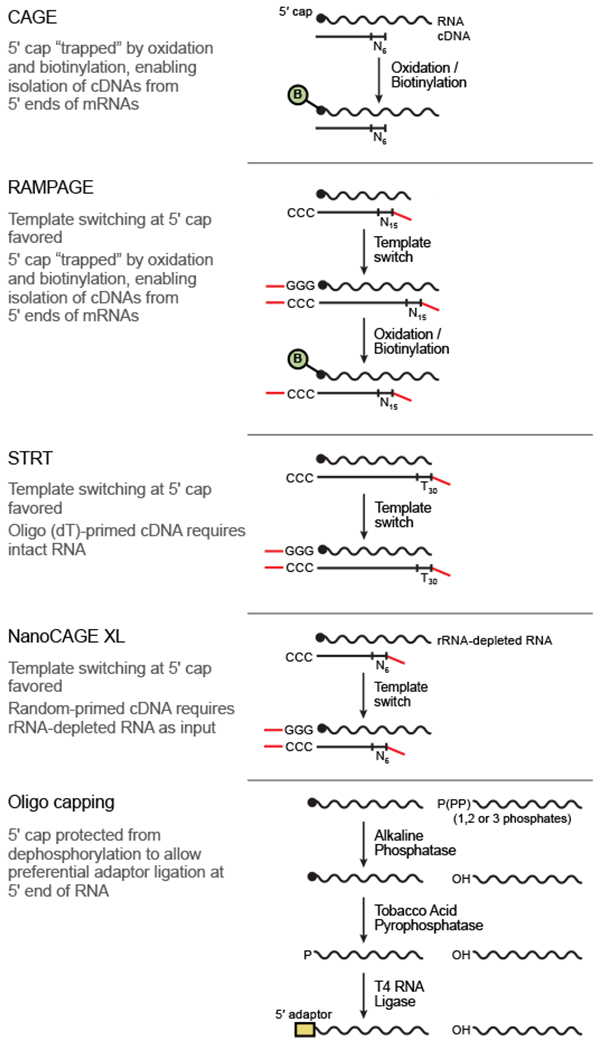
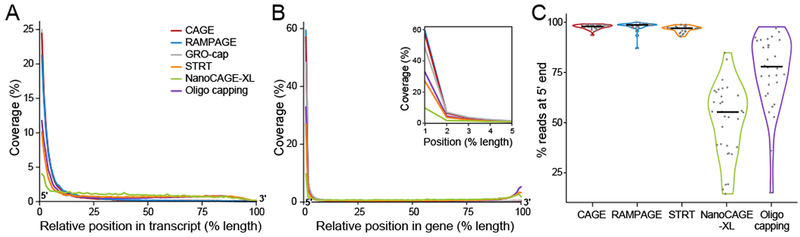
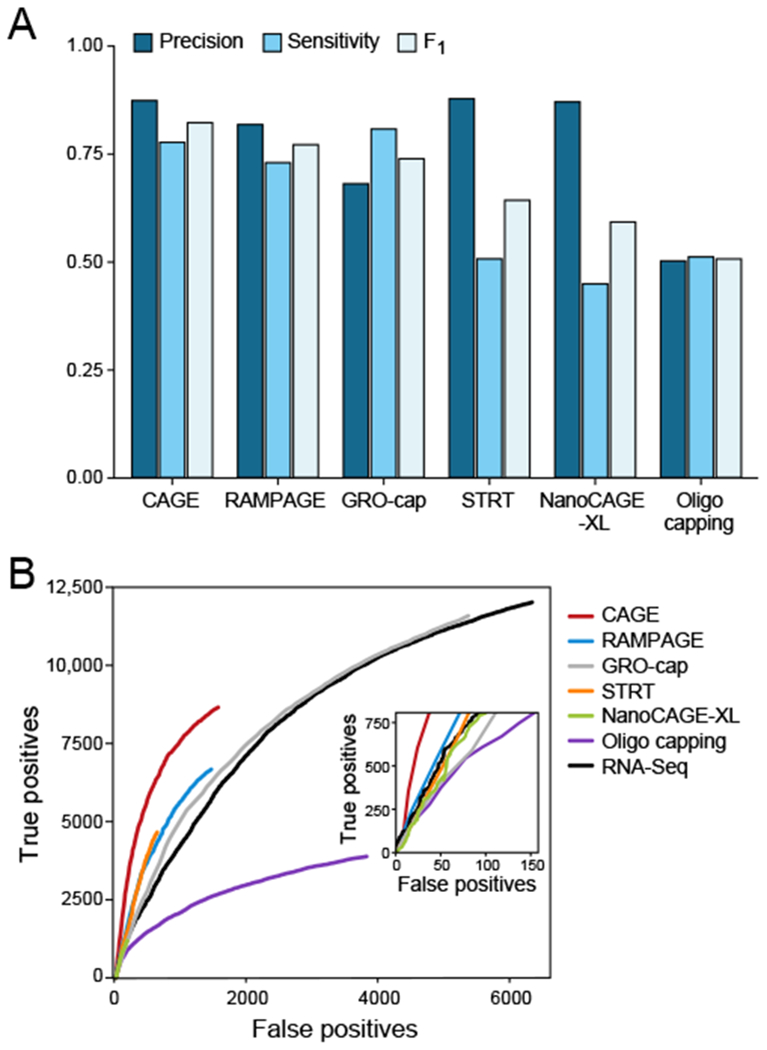
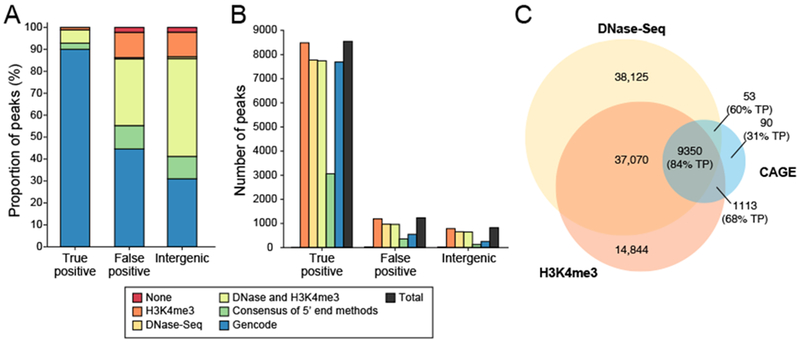
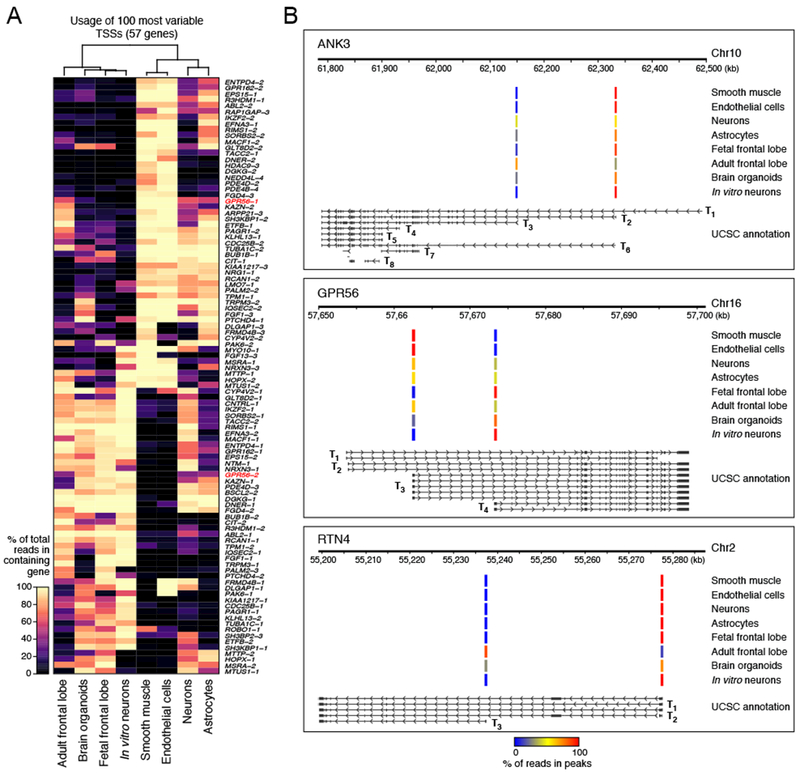
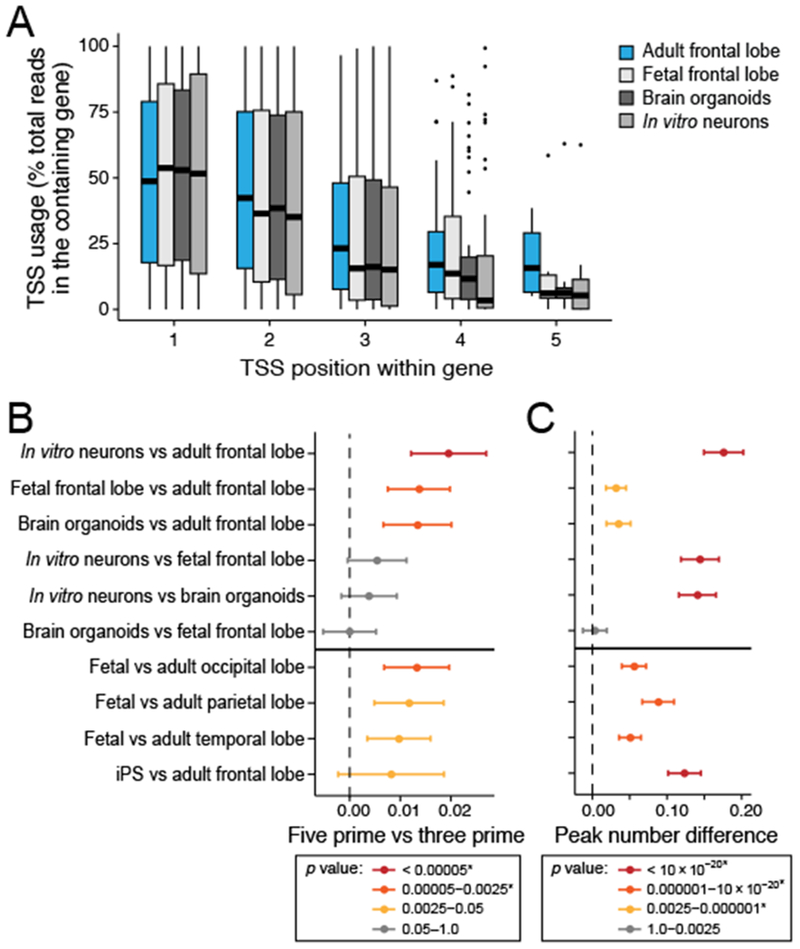
Specialized RNA-seq methods are required to identify the 5' ends of transcripts, which are critical for studies of gene regulation, but these methods have not been systematically benchmarked. We directly compared six such methods, including the performance of five methods on a single human cellular RNA sample and a new spike-in RNA assay that helps circumvent challenges resulting from uncertainties in annotation and RNA processing. We found that the 'cap analysis of gene expression' (CAGE) method performed best for mRNA and that most of its unannotated peaks were supported by evidence from other genomic methods. We applied CAGE to eight brain-related samples and determined sample-specific transcription start site (TSS) usage, as well as a transcriptome-wide shift in TSS usage between fetal and adult brain.


Conflict of interest statement

COMPETING FINANCIAL INTERESTS

The authors declare no competing financial interests.

Figures

Figure 1.
Figure 1.. Methods for 5’ end RNA-Seq.
Salient details for five protocols tested in this paper. Additional properties of these protocols can be found in Supplementary Table 8.
Figure 2.
Figure 2.. Read performance metrics for 5’ end methods.
(a,b) Normalized coverage by position for endogenous transcripts. For each library, shown is the average relative coverage (y-axis) at each relative position along the transcripts’ (a) or genes’ (b) length (x-axis). Intronic regions are included in (b), but not in (a). Inset in (b) shows 5% closest to the 5’ end of genes. (c) 5’ end coverage for spike-ins. For each library, a violin plot shows the % of reads with alignment including position 10 from the 5’ end of each of the 32 spike-in transcripts (y-axis). Median is shown as a black line. For libraries with replicates, data are shown for the “Main” library (Main-1 for CAGE; Online Methods). STRT data presented are for un-capped spike-in RNA, which performed better than capped spike-in RNA. Sample size for each method: n = 1 library per method.
Figure 3.
Figure 3.. TSS peak performance metrics.
(a) Sensitivity, precision, and F1 score (the harmonic mean for sensitivity and precision) – shown for each 5’ end method based on the UCSC annotation (b) ROC curves for each lab method and standard RNA-Seq with inset showing highest confidence region. Sample size for each method: n = 1 library per method, except CAGE is a combination of 3 libraries.
Figure 4.
Figure 4.. TSS discovery for unannotated CAGE peaks.
(a,b) Corroborative data for TSS peaks from CAGE. Shown is the proportion (a) and number (b) of peaks (y axis) with support from each corroborative data source (color legend) for peaks initially defined as ‘true positive’, ‘false positive’ and ‘intergenic’ based on the UCSC annotation. (a) Peaks were assigned to only one category of support based on their corroboration by Gencode annotation, consensus of four best 5’ end methods, DNase-Seq, or H3K4me3 ChIP-Seq data in this order (e.g., a peak corroborated by Gencode is not listed in the other categories even if it has additional support.) (b) Peaks were assigned to as many corroborative categories as evidence supported. (c) TSS prediction with CAGE, DNase-Seq and H3K4me3 ChIP-Seq data. Numbers of peaks shown here in overlapping categories correspond to CAGE peaks for all overlaps involving CAGE peaks and DNase-Seq peaks in the overlap with only H3K4me3 ChIP-Seq peaks. For each subset of CAGE peaks, we also show the % true positives (TPs) out of all the CAGE peaks in that category. Areas not to scale.
Figure 5.
Figure 5.. Differential TSS usage in brain-related samples.
(a) Most variable TSSs across brain-related samples. Shown are the top 100 most significantly differentially used TSSs across the samples (p < 0.001, Fisher’s exact test) ordered by their variance. Sample size for each method: n = 1 library per sample. (b) Specific examples of differential TSS usage. For each gene, shown are the alternative transcripts and TSSs (Ti, bottom) and the scaled values of TSS usage (reads in a peak / all reads in peaks for a given sample) in each sample for each of the alternative TSSs.
Figure 6.
Figure 6.. Adult brain samples preferentially use more downstream TSSs.
(a) Adult frontal lobe used downstream TSSs more often than fetal frontal lobe, brain organoids, and in vitro neurons. Numbering of TSS position within a gene starts from the 5’ end. Box and whisker plot shows the relative TSS usage (y-axis) for all TSS, black bar indicates median value, box edges correspond to the 25th and 75th percentiles, while whiskers indicate a further 1.5*IQR where IQR is the interquartile range. Outliers outside this range are shown as dots. (b) Comparisons of sample pairs showing “younger” samples have more frequent upstream TSS usage in both this study and FANTOM 5. The x-axis is a scaled, normalized difference of the average peak position in each dataset for all genes (Online Methods), with error bars representing 95% confidence intervals. (c) Comparisons of sample pairs showing “younger” samples use, on average, fewer TSS per gene in both this study and FANTOM 5. The x-axis is the average difference of the number of peaks active (defined as overlapping at least one read) in each dataset for all genes (Online Methods), with error bars representing 95% confidence intervals. For (b) and (c), the P values were calculated using a Wilcoxon signed-rank test (Online Methods) and an asterisk indicates a Bonferroni-corrected P value less than 0.05. The P values can be found in the source data spreadsheet file for this figure. For all panels, sample size for each method: n = 1 library per sample, except iPS FANTOM5 combines data for 2 replicate libraries.

References

    1. Heinzen EL, Neale BM, Traynelis SF, Allen AS & Goldstein DB The genetics of neuropsychiatric diseases: looking in and beyond the exome. Annu Rev Neurosci 38, 47–68 (2015). - PubMed
    1. Edwards SL, Beesley J, French JD & Dunning AM Beyond GWASs: illuminating the dark road from association to function. Am J Hum Genet 93, 779–797 (2013). - PMC - PubMed
    1. De Gobbi M et al. A regulatory SNP causes a human genetic disease by creating a new transcriptional promoter. Science 312, 1215–1217 (2006). - PubMed
    1. Davuluri RV, Suzuki Y, Sugano S, Plass C & Huang TH The functional consequences of alternative promoter use in mammalian genomes. Trends Genet 24, 167–177 (2008). - PubMed
    1. Grob TJ et al. Human delta Np73 regulates a dominant negative feedback loop for TAp73 and p53. Cell Death Differ 8, 1213–1223 (2001). - PubMed

Publication types