. 2018 Jul;28(7):730-745.
doi: 10.1038/s41422-018-0053-3. Epub 2018 Jun 4.

Spatial transcriptomic survey of human embryonic cerebral cortex by single-cell RNA-seq analysis

Affiliations

Spatial transcriptomic survey of human embryonic cerebral cortex by single-cell RNA-seq analysis

Xiaoying Fan et al. Cell Res. 2018 Jul.

Abstract

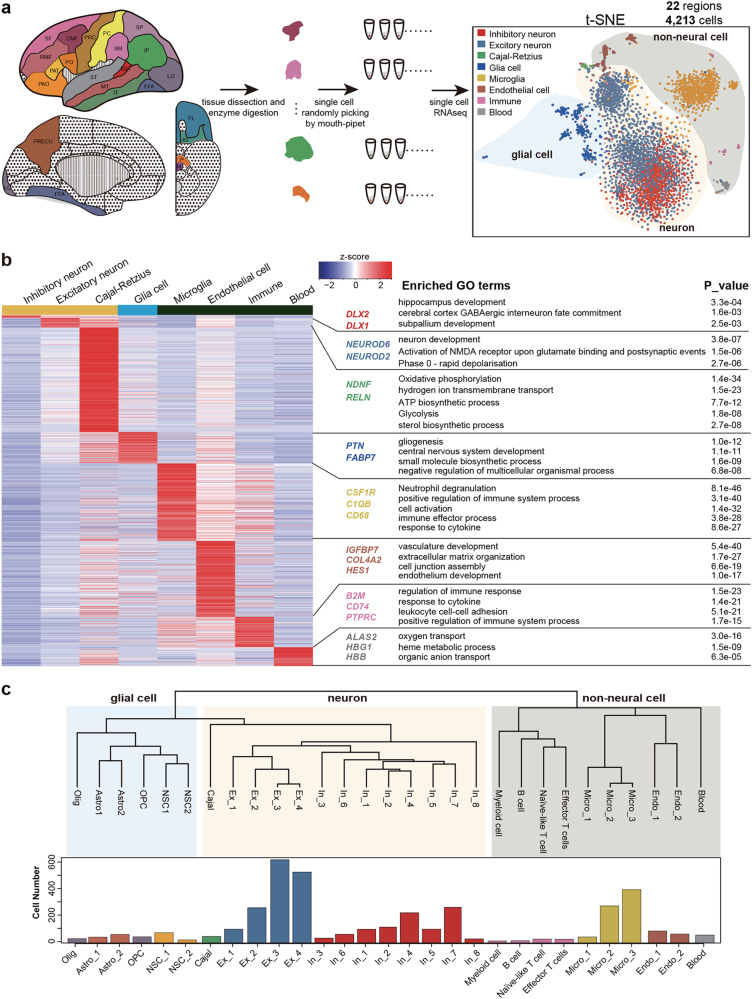
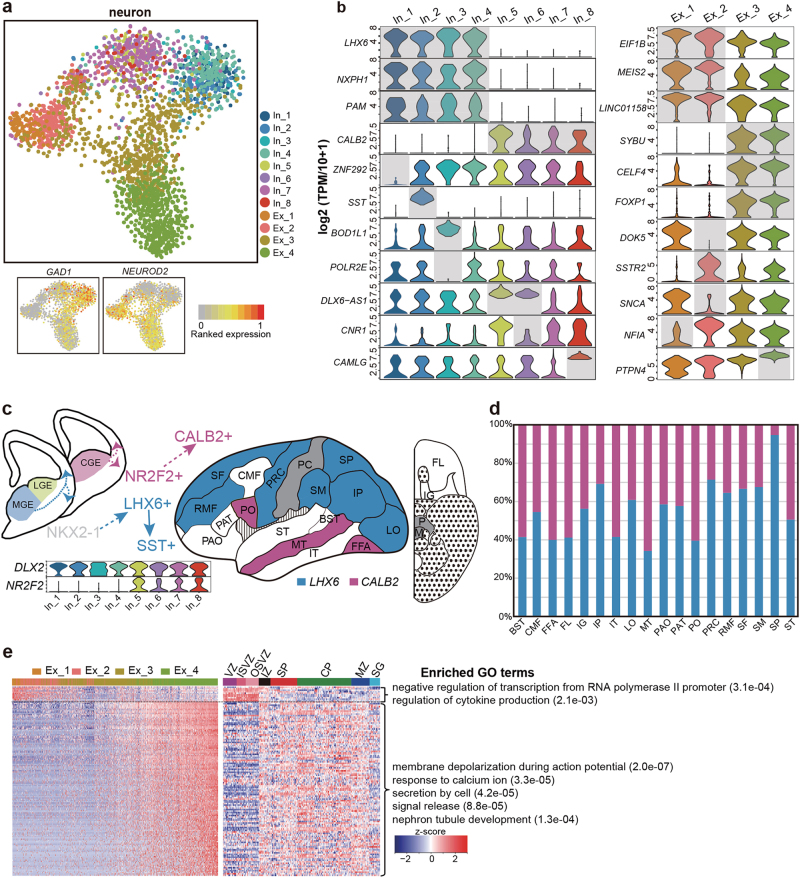
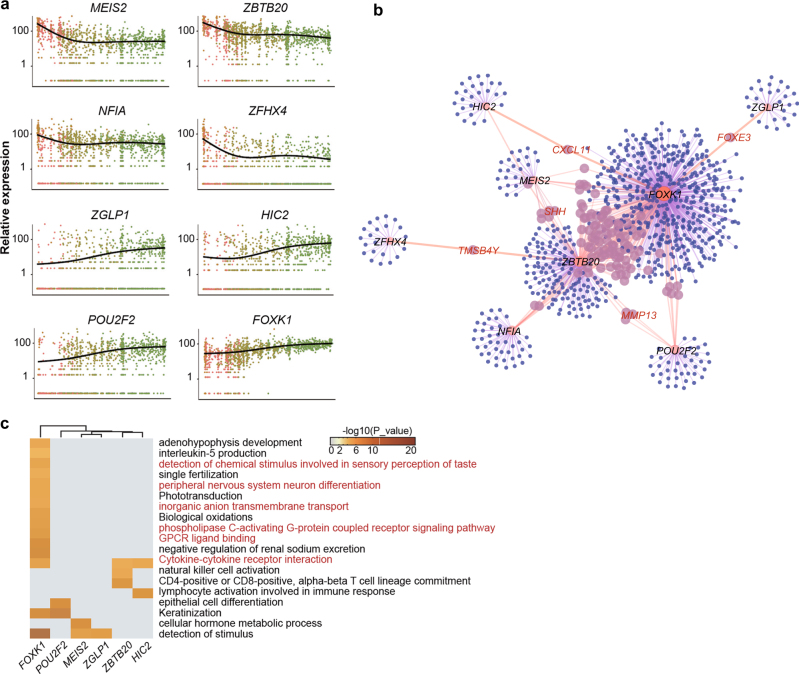
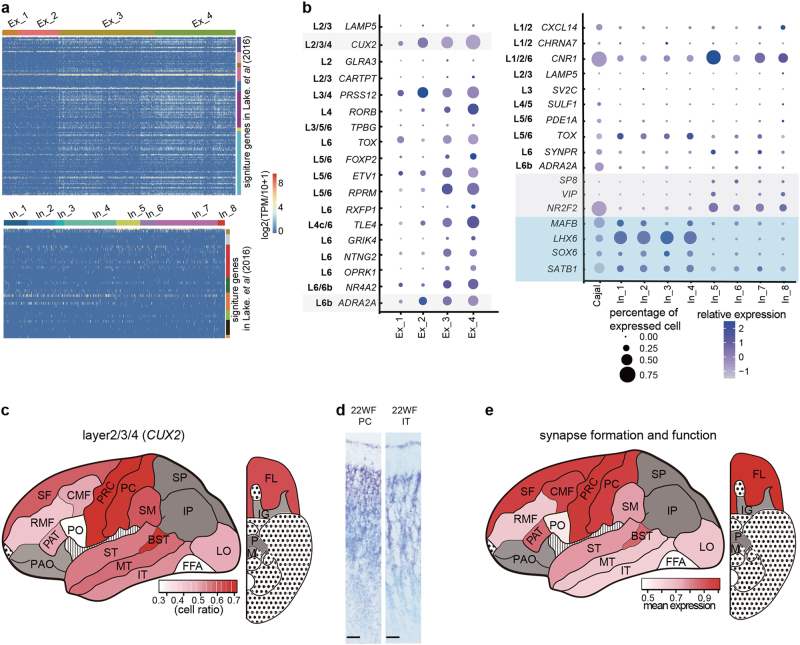
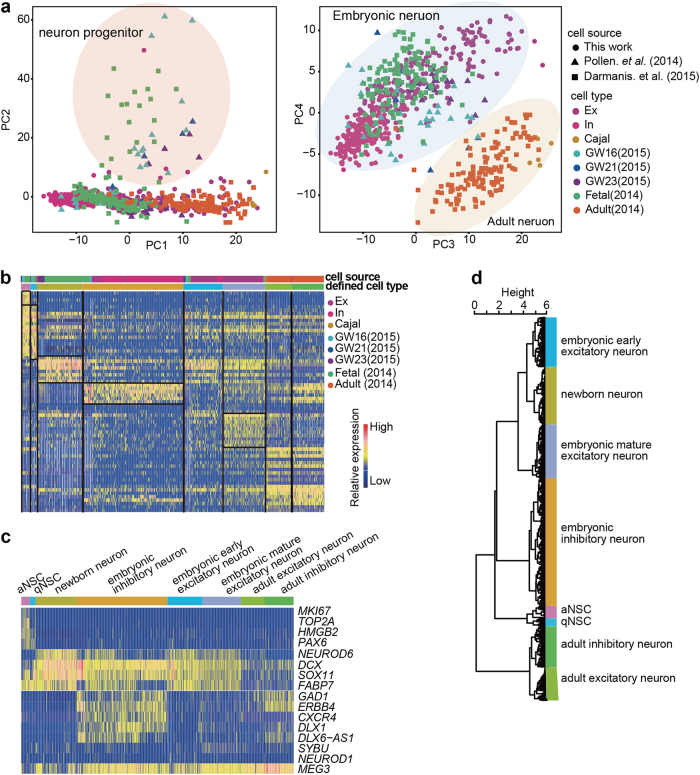
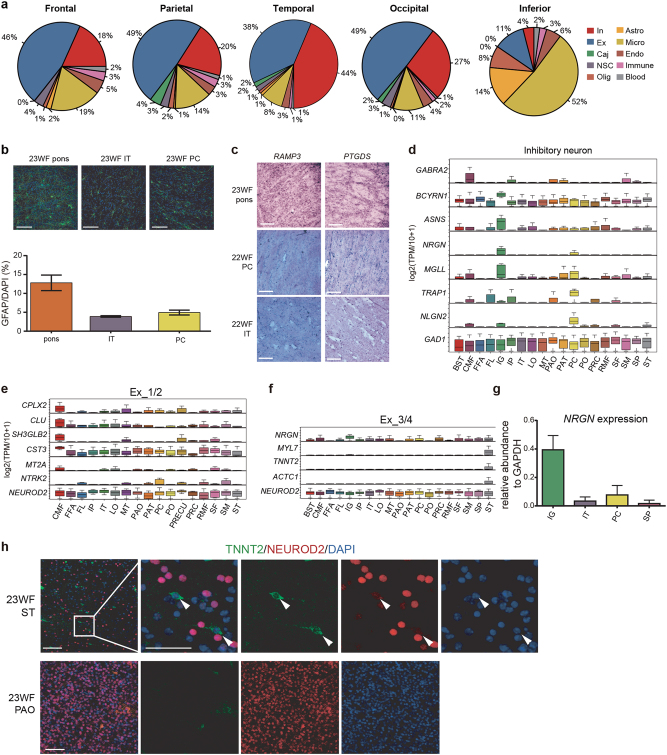
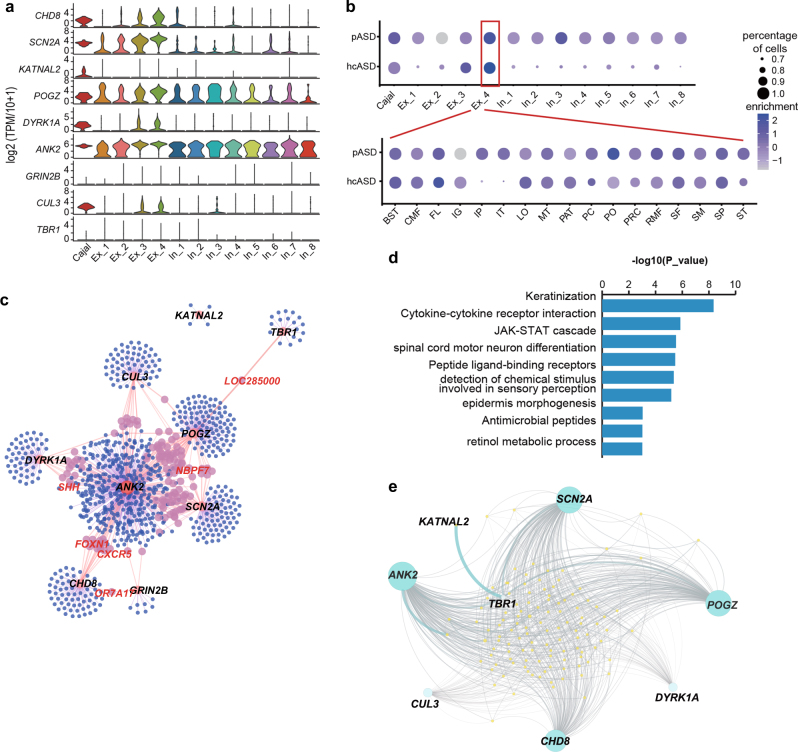
The cellular complexity of human brain development has been intensively investigated, although a regional characterization of the entire human cerebral cortex based on single-cell transcriptome analysis has not been reported. Here, we performed RNA-seq on over 4,000 individual cells from 22 brain regions of human mid-gestation embryos. We identified 29 cell sub-clusters, which showed different proportions in each region and the pons showed especially high percentage of astrocytes. Embryonic neurons were not as diverse as adult neurons, although they possessed important features of their destinies in adults. Neuron development was unsynchronized in the cerebral cortex, as dorsal regions appeared to be more mature than ventral regions at this stage. Region-specific genes were comprehensively identified in each neuronal sub-cluster, and a large proportion of these genes were neural disease related. Our results present a systematic landscape of the regionalized gene expression and neuron maturation of the human cerebral cortex.


Conflict of interest statement

The authors declare no competing interests.

Figures

Fig. 1
Fig. 1
Cell type classification in human embryonic cerebral cortex. a The schematic diagram displaying the dissection of embryonic brain and how we obtained the single cell transcriptome data in 22 regions (for the abbreviations, see Supplementary information, Table S1). t-SNE showed the cell types identified with all the single cells and the shadows mark different general cell types: the blue shade indicates glial cell, the yellow shows neuron and the gray shows non-neural cell that is not supposed to be produced by neural stem cell. b Heatmap displaying the DEGs that were cell type specific in our analysis. The enriched biological processes for each gene group were shown in the right. Classical cell type marker genes were labeled. c Dendrogram showing the relationships of all the 29 sub-clusters and the histogram displaying the cell number in each sub-cluster
Fig. 2
Fig. 2
Neuron cell sub-clusters in human embryonic cerebral cortex. a t-SNE map showing the subtypes of all inhibitory and excitatory neurons. The inhibitory neuron could be subdivided into eight clusters, and all of those are GAD1 positive. The excitatory neurons are NEUROD2 positive and could be subdivided into four clusters. In inhibitory neuron, Ex excitatory neuron. b Violin plot showing the DEGs of subgroups with inhibitory neuron (left) and exicitatory neuron (right), respectively. c Schematic diagram describing where different types of inhibitory neurons are generated and how they migrated. Violin plots show expression levels of interneuron progenitor genes DLX2 and NR2F2 in each subgroups. The cortex landscape shows the dominant inhibitory neuron types in each region. Blue indicates that over 60% inhibitory neurons in the corresponding region are in LHX6 subtype and the purple indicates that over 60% inhibitory neurons are in CALB2 subtype. White indicates that both subtypes of inhibitory neurons make up 40%–60% of the sum. Regions of gray color are detected with <15 inhibitory neurons. d The accurate percentages of inhibitory neurons belonging to LHX6 and CALB2 subgroups in regions colored with blue, purple, and white. e Left, heatmap showing the genes positively and negatively regulating excitatory neuron maturation, respectively. The color bars at the top represent cells from different clusters, which are arranged in a pseudotime order from immature to mature neurons. Middle, expression of putative excitatory neuron maturation regulating genes in the structures studied by Miller et al. (sample 12566). Right, enriched biological processes for down-regulated and up-regulated genes in excitatory neuron maturation. VZ ventricluar zone, ISVZ inner subventricular zone, OSVZ outer subventricular zone, IZ intemediate zone, SP subplate zone, CP cortical plate, MZ marginal zone, SG subpial granular zone
Fig. 3
Fig. 3
Regulation network of the transcription factors in excitatory neuron differentiation. a The expression changes of TFs negatively (top row) and positively (bottom row) regulating the maturation of excitatory neurons along the pseudotime. b The transcription networks of the TFs regulating excitatory neuron maturation. Top 1,000 target genes for each TF were listed in Supplementary information, Table S4. c Enrichment analysis on target genes for each TF shown in b and c. No enriched terms for NFIA and ZFHX4. Terms colored in red are known pathways quite related to neural development
Fig. 4
Fig. 4
Maturation degree of embryonic neurons is different from the adult neurons. a Heatmap showing the expression of marker genes identified in the adult neuron subtypes. b Expression of layer markers in different sub-clusters of excitatory neuron (left) and inhibitory neuron (right). c Landscape showing the maturity level of each region in the cortex measured by CUX2-positive excitatory neuron ratio. Regions of gray color are ruled out as they are detected with < 50 neurons. d In situ hybridization of CUX2 in PC and IT regions of a 22WF embryo. Scale bar, 100 μm. e Landscape showing the maturity level of each region in the cortex measured by expression level of synapse formation and function related genes
Fig. 5
Fig. 5
Comparison of embryonic neuron sub-clusters to adult ones. a PCA plot of both excitatory neuron sub-clusters and adult ones. b Heatmap of expression of the top genes in the PCs corresponding to panel (a) and the enriched terms for each PC gene set. Red bar indicates the genes positively correlated in each PC and the green bar indicates the negatively correlated genes in each PC. c PCA plot of both inhibitory neuron sub-clusters and adult ones. d Heatmap of expression of the top genes in the PCs corresponding to panel (c) and the enriched terms for each PC gene set. e Monocle analysis of inhibitory neurons together with those identified in developing pre-frontal cortex. SST+ cells show up randomly on the pseudotime
Fig. 6
Fig. 6
Comprehensive analysis on cell types of human cortex. a PCA of single neuronal cells from different data sets. The PC2 clearly separates progenitors from the differentiated cells, and PC3 and PC4 separate embryonic cells from the adult cells. b Heatmap showing the clustering of cells from different data sets and group-specific gene expression. c Classical marker gene expression in each identified cell group. d Unsupervised clustering of the 8 cell groups showing the distances between the cell groups
Fig. 7
Fig. 7
Spatial differences in the developing human cortex. a Pie chart displaying the cell type constitution in the four cerebral lobes and in the inferior region of cerebral cortex. b Immunofluorescence of GFAP in the pons, PC and IT regions of a 23 W female sample. The statistics of GFAP+ cell ratio in each region are shown in the histogram. Scale bar, 50 μm. c In situ hybridization of astrocyte genes RAMP3 (Astro_1) and PTGDS (Astro_2) showing higher abundance of the two subtypes of astrocytes in pons than that in IT and PC regions. Moreover, the PC shows the lowest astrocyte density. Scale bar, 150 μm. d–f DEGs across all cerebral cortex regions that are detected with more than 5 inhibitory neurons (d), immature excitatory neurons (Ex_1/2, e) and mature excitatory neurons (Ex_3/4, f). GAD1 and NEUROD2 are the housekeeping control for inhibitory and excitatory neurons, respectively. g RT-qPCR of NRGN in IG, IT, PC, and SP regions. The NRGN abundance in each region was normalized by GAPDH. h Validation of excitatory neurons expressing myocardial protein TNNT2 in the 23WF ST region by immunofluorescence. The PAO region is displayed as a negative control. TNNT2 antibody was tested in the cadiomyocytes as shown in Supplementary information, Figure S6c. Scale bar, 50 μm
Fig. 8
Fig. 8
Expression pattern and coexpression networks of autism risk genes. a Violin plots showing the epxression levels of the nine hcASD genes in each neuron sub-cluster. b Enrichment analysis of the hcASD genes and pASD genes in each neuron sub-cluster and each region of the Ex_4 with neuron cell number over 5. c Coexpression network showing the top 1,000 genes coexpressed with the nine hcASD genes. This indicates more candidate ASD genes. d Enriched biological processes for genes coexpressed with the nine hcASD genes. e The expression network for the hcASD genes and the pASD genes

References

    1. McKay RDG. The origins of cellular diversity in the mammalian central nervous system. Cell. 1989;58:815–821. doi: 10.1016/0092-8674(89)90934-3. - DOI - PubMed
    1. Masland RH. Neuronal cell types. Curr. Biol. 2018;14:R497–R500. doi: 10.1016/j.cub.2004.06.035. - DOI - PubMed
    1. Wright IC, Sham P, Murray RM, Weinberger DR, Bullmore ET. Genetic contributions to regional variability in human brain structure: methods and preliminary results. Neuroimage. 2002;17:256–271. doi: 10.1006/nimg.2002.1163. - DOI - PubMed
    1. Shipp S. Structure and function of the cerebral cortex. Curr. Biol. 2007;17:443–449. doi: 10.1016/j.cub.2007.03.044. - DOI - PubMed
    1. Yoshimura Y, Dantzker JLM, Callaway EM. Excitatory cortical neurons form fine-scale functional networks. Nature. 2005;433:868. doi: 10.1038/nature03252. - DOI - PubMed

Publication types