

doi: 10.3389/fnins.2018.00316.
eCollection 2018.
Neural Responses to Naturalistic Clips of Behaving Animals in Two Different Task Contexts
Affiliations
- PMID: 29867327
- PMCID: PMC5962655
- DOI: 10.3389/fnins.2018.00316
Item in Clipboard
Neural Responses to Naturalistic Clips of Behaving Animals in Two Different Task Contexts
Front Neurosci.
.
No abstract available
Keywords: action understanding; attention; categorization; fMRI; multivariate pattern analysis (MVPA); natural vision; open data.
Figures
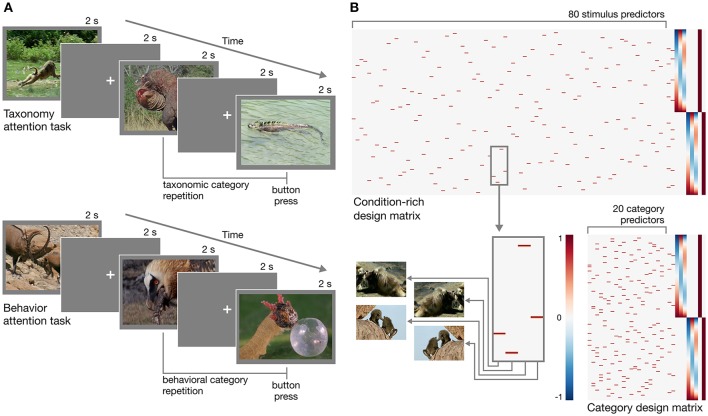
Experimental design. (A) Schematic of the rapid event-related design for both taxonomy attention and behavior attention task conditions. In the taxonomy attention task, participants were instructed to press a button if they observed a taxonomic category repetition (e.g., two consecutive clips depicting reptiles; upper). In the behavior attention task, participants were instructed to press a button if they observed a behavioral category repetition (e.g., two consecutive clips depicting animals eating; lower). (B) Two example design matrices for predicting hemodynamic responses to the clips over the course of two runs with the taxonomy attention task. In the condition-rich design, each of 80 visually unique stimuli receives a separate predictor (following Kriegeskorte et al., ; upper), while in the category design, the four exemplar clips per taxonomy–behavior condition are collapsed to form 20 category predictors (following Nastase et al., ; lower). Hypothesized neural responses are convolved with a simple hemodynamic response function (Cohen, 1997). In this simple example, nuisance regressors for taxonomy and behavior repetition events, first- through third-order Legendre polynomials, and run constants are appended to each design matrix. Figures were created using Matplotlib (https://matplotlib.org ; Hunter, ; RRID:SCR_008624 ) and seaborn (https://seaborn.pydata.org ; Waskom et al., 2016).
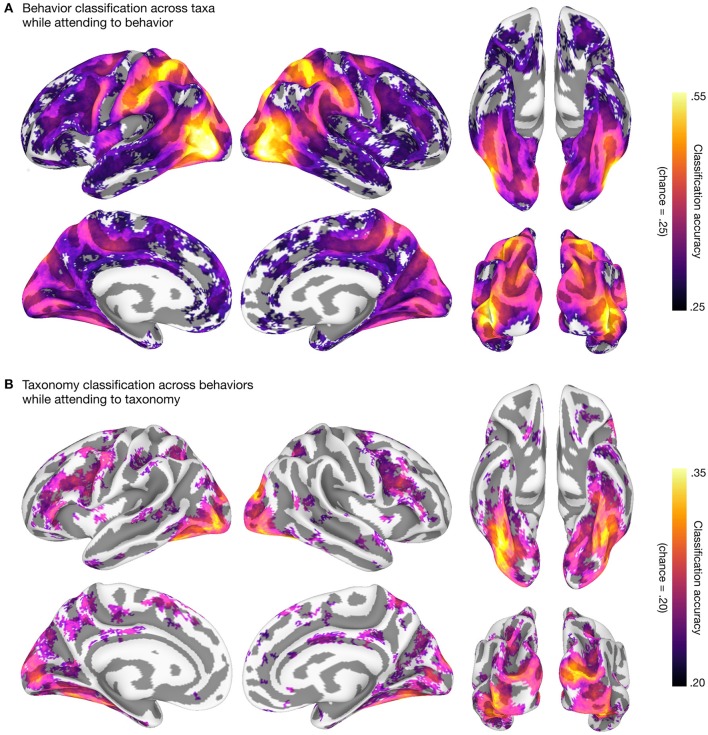
Behavioral and taxonomic category cross-classification using surface-based searchlights. To statistically evaluate the searchlight results, we first computed a one-sample t-test against theoretical chance accuracy per searchlight (one-tailed test). We corrected for multiple tests by controlling the false discovery rate (FDR) at q = 0.05 (Benjamini and Hochberg, ; Genovese et al., 2002). The mean classification accuracy across participants is plotted and searchlight maps are thresholded at FDR q = 0.05. (A) Searchlight classification of behavioral categories cross-validated across taxonomic categories while participants attended to animal behavior. Theoretical chance accuracy for four-way behavioral category classification is 0.25. The maximum mean searchlight accuracy for behavioral category classification was 0.56 in left lateral occipitotemporal cortex (inferior occipital gyrus). (B) Searchlight classification of taxonomic categories cross-validated across behavioral categories while participants attended to animal taxonomy. Theoretical chance accuracy for five-way taxonomic category classification is 0.20. The maximum mean searchlight accuracy for taxonomic category classification was 0.36 in right ventral temporal cortex (lateral fusiform gyrus). Although we used a t-test here for simplicity, note that the t-test may yield significant t-values even for near-chance accuracies, and a permutation- or prevalence-based approach may be preferable in some cases (cf. Stelzer et al., ; Allefeld et al., ; Etzel, 2017). Surface vertices on the medial wall were excluded from the analysis and clusters of fewer than ten contiguous significant vertices after thresholding were excluded for visualization purposes. Surface data were visualized using SUMA (Saad et al., ; RRID:SCR_005927 ) and figures were created using GIMP (https://www.gimp.org ; RRID:SCR_003182 ) and Inkscape (https://inkscape.org ; RRID:SCR_014479 ).
Similar articles
-
Goal-Directed Processing of Naturalistic Stimuli Modulates Large-Scale Functional Connectivity.Front Neurosci. 2019 Jan 29;12:1003. doi: 10.3389/fnins.2018.01003. eCollection 2018. Front Neurosci. 2019. PMID: 30760971 Free PMC article.
-
Attention Selectively Reshapes the Geometry of Distributed Semantic Representation.Cereb Cortex. 2017 Aug 1;27(8):4277-4291. doi: 10.1093/cercor/bhx138. Cereb Cortex. 2017. PMID: 28591837 Free PMC article.
-
Linear Discriminant Analysis Achieves High Classification Accuracy for the BOLD fMRI Response to Naturalistic Movie Stimuli.Front Hum Neurosci. 2016 Mar 31;10:128. doi: 10.3389/fnhum.2016.00128. eCollection 2016. Front Hum Neurosci. 2016. PMID: 27065832 Free PMC article.
-
Reward Selectively Modulates the Lingering Neural Representation of Recently Attended Objects in Natural Scenes.J Neurosci. 2017 Aug 2;37(31):7297-7304. doi: 10.1523/JNEUROSCI.0684-17.2017. Epub 2017 Jun 19. J Neurosci. 2017. PMID: 28630254 Free PMC article.
-
Anatomy and time course of discrimination and categorization processes in vision: an fMRI study.Neuroimage. 2004 Aug;22(4):1563-77. doi: 10.1016/j.neuroimage.2004.03.044. Neuroimage. 2004. PMID: 15275913
Cited by
-
Goal-Directed Processing of Naturalistic Stimuli Modulates Large-Scale Functional Connectivity.Front Neurosci. 2019 Jan 29;12:1003. doi: 10.3389/fnins.2018.01003. eCollection 2018. Front Neurosci. 2019. PMID: 30760971 Free PMC article.
-
An fMRI dataset in response to large-scale short natural dynamic facial expression videos.Sci Data. 2024 Nov 19;11(1):1247. doi: 10.1038/s41597-024-04088-0. Sci Data. 2024. PMID: 39562568 Free PMC article.
-
The magic, memory, and curiosity fMRI dataset of people viewing magic tricks.Sci Data. 2024 Oct 1;11(1):1063. doi: 10.1038/s41597-024-03675-5. Sci Data. 2024. PMID: 39353978 Free PMC article.
-
An fMRI dataset in response to "The Grand Budapest Hotel", a socially-rich, naturalistic movie.Sci Data. 2020 Nov 11;7(1):383. doi: 10.1038/s41597-020-00735-4. Sci Data. 2020. PMID: 33177526 Free PMC article.
-
Neuroscout, a unified platform for generalizable and reproducible fMRI research.Elife. 2022 Aug 30;11:e79277. doi: 10.7554/eLife.79277. Elife. 2022. PMID: 36040302 Free PMC article.
References
Grants and funding
LinkOut - more resources
Full Text Sources
Other Literature Sources