. 2018 May 14:12:128.
doi: 10.3389/fncel.2018.00128. eCollection 2018.

Calcium in Kenyon Cell Somata as a Substrate for an Olfactory Sensory Memory in Drosophila

Affiliations

Calcium in Kenyon Cell Somata as a Substrate for an Olfactory Sensory Memory in Drosophila

Alja Lüdke et al. Front Cell Neurosci. .

Erratum in

Abstract

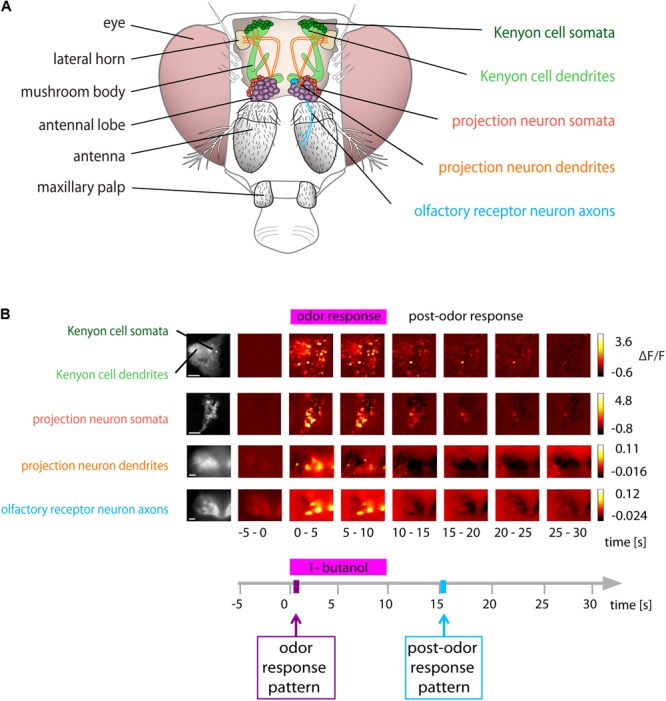
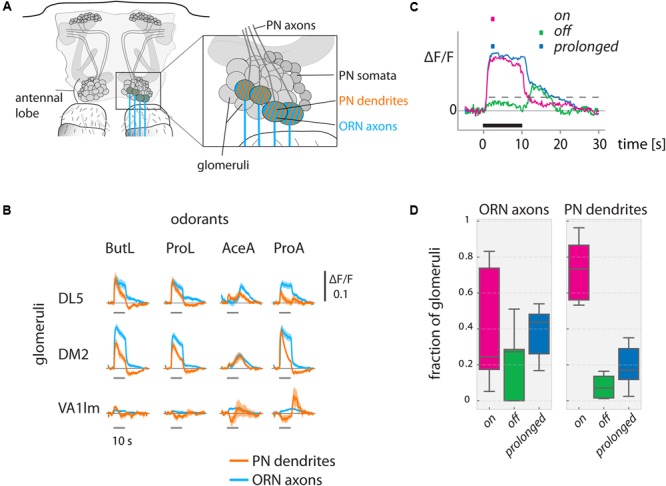
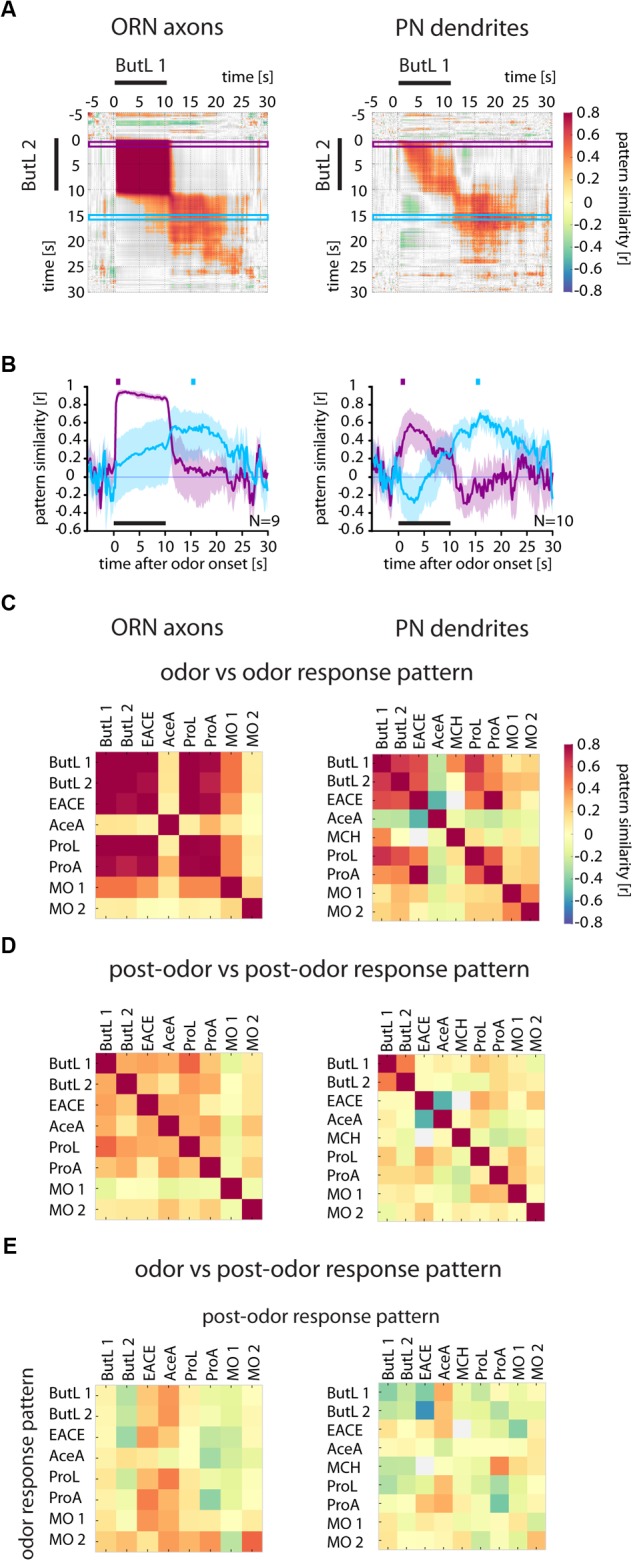
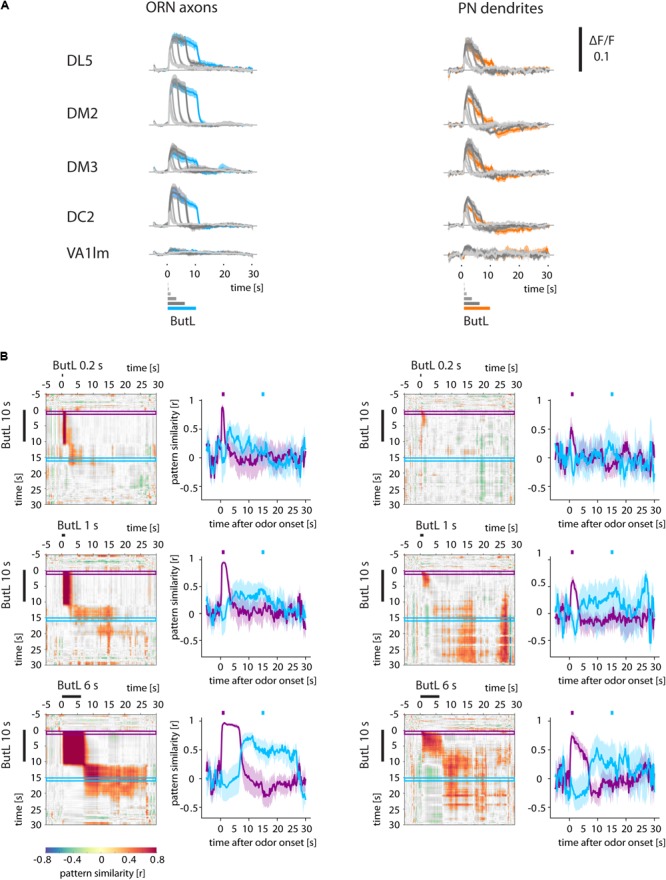
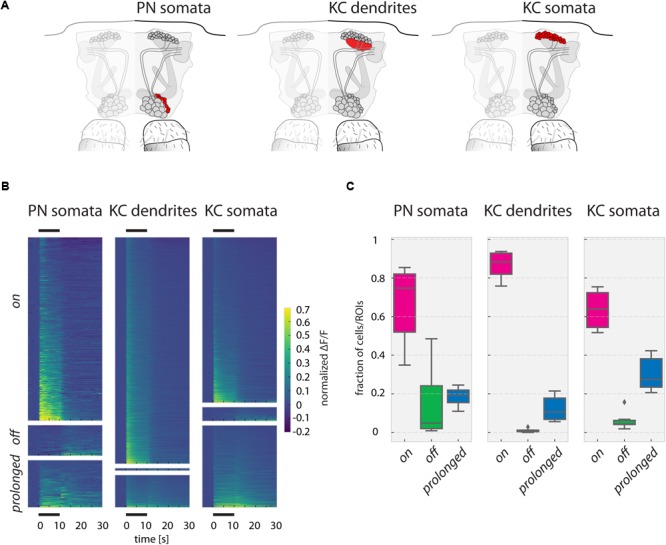
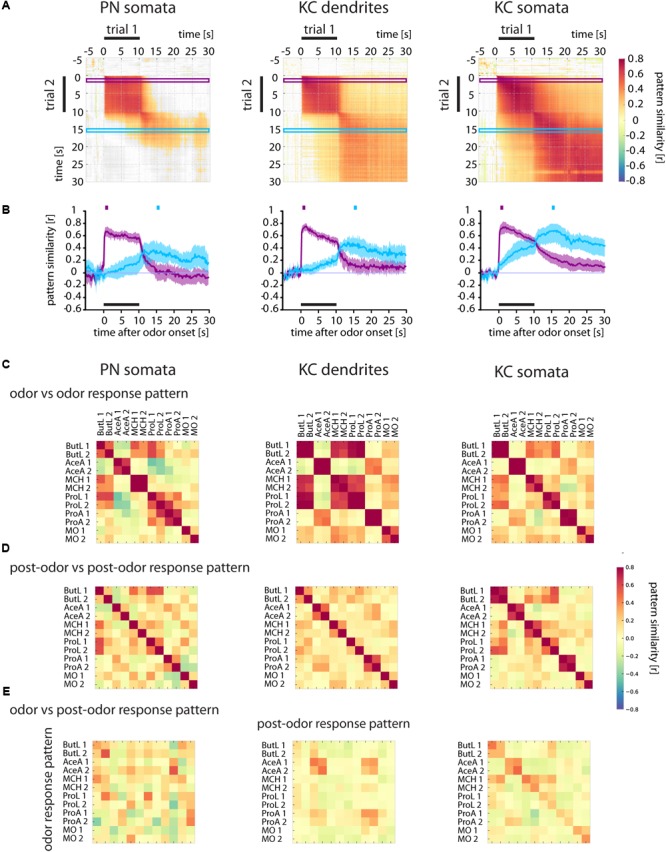
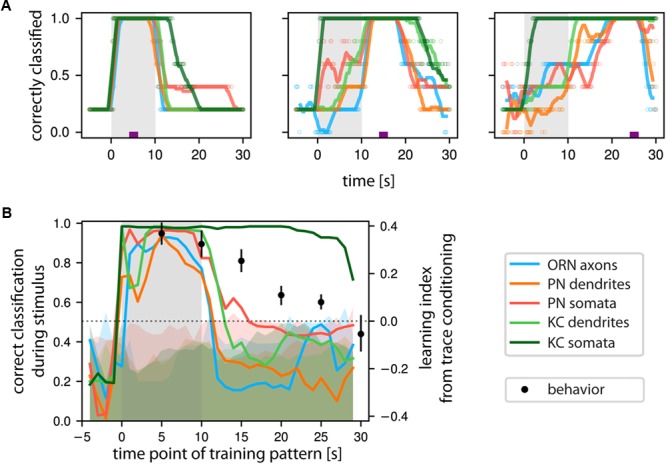
Animals can form associations between temporally separated stimuli. To do so, the nervous system has to retain a neural representation of the first stimulus until the second stimulus appears. The neural substrate of such sensory stimulus memories is unknown. Here, we search for a sensory odor memory in the insect olfactory system and characterize odorant-evoked Ca2+ activity at three consecutive layers of the olfactory system in Drosophila: in olfactory receptor neurons (ORNs) and projection neurons (PNs) in the antennal lobe, and in Kenyon cells (KCs) in the mushroom body. We show that the post-stimulus responses in ORN axons, PN dendrites, PN somata, and KC dendrites are odor-specific, but they are not predictive of the chemical identity of past olfactory stimuli. However, the post-stimulus responses in KC somata carry information about the identity of previous olfactory stimuli. These findings show that the Ca2+ dynamics in KC somata could encode a sensory memory of odorant identity and thus might serve as a basis for associations between temporally separated stimuli.

Keywords: Drosophila melanogaster; Kenyon cells; calcium imaging; mushroom body; olfaction; sensory memory; trace conditioning.


Figures

FIGURE 1
FIGURE 1
Odor and post-odor responses along the olfactory pathway. (A) Schematic of the olfactory system of Drosophila. (Left): gross anatomy. (Right): areas investigated in this study. (B) Spatial distribution of Ca2+ activity during and after olfactory stimulation (here with 1-butanol) in the neuronal compartments along the olfactory pathway. Color coded ΔF/F images show the average of 5 s recording time (i.e., 25 frames). All areas showed distinct responses upon odorant stimulation. (Scale bars 20 μm). See also calcium imaging movies on http://neuro.uni-konstanz.de/luedke/.
FIGURE 2
FIGURE 2
Odorant-evoked activity in ORN axons and PN dendrites in the antennal lobe. (A) Schematic of the antennal lobe. ORN axons (blue) and PN dendrites (orange) were measured in olfactory glomeruli. (B) Ca2+ responses show odorant-specific dynamics. Ca2+ responses (ΔF/F) are shown for ORN axons (Orco-Gal4, blue) and PN dendrites (GH146-Gal4, orange) for exemplary glomeruli. Odorant stimuli were 10 s long. (DL5: N = 9 flies, DM2: N = 9, VA1lm: N = 5, mean with SEM). See methods for odorant abbreviations. (C) We categorized responses into on (only responding during the stimulus), off (only responding after the offset of the stimulus), or prolonged (sustained responses starting with the stimulus but outlasting it), based on response thresholds (see methods for details) during the marked time points (colored squares above the graph). Dashed gray line indicates the threshold (exemplary). Black line indicates the odorant stimulus. (D) Fraction of glomeruli in each animal responding with on, off, or prolonged time courses (N = 9 flies for ORN axons, N = 10 for PN dendrites; data pooled across animals, distribution across 6 odorants. Boxplots show median and quartiles, whiskers delimit 1.5 × interquartile range.) See Materials and Methods for number of flies and glomeruli.
FIGURE 3
FIGURE 3
Odor response patterns in ORN axons and PN dendrites change after odor offset. (A) Correlation analyses of two 1-butanol (ButL) responses show that both odor and post-odor response patterns were reproducible and stable (high correlation values within the block during the odorant stimulation and within the block after odor offset), but dissimilar to each other (low correlation values when comparing odor response period to post-odor response period). Correlation values were defined as being significant when p < 0.005 and are color coded (color scale bar, right). Non-significant values are shown in gray. Purple and blue frames mark the time window used to calculate the time-resolved correlation, shown in (B). (B) Time-resolved correlation between the odor response pattern (marked by the purple square above the graph) and the post-odor response pattern (marked by the blue square) of a 1-butanol response across all time points of another 1-butanol response (purple and blue traces, respectively). The odor response pattern breaks down at odor offset in both, ORN axons (left) and PN dendrites (right) and is dissimilar to the post-odor response pattern, which evolves at odor offset. Mean ± SD obtained by bootstrap analysis (on animals, 1000 times). (C) Correlation of the odor response patterns between different odors. Odorant responses are reproducible (compare ButL 1 with ButL 2). In ORN axons, different odorants evoke more similar odor response patterns (e.g., EACE vs. ButL 1 and ButL 2) than in PN dendrites (right, with fewer high values at off-diagonal locations). See methods for odorant abbreviations. (D) Correlation of the post-odor response patterns between different odorants. Post-odor response patterns are less correlated between different odorants than odor response patterns. Post-odor responses are more reproducible in PN dendrites than in ORNs (compare ButL 1 with ButL 2). (E) Correlation of odor response patterns with post-odor response patterns for each odor. The odor response patterns are not correlated with the post-odor response patterns (there is no increase in correlation along the diagonal) See Materials and Methods for number of flies and glomeruli.
FIGURE 4
FIGURE 4
Odor and post-odor responses track stimulus length. (A) Ca2+ responses (ΔF/F) of glomeruli (ORN axons and PN dendrites) to different stimulus durations (0.2, 0.4, 1, 3, 6 s) of 1-butanol (ButL). Long stimuli lead to longer odor responses. Additionally, long stimuli also lead to more pronounced post-odor responses. (B) Correlation analyses comparing the glomerular response to a 10 s stimulus (vertical) with that to a shorter stimulus (horizontal, here: 0.2, 1, 6 s, for other durations see Supplementary Figure S2). Correlation values were defined as being significant when p < 0.005 and were color coded (color scale bar, right). Non-significant values are shown in gray. The correlation traces (purple and blue traces, mean ± SEM) reveal that the odor response patterns breaks down at odor offset in all measured stimulus durations and are dissimilar to the post-odor response patterns. The post-odor response patterns also increase their durations with stimulus length. See Materials and Methods for number of flies and glomeruli.
FIGURE 5
FIGURE 5
Responses to odorants in PN somata, KC dendrites, and KC somata. (A) Schematic of the recorded PN somata, KC dendrites in the calyx and KC somata layer in the fly brain. (B) Ca2+ responses (ΔF/F, normalized to the strongest odor response in each fly) of PN somata, KC dendrites, and KC somata of all measured odorants in all measured flies, sorted into on, off, and prolonged responses. Black bars above and below the graph mark the 10 s odor stimulus. (C) Fraction of responding units (somata or ROIs) per odorant in each response category for all three recorded areas. Prolonged responses are significantly more frequent in KC somata than in KC dendrites (p-value: 0.033). Boxes show the quartiles of the datasets, whiskers extend to show the rest of the distribution, outliers are marked as ticks. See Materials and Methods for number of flies and somata/ROIs.
FIGURE 6
FIGURE 6
Odor and post-odor responses evolve differently in different brain areas. (A) Correlation analyses of repeated odorant stimulations (trial 1 vs. trial 2) show that odor and post-odor response patterns are reproducible and stable in PN somata, KC dendrites, and KC somata (see high correlation values during the odor and after odor offset). In PN somata, the odor response pattern changes into a distinct post-odor response at odor offset (see the gray areas right and below the correlated odor pattern rectangles). In KC dendrites, and even more in KC somata, the pattern change is smooth and the post-odor response pattern retains a similarity to the odor response pattern. Correlation values were defined as being significant when p < 0.005 and are color coded (color scale bar, right). Non-significant values are shown in gray. Purple and blue frames mark the time windows used to calculate the time-resolved correlation, shown in (B). (B) Time-resolved correlation between the odor response pattern (marked by the purple square above the graph) and the post-odor response pattern (marked by the blue square) of an odor response with all time points of another response to the same odorant (purple and blue traces, respectively). The odor response pattern breaks down at odor offset in PN somata, and yields to a distinct post-odor response pattern which evolves at odor offset. Conversely, KC somata show a smooth transition that retains substantial information about the odorant response also during post-odor activity. Mean ± SD obtained by bootstrap analysis (on animals, 1000 times). See Supplementary Figure S3 for the same data split by odorants. (C) Correlation of the odor response patterns of different odorants and repeated odorant stimulations. Each odorant was given twice (e.g., ButL 1 and ButL 2; see methods for odorant abbreviations). Odor response patterns of repeated odorants are reproducible in all three cell/compartment types (large diagonal squares in the upper row). Some odorants elicited similar response patterns in KC dendrites (off-diagonal dark squares, e.g., ButL 1 and ButL 2 with ProL 1 and ProL 2). (D) Correlation of the post-odor response patterns between different odorants. Post-odor patterns are not reproducible in PN somata (high values along the diagonal form only small squares), but quite reproducible in KC dendrites and KC somata (large squares in the diagonal with high correlation values). (E) Correlation of odor response patterns with post-odor response patterns. In PN somata or KC dendrites, the odor response patterns are not correlated to the post-odor response patterns within the same odorant stimulation (see diagonal entries), but there is a consistent correlation in KC somata (increase in correlation along the diagonal). See Materials and Methods for number of flies and somata/ROIs.
FIGURE 7
FIGURE 7
KCs’ somatic Ca2+ encodes odorant identity of past stimuli. (A) Classification success of a support vector machine (SVM) trained to correctly identify odorant identity based on the Ca2+ response patterns at a time point marked by the purple tick. Classification success was then evaluated at all time points. When the time points of test and train coincide, the classification performance trivially reaches 1. (Left): odor response patterns are stable over the entire stimulus time and decay with odor offset. (Middle): Training on post-odorant responses right after stimulus offset allows classifying odorant identity in KC somata, to a lesser extent in PN somata but not in the other populations. (Right): SVM trained on post-odor response patterns from KC somata successfully classified correct stimulus identity of previous responses, but not so in the other measured neuronal compartments. Individual data points are shown by empty circles, lines show a running average. Shaded area marks the odor stimulus. (B) Quantification of the classification success during the stimulus based on the time point of training. SVM was trained with all time points (X-axis), and the average correct classification during the stimulus was calculated (Y-axis). Shaded bars denote chance classification rates obtained by performing the analysis 250 times on label permuted datasets. The upper bound of the shaded area denotes the 95% confidence interval of such chance classification. Only KC somata were above this chance classification rate for an extended period of time. We overlaid the behaviorally observed learning performance (Data from Galili et al., 2011, with 0 learning scores coinciding to the chance level of classification, right ordinate axis). See Materials and Methods for number of flies and glomeruli/somata/ROIs.

References

    1. Adams M. D., Celniker S. E., Holt R. A., Evans C. A., Gocayne J. D., Amanatides P. G., et al. (2000). The genome sequence of Drosophila melanogaster. Science 287 2185–2195. 10.1126/science.287.5461.2185 - DOI - PubMed
    1. Aso Y., Sitaraman D., Ichinose T., Kaun K. R., Vogt K., Belliart-Guérin G., et al. (2014). Mushroom body output neurons encode valence and guide memory-based action selection in Drosophila. eLife 3:e04580. 10.7554/eLife.04580 - DOI - PMC - PubMed
    1. Aso Y., Siwanowicz I., Bräcker L., Ito K., Kitamoto T., Tanimoto H. (2010). Specific dopaminergic neurons for the formation of labile aversive memory. Curr. Biol. 20 1445–1451. 10.1016/j.cub.2010.06.048 - DOI - PMC - PubMed
    1. Augustine G. J., Santamaria F., Tanaka K. (2003). Local calcium signaling in neurons. Neuron 40 331–346. 10.1016/S0896-6273(03)00639-1 - DOI - PubMed
    1. Betkiewicz R. L., Lindner B., Nawrot M. P. (2017). Circuit and cellular mechanisms facilitate the transformation from dense to sparse coding in the insect olfactory system. BioRxiv [Preprint]. 10.1101/240671 - DOI - PMC - PubMed