

Investigating the Neural Basis of Theta Burst Stimulation to Premotor Cortex on Emotional Vocalization Perception: A Combined TMS-fMRI Study
- PMID: 29867402
- PMCID: PMC5962765
- DOI: 10.3389/fnhum.2018.00150
Investigating the Neural Basis of Theta Burst Stimulation to Premotor Cortex on Emotional Vocalization Perception: A Combined TMS-fMRI Study
Abstract
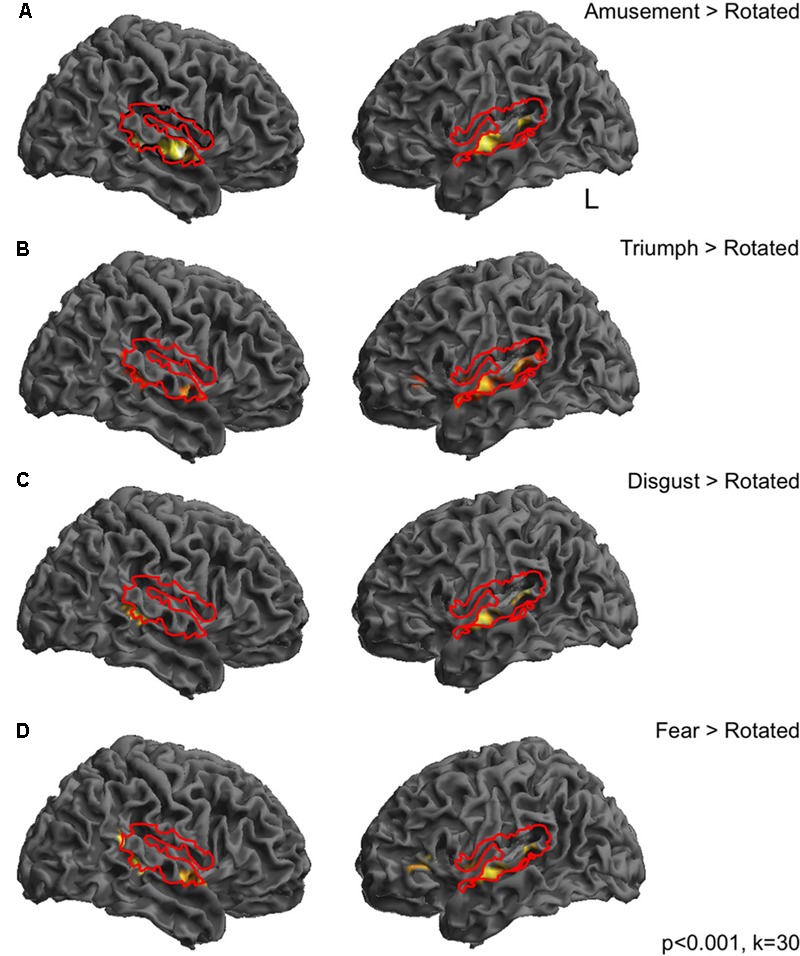
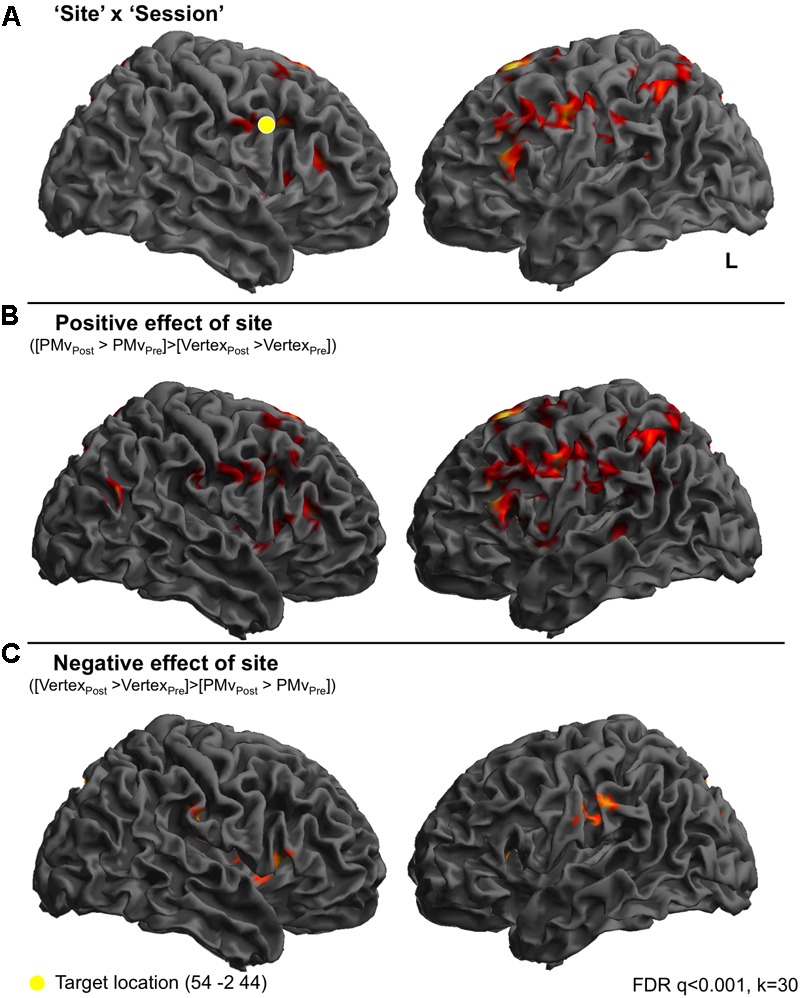
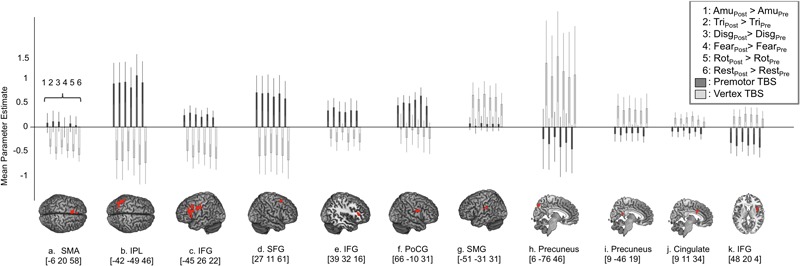
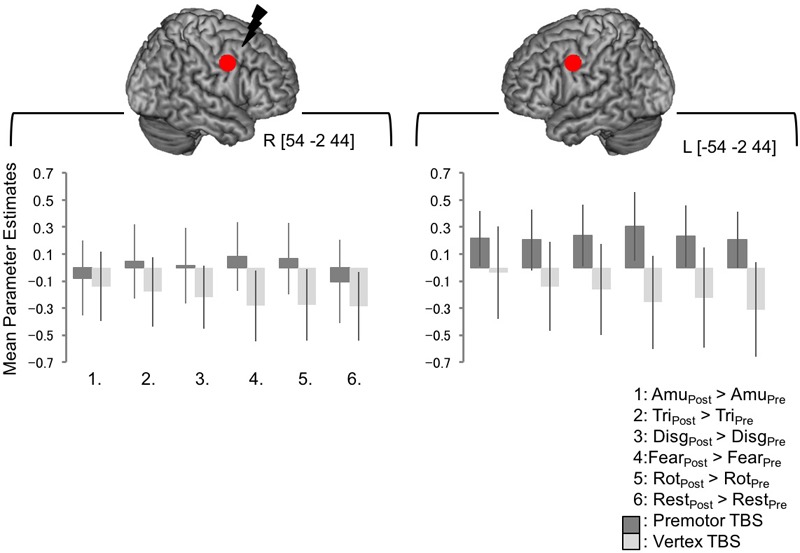
Previous studies have established a role for premotor cortex in the processing of auditory emotional vocalizations. Inhibitory continuous theta burst transcranial magnetic stimulation (cTBS) applied to right premotor cortex selectively increases the reaction time to a same-different task, implying a causal role for right ventral premotor cortex (PMv) in the processing of emotional sounds. However, little is known about the functional networks to which PMv contribute across the cortical hemispheres. In light of these data, the present study aimed to investigate how and where in the brain cTBS affects activity during the processing of auditory emotional vocalizations. Using functional neuroimaging, we report that inhibitory cTBS applied to the right premotor cortex (compared to vertex control site) results in three distinct response profiles: following stimulation of PMv, widespread frontoparietal cortices, including a site close to the target site, and parahippocampal gyrus displayed an increase in activity, whereas the reverse response profile was apparent in a set of midline structures and right IFG. A third response profile was seen in left supramarginal gyrus in which activity was greater post-stimulation at both stimulation sites. Finally, whilst previous studies have shown a condition specific behavioral effect following cTBS to premotor cortex, we did not find a condition specific neural change in BOLD response. These data demonstrate a complex relationship between cTBS and activity in widespread neural networks and are discussed in relation to both emotional processing and the neural basis of cTBS.
Keywords: cTBS; emotional vocalization; emotions; fMRI; functional magnetic resonance imaging; premotor cortex; transcranial magnetic stimulation.
Figures
Similar articles
-
The effect of continuous theta burst stimulation over premotor cortex on circuits in primary motor cortex and spinal cord.Clin Neurophysiol. 2009 Apr;120(4):796-801. doi: 10.1016/j.clinph.2009.01.003. Epub 2009 Feb 23. Clin Neurophysiol. 2009. PMID: 19231274
-
Dynamic Interactions between Emotion Perception and Action Preparation for Reacting to Social Threat: A Combined cTBS-fMRI Study.eNeuro. 2018 Jul 2;5(3):ENEURO.0408-17.2018. doi: 10.1523/ENEURO.0408-17.2018. eCollection 2018 May-Jun. eNeuro. 2018. PMID: 29971249 Free PMC article.
-
The After-Effects of Theta Burst Stimulation Over the Cortex of the Suprahyoid Muscle on Regional Homogeneity in Healthy Subjects.Front Behav Neurosci. 2019 Mar 1;13:35. doi: 10.3389/fnbeh.2019.00035. eCollection 2019. Front Behav Neurosci. 2019. PMID: 30881294 Free PMC article.
-
The theta burst transcranial magnetic stimulation over the right PFC affects electroencephalogram oscillation during emotional processing.Prog Neuropsychopharmacol Biol Psychiatry. 2018 Mar 2;82:21-30. doi: 10.1016/j.pnpbp.2017.12.005. Epub 2017 Dec 11. Prog Neuropsychopharmacol Biol Psychiatry. 2018. PMID: 29241839
-
The effects of theta burst stimulation (TBS) targeting the prefrontal cortex on executive functioning: A systematic review and meta-analysis.Neuropsychologia. 2018 Mar;111:344-359. doi: 10.1016/j.neuropsychologia.2018.02.004. Epub 2018 Feb 10. Neuropsychologia. 2018. PMID: 29438672
Cited by
-
A systematic review of the neurobiological effects of theta-burst stimulation (TBS) as measured using functional magnetic resonance imaging (fMRI).Brain Struct Funct. 2023 May;228(3-4):717-749. doi: 10.1007/s00429-023-02634-x. Epub 2023 Apr 19. Brain Struct Funct. 2023. PMID: 37072625 Free PMC article.
-
Participation of visual association areas in social processing emerges when rTPJ is inhibited.eNeurologicalSci. 2022 May 27;27:100407. doi: 10.1016/j.ensci.2022.100407. eCollection 2022 Jun. eNeurologicalSci. 2022. PMID: 35669231 Free PMC article.
-
The immediate impact of transcranial magnetic stimulation on brain structure: Short-term neuroplasticity following one session of cTBS.Neuroimage. 2021 Oct 15;240:118375. doi: 10.1016/j.neuroimage.2021.118375. Epub 2021 Jul 8. Neuroimage. 2021. PMID: 34245868 Free PMC article.
-
Lateralized Brainstem and Cervical Spinal Cord Responses to Aversive Sounds: A Spinal fMRI Study.Brain Sci. 2018 Aug 31;8(9):165. doi: 10.3390/brainsci8090165. Brain Sci. 2018. PMID: 30200289 Free PMC article.
-
Low-Frequency TMS Results in Condition-Related Dynamic Activation Changes of Stimulated and Contralateral Inferior Parietal Lobule.Front Hum Neurosci. 2021 Jul 23;15:684367. doi: 10.3389/fnhum.2021.684367. eCollection 2021. Front Hum Neurosci. 2021. PMID: 34366812 Free PMC article.
References
LinkOut - more resources
Full Text Sources
Other Literature Sources
Miscellaneous