

MicroRNA-129-5p Regulates Glycolysis and Cell Proliferation by Targeting the Glucose Transporter SLC2A3 in Gastric Cancer Cells
- PMID: 29867504
- PMCID: PMC5962750
- DOI: 10.3389/fphar.2018.00502
MicroRNA-129-5p Regulates Glycolysis and Cell Proliferation by Targeting the Glucose Transporter SLC2A3 in Gastric Cancer Cells
Abstract
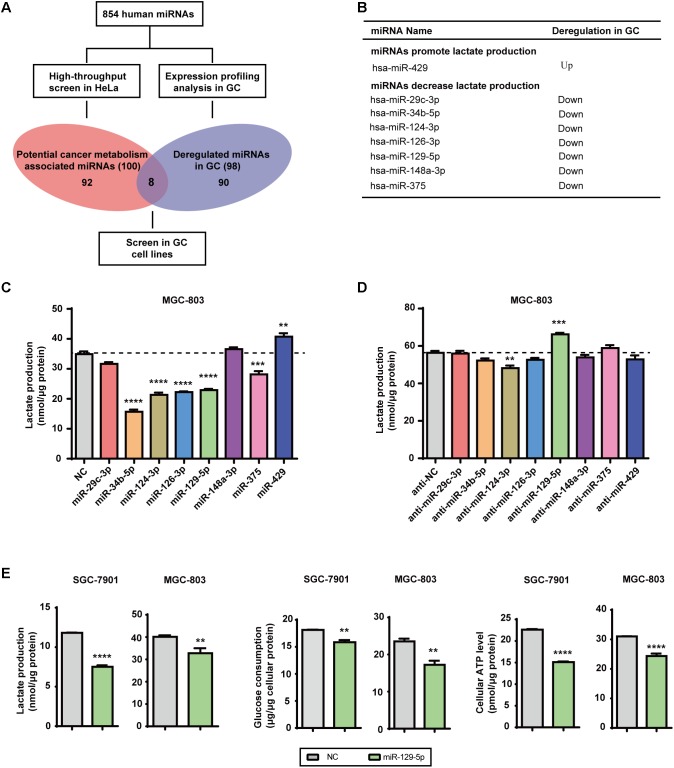
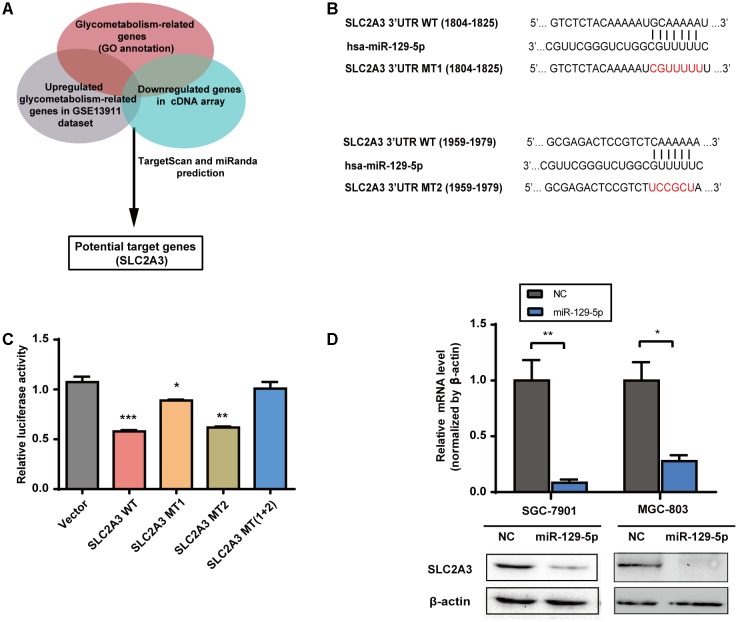
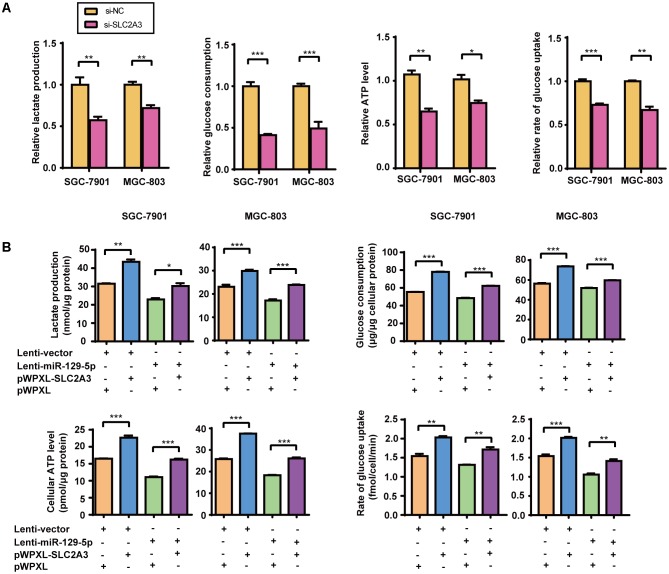
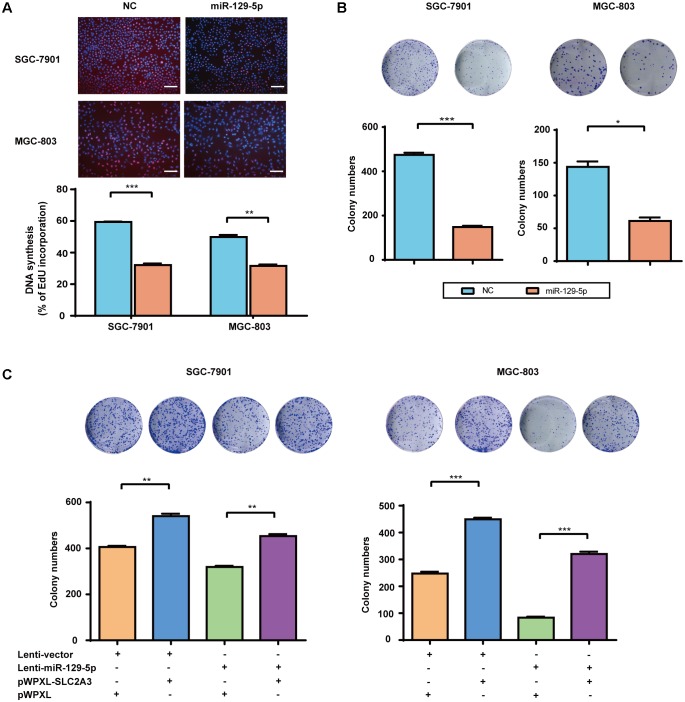
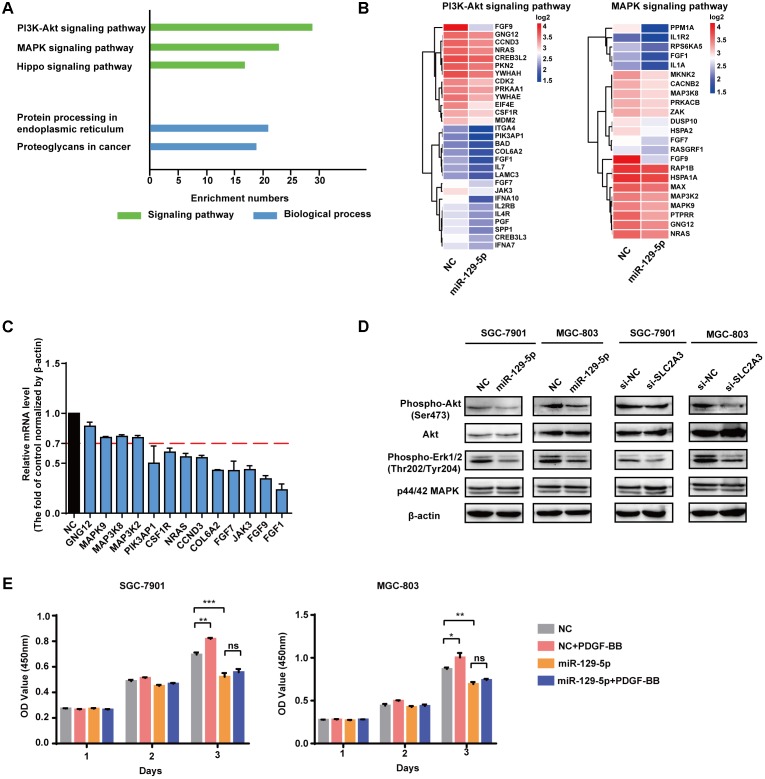
Tumor cells increase their glucose consumption through aerobic glycolysis to manufacture the necessary biomass required for proliferation, commonly known as the Warburg effect. Accumulating evidences suggest that microRNAs (miRNAs) interact with their target genes and contribute to metabolic reprogramming in cancer cells. By integrating high-throughput screening data and the existing miRNA expression datasets, we explored the roles of candidate glycometabolism-regulating miRNAs in gastric cancer (GC). Subsequent investigation of the characterized miRNAs indicated that miR-129-5p inhibits glucose metabolism in GC cells. miRNA-129-5p directly targets the 3'-UTR of SLC2A3, thereby suppressing glucose consumption, lactate production, cellular ATP levels, and glucose uptake of GC cells. In addition, the PI3K-Akt and MAPK signaling pathways are involved in the effects of the miR-129-5p/SLC2A3 axis, regulating GC glucose metabolism and growth. These results reveal a novel role of the miR-129-5p/SLC2A3 axis in reprogramming the glycometabolism process in GC cells and indicate a potential therapeutic target for the treatment of this disease.
Keywords: SLC2A3; cancer metabolism; gastric cancer; miR-129-5p; proliferation.
Figures
Similar articles
-
MiR-199a-5p is negatively associated with malignancies and regulates glycolysis and lactate production by targeting hexokinase 2 in liver cancer.Hepatology. 2015 Oct;62(4):1132-44. doi: 10.1002/hep.27929. Epub 2015 Jul 4. Hepatology. 2015. PMID: 26054020
-
MiR-150-5p regulates melanoma proliferation, invasion and metastasis via SIX1-mediated Warburg Effect.Biochem Biophys Res Commun. 2019 Jul 12;515(1):85-91. doi: 10.1016/j.bbrc.2019.05.111. Epub 2019 May 23. Biochem Biophys Res Commun. 2019. PMID: 31128917
-
miR-590-5p/Tiam1-mediated glucose metabolism promotes malignant evolution of pancreatic cancer by regulating SLC2A3 stability.Cancer Cell Int. 2023 Nov 28;23(1):301. doi: 10.1186/s12935-023-03159-3. Cancer Cell Int. 2023. PMID: 38017477 Free PMC article.
-
Metabolic reprogramming results in abnormal glycolysis in gastric cancer: a review.Onco Targets Ther. 2019 Feb 13;12:1195-1204. doi: 10.2147/OTT.S189687. eCollection 2019. Onco Targets Ther. 2019. PMID: 30863087 Free PMC article. Review.
-
Cellular effects and clinical implications of SLC2A3 copy number variation.J Cell Physiol. 2020 Dec;235(12):9021-9036. doi: 10.1002/jcp.29753. Epub 2020 May 5. J Cell Physiol. 2020. PMID: 32372501 Review.
Cited by
-
Glucose transporter 3 (GLUT3) promotes lactylation modifications by regulating lactate dehydrogenase A (LDHA) in gastric cancer.Cancer Cell Int. 2023 Dec 1;23(1):303. doi: 10.1186/s12935-023-03162-8. Cancer Cell Int. 2023. PMID: 38041125 Free PMC article.
-
Novel long non-coding RNA LINC02532 promotes gastric cancer cell proliferation, migration, and invasion in vitro.World J Gastrointest Oncol. 2019 Feb 15;11(2):91-101. doi: 10.4251/wjgo.v11.i2.91. World J Gastrointest Oncol. 2019. PMID: 30788037 Free PMC article.
-
CircKIF2A contributes to cell proliferation, migration, invasion and glycolysis in human neuroblastoma by regulating miR-129-5p/PLK4 axis.Mol Cell Biochem. 2021 Jun;476(6):2513-2525. doi: 10.1007/s11010-021-04096-3. Epub 2021 Feb 25. Mol Cell Biochem. 2021. PMID: 33630225
-
MiR-129-5p alleviates depression and anxiety by increasing astrocyte ATP production partly through targeting deubiquitinase Mysm1.PLoS One. 2025 May 9;20(5):e0322715. doi: 10.1371/journal.pone.0322715. eCollection 2025. PLoS One. 2025. PMID: 40344568 Free PMC article.
-
Predictive model using four ferroptosis-related genes accurately predicts gastric cancer prognosis.World J Gastrointest Oncol. 2024 May 15;16(5):2018-2037. doi: 10.4251/wjgo.v16.i5.2018. World J Gastrointest Oncol. 2024. PMID: 38764813 Free PMC article.
References
LinkOut - more resources
Full Text Sources
Other Literature Sources
Miscellaneous