. 2018 May 16:9:456.
doi: 10.3389/fphys.2018.00456. eCollection 2018.

Characterization of the Olfactory Receptor OR10H1 in Human Urinary Bladder Cancer

Affiliations

Characterization of the Olfactory Receptor OR10H1 in Human Urinary Bladder Cancer

Lea Weber et al. Front Physiol. .

Abstract

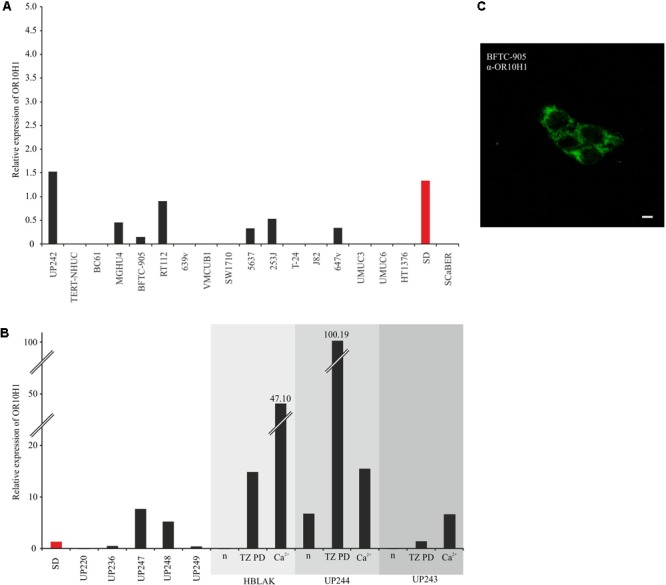
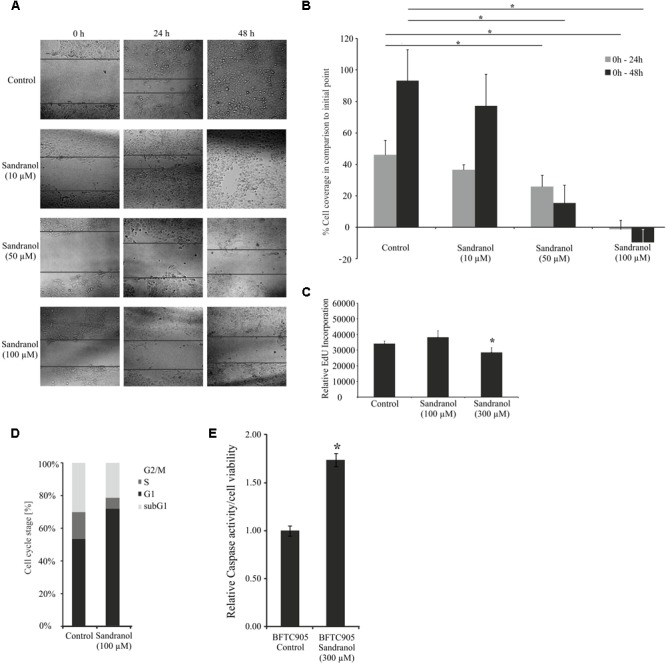
Olfactory receptors (ORs) are a large group of G-protein coupled receptors predominantly found in the olfactory epithelium. Many ORs are, however, ectopically expressed in other tissues and involved in several diseases including cancer. In this study, we describe that one OR, OR10H1, is predominantly expressed in the human urinary bladder with a notably higher expression at mRNA and protein level in bladder cancer tissues. Interestingly, also significantly higher amounts of OR10H1 transcripts were detectable in the urine of bladder cancer patients than in the urine of control persons. We identified the sandalwood-related compound Sandranol as a specific agonist of OR10H1. This deorphanization allowed the functional characterization of OR10H1 in BFTC905 bladder cancer cells. The effect of receptor activation was morphologically apparent in cell rounding, accompanied by changes in the cytoskeleton detected by β-actin, T-cadherin and β-Catenin staining. In addition, Sandranol treatment significantly diminished cell viability, cell proliferation and migration and induced a limited degree of apoptosis. Cell cycle analysis revealed an increased G1 fraction. In a concentration-dependent manner, Sandranol application elevated cAMP levels, which was reduced by inhibition of adenylyl cyclase, and elicited intracellular Ca2+ concentration increase. Furthermore, activation of OR10H1 enhanced secretion of ATP and serotonin. Our results suggest OR10H1 as a potential biomarker and therapeutic target for bladder cancer.

Keywords: OR10H1; biomarker; bladder; bladder cancer; next generation sequencing; olfactory receptor.


Figures

FIGURE 1
FIGURE 1
Expression pattern of OR10H1 and other ectopically expressed ORs in bladder cancer tissues. (A) The heat map shows the FPKM values of the 30 most highly expressed ORs found in 25 different human bladder cancer tissues and in the healthy bladder (N). Healthy bladder = average expression in five different healthy bladder tissues. FPKM values are visualized by color depth; dark blue indicates FPKM values > 3 and light blue indicates FPKM values < 0.5. (B) Box-plot showing the expression of OR10H1 in normal bladder tissues (n = 11) and bladder cancer tissues and – cell lines (n = 25). (C) Read coverage of OR10H1 detected in bladder cancer tissues and visualized by the Integrative Genomic Viewer. Reads are visualized as gray squares. Splicing is shown as red arc. Bottom: Arrows show the localization of the intron-spanning PCR Primers (P1, P2). (D) Protein expression of OR10H1 in human bladder cancer tissues. Top left: IHC of an urothelial carcinoma tissue with glandular differentiation. The expression of OR10H1 is localized only in cancerous cells. Scale bar: 200 μm, enlarged: 200×. Top right: IHC of an urothelial bladder carcinoma tissue. Scale bar: 100 μm, enlarged: 100×. Bottom left and right: Normal bladder urothelial tissue. Left: scale bar: 100 μm, enlarged: 100×, right: scale bar: 20 μm, enlarged: 20×. DAB chromogenic staining was used for the visualization of protein expression. HE was used to reveal the tissue architecture. (E) Detection of OR10H1 transcript in 10 human urine samples from patients with bladder cancer, determined by RT-PCR. M, marker. (F) Bar chart showing the amount of OR10H1 transcript relative to TATA Box binding protein (TBP) as a reference gene (see section “Materials and Methods” for details) in human urine samples from patients suffering from bladder cancer (n = 19) and from healthy persons (n = 25). The relative transcript amount was calculated using TBP as reference gene. p < 0.05. (G) Expression of OR10H1 in different normal tissues (other tissues: n = 83, bladder tissues/cell lines: n = 8). For detailed information on datasets see Supplementary Table S2.
FIGURE 2
FIGURE 2
Expression of OR10H1 in cell lines originated from normal bladder tissues (UP) and cancerous bladder tissues. (A) mRNA expression of OR10H1 in different urothelial carcinoma cells and normal urothelial cells. Carcinoma cell lines: BC61, MGHU4, BFTC-905, RT112, 639v, VMCUB1, SW1710, 5637, 253J, T-24, J82, 647v, UMUC3, UMUC6, HT1376, SD. Normal urothelial cells: TERT-NHUC. (B) Expression of OR10H1 in independent primary cultures of normal urothelial cells (UP) and following induction of differentiation in UPs or the immortalized benign urothelial cell line HBLAK by two different protocols (TZ/PD or Ca2+). OR10H1 expression was determined by qRT-PCR and was adjusted to TBP mRNA. Expression in SD (red) was measured in (A,B) for comparison. (C) Expression of OR10H1 in BFTC905 cells. Immunocytochemical staining of OR10H1 in BFTC905 cells with a specific OR10H1-antibody. Scale bar: 10 μm.
FIGURE 3
FIGURE 3
Luciferase activity in OR10H1-transfected Hana3A-cells. Activation of OR10H1-transfected Hana3A cells by Sandranol. Bar chart showing normalized luminescence values upon activation with Sandranol. OR-transfected cells: Hana3A cells transfected with pCI-vector containing OR10H1. pCI-transfected control cells: Hana3A cells transfected with pCI-vector alone.
FIGURE 4
FIGURE 4
Physiological effects of Sandranol application on BFTC905 cells. (A) Representative responses of BFTC905 cells stimulated with Sandranol in calcium imaging experiments. Application of Sandranol at concentrations of 100, 300, and 500 μM induced a dose-dependent calcium increase. (B) Bar chart showing mean amplitudes of Sandranol-induced Ca2+ signals in BFTC905 cells. (C) Localization of Ca2+ in BFTC905 cells upon addition of ATP, Sandranol or Sandranol plus EGTA in Ringer’s solution. N = 64. (D) Representative trace of untreated HANA3A cells stimulated with Sandranol (500 μM). (E) Concentration-dependent increase of the cAMP level upon stimulation with Sandranol (50, 100, 300, 500, 750, and 1000 μM) (N = 3 – 6). Dark gray bars represent the increase of the cAMP level induced by Sandranol alone on BFTC905 cells and light gray bars demonstrate the effect after co-incubation with the adenylyl cyclase inhibitor SQ22536 (100 μM). Significance was tested using One-Way repeated measures ANOVA with a Tukey’s post hoc test. (F) Data from (E) were plotted in a concentration response curve; using the Hill equation yielded an EC50 of 326 μM. p < 0.05, ∗∗p < 0.01.
FIGURE 5
FIGURE 5
Physiological effects on BFTC905 cells upon stimulation with Sandranol. (A) Delta CT-values of RT-PCR assays for various interleukins and cell adhesion molecules in BFTC905 cells stimulated with Sandranol (300 μM) for 24 h. CLDN1, Claudin-1; OCLN, Occludin; PANX1, Pannexin-1; E-CAD, E-Cadherin; IL-1, Interleukin-1; IL-10, Interleukin-10; IL-12, Interleukin-12; IL-15, Interleukin-15; ICAM, ICAM-1, Intercellular Adhesion Molecule 1; Cx43, Connexin 43; AQP3, AquaPorin-3; CLDN4, Claudin-4; CD29, Integrin B1. Amount of OR10H1 transcript is calculated relative to TATA Box binding protein (TBP) as a reference gene. (B) Induction of a dose-dependent increase in ATP in BFTC905 cells upon Sandranol stimulation after 24 h. p < 0.05, ∗∗p < 0.01.
FIGURE 6
FIGURE 6
Impact of Sandranol on cellular properties of BFTC905 cells. (A) Analyses of cell migration by a scratch assay after Sandranol stimulation (10, 50, and 100 μM) for 24 and 48 h. Bar chart shows the statistical analysis of the area overgrown in scratch assay experiments. N = 3 assays. (B) Bar chart showing statistical analysis of area overgrown by BFTC905 cells in scratch assay experiments. Gray: treatment for 24 h, black: treatment for 48 h. N = 3 assays. (C) Proliferation analyses by EdU incorporation of BFTC905 cells after stimulation with Sandranol (100 and 300 μM). (D) Cell cycle analysis of BFTC905 cells after stimulation with Sandranol (100 μM). All cell cycle phases were significantly different in treated cells. (E) Cell viability in BFTC905 cells induced by Sandranol (300 μM) treatment for 24 h. Bar chart showing relative caspase activity in the BFTC905 cells. p < 0.05.
FIGURE 7
FIGURE 7
BFTC905 cell morphology after Sandranol treatment. (A) Morphological changes in BFTC905 cells induced by Sandranol (100 μM/200 μM) after 24 (left) and 48 h (right). (B) Immunocytochemical staining of the Sandranol-treated BFTC905 cells (100 μM for 24 h) with antibodies detecting β-Catenin and phalloidin (α-β-Actin) staining for detecting cytoskeletal β-Actin. (C) Immunocytochemical staining of Sandranol-treated BFTC905 cells (300 μM for 24 h) with an antibody detecting T-Cadherin (green, dilution: 1:100). DAPI was used to visualize the nuclei of BFTC905 cells. Scale bar: 50 μm.

References

    1. Bakalyar H. A., Reed R. R. (1991). The second messenger cascade in olfactory receptor neurons. 1 204–208. 10.1016/0959-4388(91)90079-M - DOI - PubMed
    1. Ballabh B., Chaurasia O. P., Ahmed Z., Singh S. B. (2008). Traditional medicinal plants of cold desert Ladakh-used against kidney and urinary disorders. 118 331–339. 10.1016/j.jep.2008.04.022 - DOI - PubMed
    1. Beane J., Vick J., Schembri F., Anderlind C., Gower A., Campbell J., et al. (2011). Characterizing the impact of smoking and lung cancer on the airway transcriptome using RNA-seq. 4 803–817. 10.1158/1940-6207.CAPR-11-0212 - DOI - PMC - PubMed
    1. Bommareddy A., Crisamore K., Fillman S., Brozena S., Steigerwalt J., Landis T., et al. (2015). Survivin Down-regulation by alpha-Santalol is not mediated through PI3K-AKT pathway in human breast cancer cells. 35 5353–5357. - PubMed
    1. Braun T., Voland P., Kunz L., Prinz C., Gratzl M. (2007). Enterochromaffin cells of the human gut: sensors for spices and odorants. 132 1890–1901. 10.1053/j.gastro.2007.02.036 - DOI - PubMed