. 2018 May 16:9:542.
doi: 10.3389/fphys.2018.00542. eCollection 2018.

Prenatal Lipopolysaccharide Exposure Promotes Dyslipidemia in the Male Offspring Rats

Affiliations

Prenatal Lipopolysaccharide Exposure Promotes Dyslipidemia in the Male Offspring Rats

Shiyun Yu et al. Front Physiol. .

Abstract

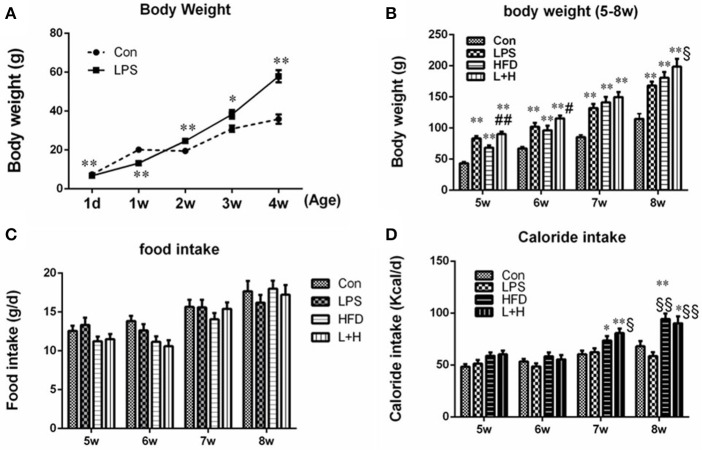
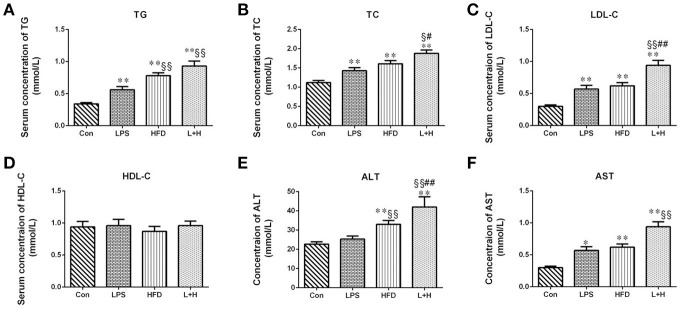
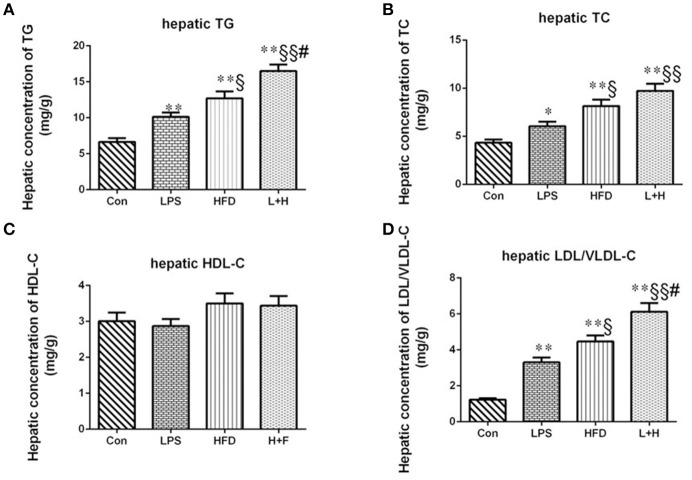
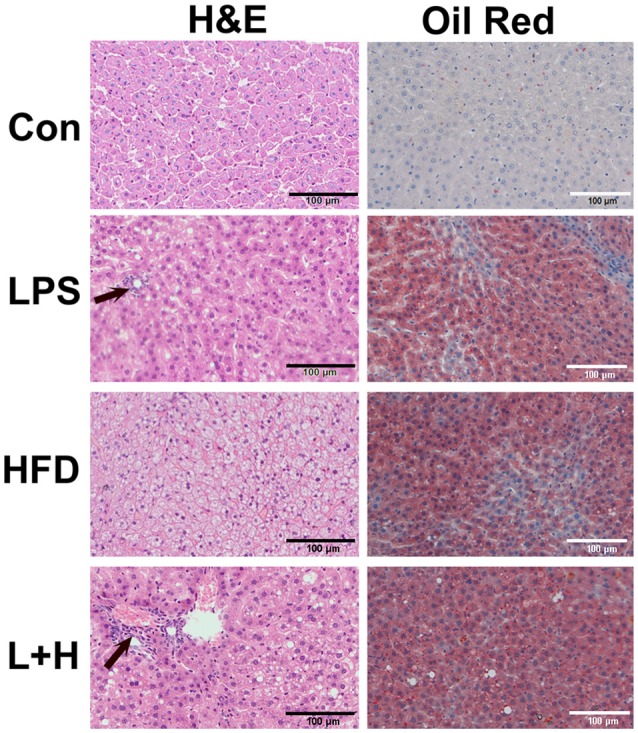
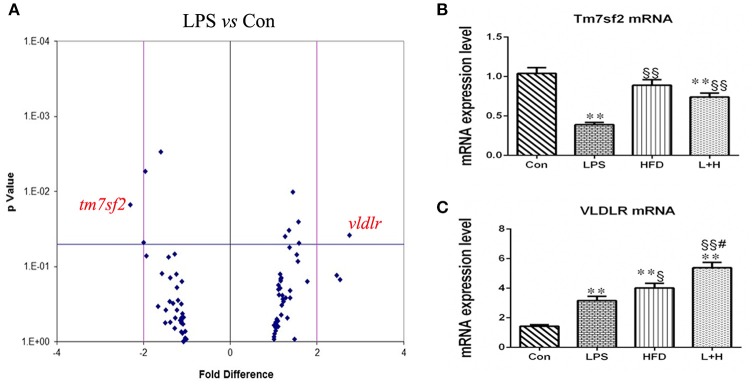
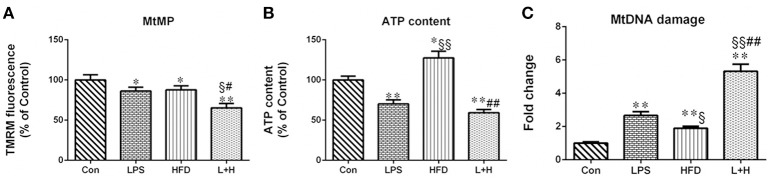
Inflammation is critical to the pathogenesis of cardiovascular diseases (CVDs). We have uncovered intrauterine inflammation induced by lipopolysaccharide (LPS) increases CVDs in adult offspring rats. The present study aimed to explore the role of prenatal exposure to LPS on the lipid profiles in male offspring rats and to further assess their susceptibility to high fat diet (HFD). Maternal LPS (0.79 mg/kg) exposure produced a significant increase in serum and hepatic levels of total cholesterol, triglycerides, low-density lipoprotein cholesterol, aspartate amino transferase as well as liver morphological abnormalities in 8-week-old offspring rats. Meanwhile, disturbed gene expressions involved in hepatic lipid metabolism and related signaling pathways were found, especially the up-regulated very-low density lipoprotein receptor (VLDLR) and down-regulated transmembrane 7 superfamily member 2 (TM7SF2). Following HFD treatment, however, the lipid profile shifts and liver dysfunction were exacerbated compared to the offsprings treated with prenatal LPS exposure alone. Compared with that in control offsprings, the hepatic mitochondria (Mt) in offspring rats solely treated with HFD exhibited remarkably higher ATP level, enforced Complex IV expression and a sharp reduction of its activity, whereas the offsprings from LPS-treated dams showed the loss of ATP content, diminished membrane potential, decline in protein expression and activity of mitochondrial respiratory complex IV, increased level of MtDNA deletion as well. Furthermore, treatment with HFD deteriorated these mitochondrial disorders in the prenatally LPS-exposed offspring rats. Taken together, maternal LPS exposure reinforces dyslipidemia in response to a HFD in adult offsprings, which should be associated with mitochondrial abnormalities and disturbed gene expressions of cholesterol metabolism.

Keywords: dyslipidemia; inflammation; intrauterine environment; mitochondrion; offspring.


Figures

Figure 1
Figure 1
Body weights in offspring rats at the age of 1 day, 1, 2, 3, and 4 weeks (A). Body weights in offspring rats from 5 to 8 weeks old (B). Food intake (C) and caloride intake (D) in offspring rats from 5 to 8 weeks old. The data are presented as the mean ± SEM. n = 10 in each group. *P < 0.05, **P < 0.01 vs. control, §P < 0.05, §§P < 0.01 vs. LPS group, #P < 0.05, ##P < 0.01 vs. HFD group (One-way ANOVA). Con group, male offspring rats treated with prenatal saline and postnatal normal diet from 4 to 8 weeks old; LPS group, male offspring rats treated with prenatal LPS and postnatal normal diet from 4 to 8 weeks old; HFD group, male offspring rats treated with prenatal saline and postnatal high fat diet from 4 to 8 weeks old; L+H group, male offspring rats treated with prenatal LPS and postnatal high fat diet from 4 to 8 weeks old.
Figure 2
Figure 2
Serum levels of total cholesterol (A), triglycerides (B), low-density lipoprotein cholesterol (C), high-density lipoprotein cholesterol (D), alanine aminotransferase (E), aspartate amino transferase (F) in 8-week-old offspring rats. The data are presented as the mean ± SEM. n = 6 in each group. *P < 0.05, **P < 0.01 vs. control, §P < 0.05, §§P < 0.01 vs. LPS group, #P < 0.05, ##P < 0.01 vs. HFD group (One-way ANOVA). Con group, male offspring rats treated with prenatal saline and postnatal normal diet from 4 to 8 weeks old; LPS group, male offspring rats treated with prenatal LPS and postnatal normal diet from 4 to 8 weeks old; HFD group, male offspring rats treated with prenatal saline and postnatal high fat diet from 4 to 8 weeks old; L+P group, male offspring rats treated with prenatal LPS and postnatal high fat diet from 4 to 8 weeks old.
Figure 3
Figure 3
Hepatic contents of triglycerides (A), total cholesterol (B), high-density lipoprotein cholesterol (C), low/very low-density lipoprotein cholesterol (D) in 8-week-old offspring rats. The data are presented as the mean ± SEM. n = 6 in each group. *P < 0.05, **P < 0.01 vs. control, §P < 0.05, §§P < 0.01 vs. LPS group, #P < 0.05 vs. HFD group (One-way ANOVA). Con group, male offspring rats treated with prenatal saline and postnatal normal diet from 4 to 8 weeks old; LPS group, male offspring rats treated with prenatal LPS and postnatal normal diet from 4 to 8 weeks old; HFD group, male offspring rats treated with prenatal saline and postnatal high fat diet from 4 to 8 weeks old; L+P group, male offspring rats treated with prenatal LPS and postnatal high fat diet from 4 to 8 weeks old.
Figure 4
Figure 4
Histopathologic observation of the liver in 8-week-old offspring rats. H&E staining was in left line and oil red staining was in right line. Arrow represented lymphomonocytic perivenular infiltration in liver. Con group, male offspring rats treated with prenatal saline and postnatal normal diet from 4 to 8 weeks old; LPS group, male offspring rats treated with prenatal LPS and postnatal normal diet from 4 to 8 weeks old; HFD group, male offspring rats treated with prenatal saline and postnatal high fat diet from 4 to 8 weeks old; L+P group, male offspring rats treated with prenatal LPS and postnatal high fat diet from 4 to 8 weeks old.
Figure 5
Figure 5
Hepatic gene expression related to lipid metabolism and other related pathways in 8-week-old offspring rats. (A) Differentially expressed genes between the control and LPS groups. Differentially expressed genes detected by RT-PCR array. A 2-fold difference and p value = 0.05 were marked as vertical and horizontal lines, respectively. n = 3 in each group. mRNA expressions of Tm7sf2 (B) and VLDLR (C) in the livers of offspring rats. The data are presented as the mean ± SEM. n = 6 in each group. **P < 0.01 vs. control, §P < 0.05, §§P < 0.01 vs. LPS group, #P < 0.05 vs. HFD group (One-way ANOVA). Tm7sf2, transmembrane 7 superfamily member 2; VLDLR, very low density lipoprotein receptor. Con group, male offspring rats treated with prenatal saline and postnatal normal diet from 4 to 8 weeks old; LPS group, male offspring rats treated with prenatal LPS and postnatal normal diet from 4 to 8 weeks old; HFD group, male offspring rats treated with prenatal saline and postnatal high fat diet from 4 to 8 weeks old; L+H group, male offspring rats treated with prenatal LPS and postnatal high fat diet from 4 to 8 weeks old.
Figure 6
Figure 6
Hepatic mitochondrial membrane potential, (A), ATP content (B) and mitochondrial DNA (MtDNA) damage (C) in 8-week-old offspring rats. The result about mitochondrial membrane potential and ATP content is expressed as % control, however, MtDNA damage is represented as “fold increase” over the controls in mitochondrial common deletion. The data are presented as the mean ± SEM. n = 6 in each group. *P < 0.05, **P < 0.01 vs. control, §P < 0.05, §§P < 0.01 vs. LPS group, #P < 0.05, ##P < 0.01 vs. HFD group (One-way ANOVA). Con group, male offspring rats treated with prenatal saline and postnatal normal diet from 4 to 8 weeks old; LPS group, male offspring rats treated with prenatal LPS and postnatal normal diet from 4 to 8 weeks old; HFD group, male offspring rats treated with prenatal saline and postnatal high fat diet from 4 to 8 weeks old; L+H group, male offspring rats treated with prenatal LPS and postnatal high fat diet from 4 to 8 weeks old.
Figure 7
Figure 7
The alterations in mitochondrial respiratory complex proteins in 8-week-old offspring rats. protein expression of mitochondrial respiratory complex I (A), II (B), III (C), IV (D), and V (E). The activity of mitochondrial respiratory complex protein IV (F). The data are presented as the mean ± SEM. n = 6 in each group. *P < 0.05, **P < 0.01 vs. control, §P < 0.05, §§P < 0.01 vs. LPS group, ##P < 0.01 vs. HFD group (One-way ANOVA). Con group, male offspring rats treated with prenatal saline and postnatal normal diet from 4 to 8 weeks old; LPS group, male offspring rats treated with prenatal LPS and postnatal normal diet from 4 to 8 weeks old; HFD group, male offspring rats treated with prenatal saline and postnatal high fat diet from 4 to 8 weeks old; L+H group, male offspring rats treated with prenatal LPS and postnatal high fat diet from 4 to 8 weeks old.

Similar articles

Cited by

References

    1. American Heart Association Nutrition Committee. Lichtenstein A. H., Appel L. J., Brands M., Carnethon M., Daniels S., et al. (2006). Diet and lifestyle recommendations revision 2006: a scientific statement from the American Heart Association Nutrition Committee. Circulation 14, 82–96. 10.1161/CIRCULATIONAHA.106.176158 - DOI - PubMed
    1. Andrews R. M., Kubacka I., Chinnery P. F., Lightowlers R. N., Turnbull D. M., Howell N. (1999). Reanalysis and revision of the Cambridge reference sequence for human mitochondrial DNA. Nat. Genet. 23:147 10.1038/13779 - DOI - PubMed
    1. Bacchiega B. C., Bacchiega A. B., Usnayo M. J., Bedirian R., Singh G., Pinheiro G. D. (2017). Interleukin 6 inhibition and coronary artery disease in a high-risk population: a prospective community-based clinical study. J. Am. Heart Assoc. 6:e005038. 10.1161/JAHA.116.005038 - DOI - PMC - PubMed
    1. Barker D. J. (2004). The developmental origins of chronic adult disease. Acta Paediatr. Suppl. 93, 26–33. 10.1111/j.1651-2227.2004.tb00236.x - DOI - PubMed
    1. Begriche K., Massart J., Robin M. A., Borgne-Sanchez A., Fromenty B. (2011). Drug-induced toxicity on mitochondria and lipid metabolism: mechanistic diversity and deleterious consequences for the liver. J. Hepatol. 54, 773–794. 10.1016/j.jhep.2010.11.006 - DOI - PubMed

LinkOut - more resources