

Spectral Dynamics of Resting State fMRI Within the Ventral Tegmental Area and Dorsal Raphe Nuclei in Medication-Free Major Depressive Disorder in Young Adults
- PMID: 29867598
- PMCID: PMC5958223
- DOI: 10.3389/fpsyt.2018.00163
Spectral Dynamics of Resting State fMRI Within the Ventral Tegmental Area and Dorsal Raphe Nuclei in Medication-Free Major Depressive Disorder in Young Adults
Abstract
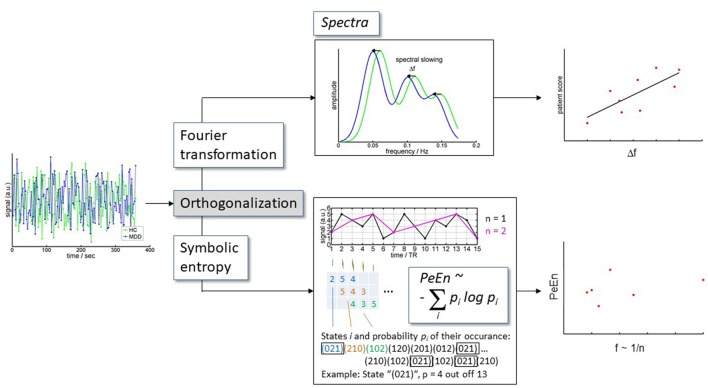
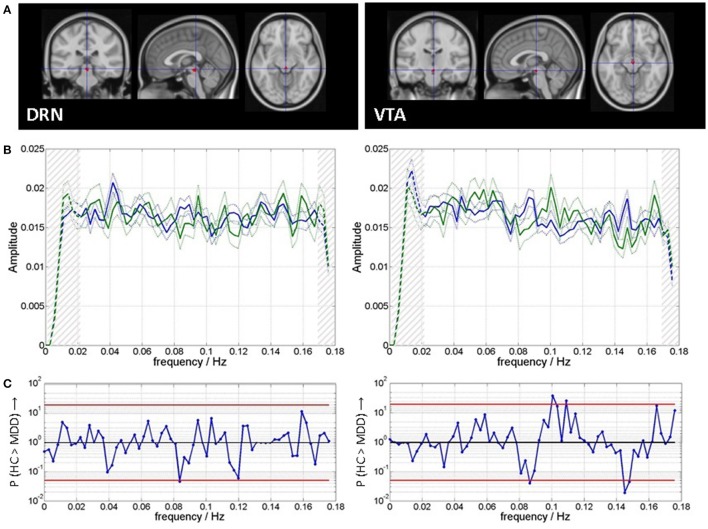
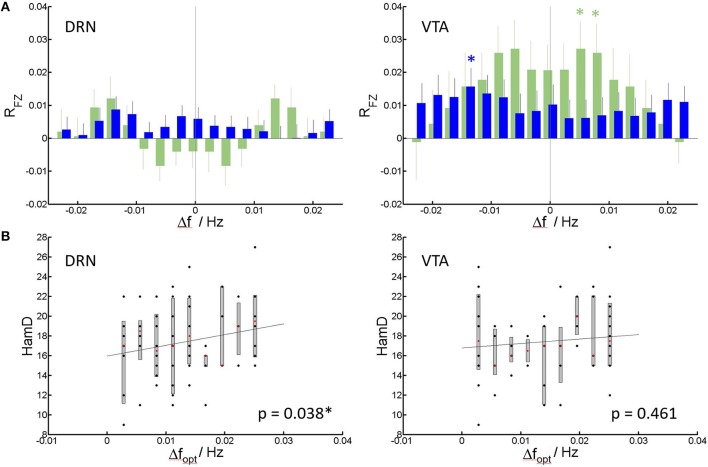
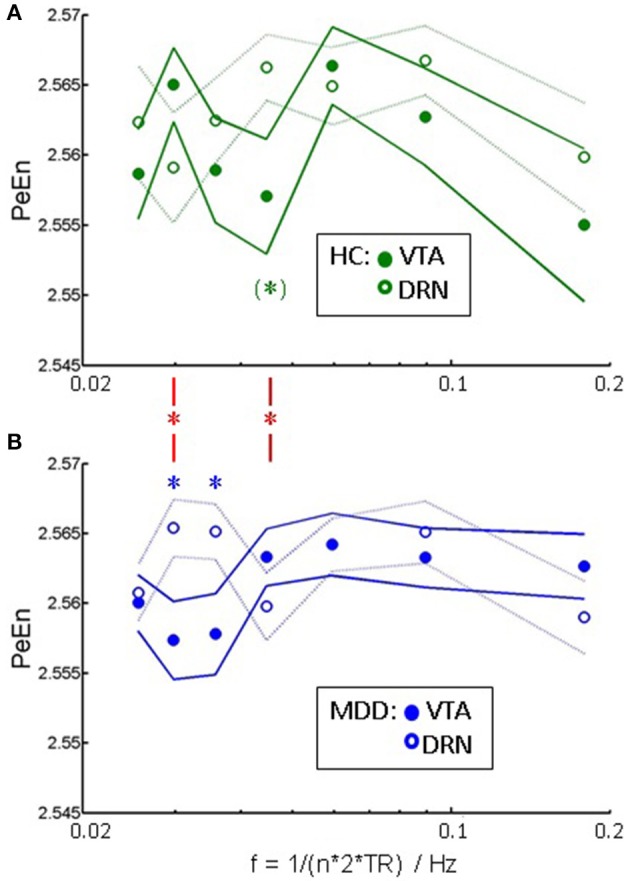
Background: Dorsal raphe nucleus (DRN) and ventral tegmental area (VTA) are major brainstem monamine nuclei consisting of serotonin and dopamine neurons respectively. Animal studies show that firing patterns in both nuclei are altered when animals exhibit depression like behaviors. Functional MRI studies in humans have shown reduced VTA activation and DRN connectivity in depression. This study for the first time aims at investigating the functional integrity of local neuronal firing concurrently in both the VTA and DRN in vivo in humans using spectral analysis of resting state low frequency fluctuation fMRI. Method: A total of 97 medication-free subjects-67 medication-free young patients (ages 18-30) with major depressive disorder and 30 closely matched healthy controls were included in the study to detect aberrant dynamics in DRN and VTA. For the investigation of altered localized dynamics we conducted power spectral analysis and above this spectral cross correlation between the two groups. Complementary to this, spectral dependence of permutation entropy, an information theoretical measure, was compared between groups. Results: Patients displayed significant spectral slowing in VTA vs. controls (p = 0.035, corrected). In DRN, spectral slowing was less pronounced, but the amount of slowing significantly correlated with 17-item Hamilton Depression Rating scores of depression severity (p = 0.038). Signal complexity as assessed via permutation entropy showed spectral alterations inline with the results on spectral slowing. Conclusion: Our results indicate that altered functional dynamics of VTA and DRN in depression can be detected from regional fMRI signal. On this basis, impact of antidepressant treatment and treatment response can be assessed using these markers in future studies.
Keywords: depression; dopamine; dorsal raphe nucleus; resting state; resting state fMRI; serotonin; ventral tegmental nucleus.
Figures
Similar articles
-
Resting State Functional Connectivity of Dorsal Raphe Nucleus and Ventral Tegmental Area in Medication-Free Young Adults With Major Depression.Front Psychiatry. 2019 Jan 25;9:765. doi: 10.3389/fpsyt.2018.00765. eCollection 2018. Front Psychiatry. 2019. PMID: 30761028 Free PMC article.
-
Characterization of dopaminergic projections from the ventral tegmental area and the dorsal raphe nucleus to the orbital frontal cortex.Eur J Neurosci. 2024 Apr;59(7):1460-1479. doi: 10.1111/ejn.16230. Epub 2023 Dec 28. Eur J Neurosci. 2024. PMID: 38155094
-
Rostral and Caudal Ventral Tegmental Area GABAergic Inputs to Different Dorsal Raphe Neurons Participate in Opioid Dependence.Neuron. 2019 Feb 20;101(4):748-761.e5. doi: 10.1016/j.neuron.2018.12.012. Epub 2019 Jan 10. Neuron. 2019. PMID: 30638902
-
The roles of dopamine and serotonin, and of their receptors, in regulating sleep and waking.Prog Brain Res. 2008;172:625-46. doi: 10.1016/S0079-6123(08)00929-1. Prog Brain Res. 2008. PMID: 18772053 Review.
-
The Raphe Dopamine System: Roles in Salience Encoding, Memory Expression, and Addiction.Trends Neurosci. 2021 May;44(5):366-377. doi: 10.1016/j.tins.2021.01.002. Epub 2021 Feb 8. Trends Neurosci. 2021. PMID: 33568331 Review.
Cited by
-
High-resolution and high-sensitivity PET for quantitative molecular imaging of the monoaminergic nuclei: A GATE simulation study.Med Phys. 2022 Jul;49(7):4430-4444. doi: 10.1002/mp.15653. Epub 2022 May 15. Med Phys. 2022. PMID: 35390182 Free PMC article.
-
Quantification of Kuramoto Coupling Between Intrinsic Brain Networks Applied to fMRI Data in Major Depressive Disorder.Front Comput Neurosci. 2022 Mar 3;16:729556. doi: 10.3389/fncom.2022.729556. eCollection 2022. Front Comput Neurosci. 2022. PMID: 35311219 Free PMC article.
-
Where do the symptoms come from in depression? Topography and dynamics matter.Brain Commun. 2024 Mar 5;6(2):fcae067. doi: 10.1093/braincomms/fcae067. eCollection 2024. Brain Commun. 2024. PMID: 38515441 Free PMC article.
-
Differences in Functional Connectivity Networks Related to the Midbrain Dopaminergic System-Related Area in Various Psychiatric Disorders.Schizophr Bull. 2020 Sep 21;46(5):1239-1248. doi: 10.1093/schbul/sbz121. Schizophr Bull. 2020. PMID: 31901932 Free PMC article.
-
Altered spatio-temporal state patterns for functional dynamics estimation in first-episode drug-naive major depression.Brain Imaging Behav. 2022 Dec;16(6):2744-2754. doi: 10.1007/s11682-022-00739-1. Epub 2022 Nov 4. Brain Imaging Behav. 2022. PMID: 36333522 Free PMC article.
References
-
- Cooper JR, Bloom FE, Roth RH. The Biochemical Basis of Neuropharmacology. New York, NY: Oxford University Press; (1991). p. 250–2.
-
- Delgado PL, Price LH, Miller HL, Salomon RM, Licinio J, Krystal JH, et al. . Rapid serotonin depletion as a provocative challenge test for patients with major depression: relevance to antidepressant action and the neurobiology of depression. Psychopharmacol Bull. (1991) 27:321–30. - PubMed
-
- Anand A, Charney DS. Catecholamines in depression. In: van Praag HM, Honig A. editors. Depression: Neurobiological, Psychopahthological and Therapeutic Advances. London: John Wiley & Sons Ltd; (1997). p. 147–78.
Grants and funding
LinkOut - more resources
Full Text Sources
Other Literature Sources