. 2018 May 17:9:233.
doi: 10.3389/fendo.2018.00233. eCollection 2018.

A Glucagon-Like Peptide-1 Receptor Agonist Lowers Weight by Modulating the Structure of Gut Microbiota

Affiliations

A Glucagon-Like Peptide-1 Receptor Agonist Lowers Weight by Modulating the Structure of Gut Microbiota

Li Zhao et al. Front Endocrinol (Lausanne). .

Abstract

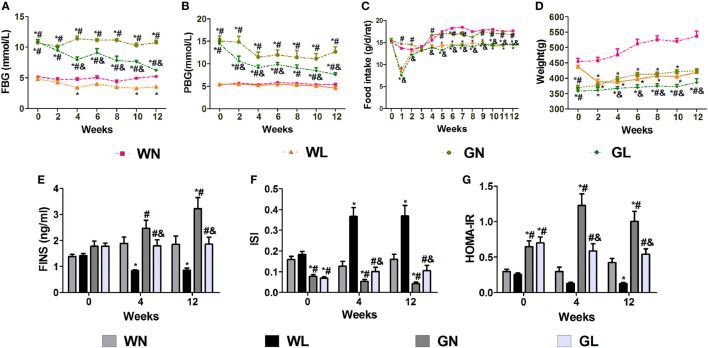
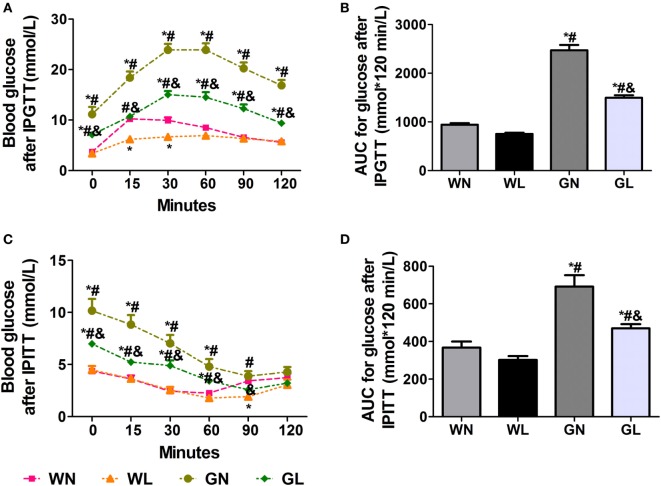
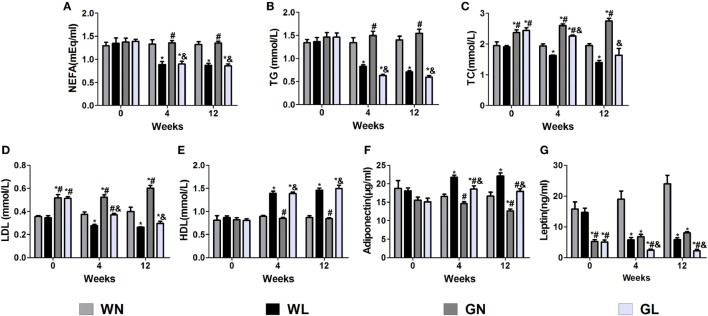
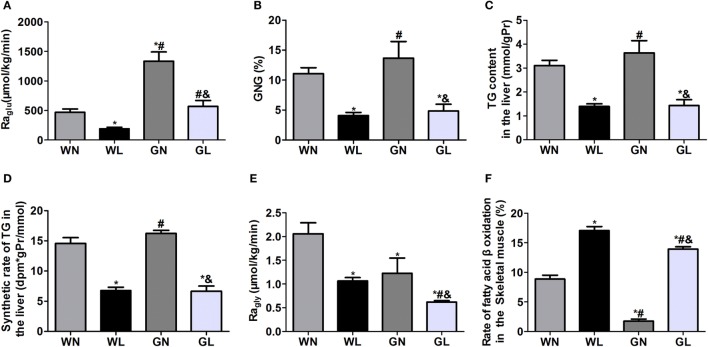
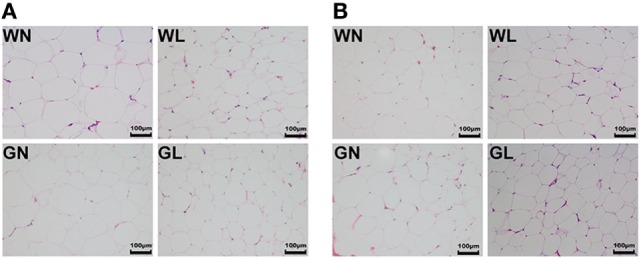
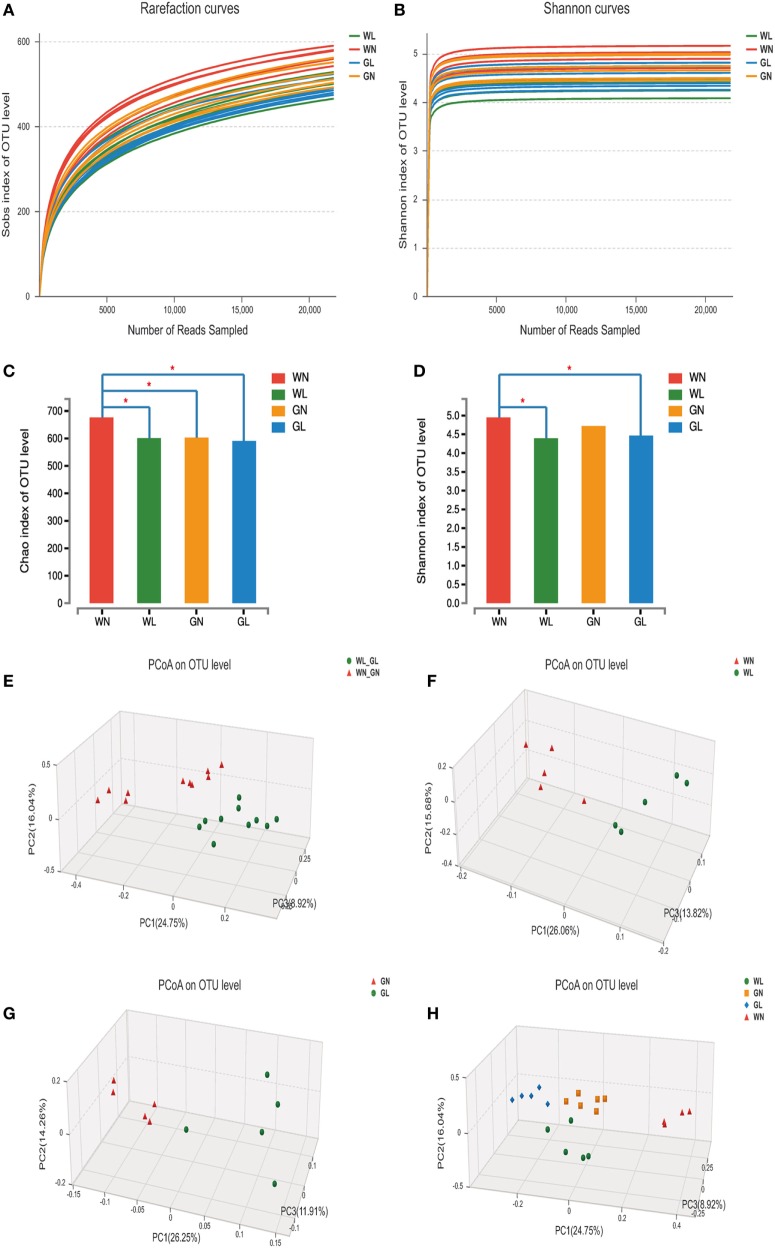
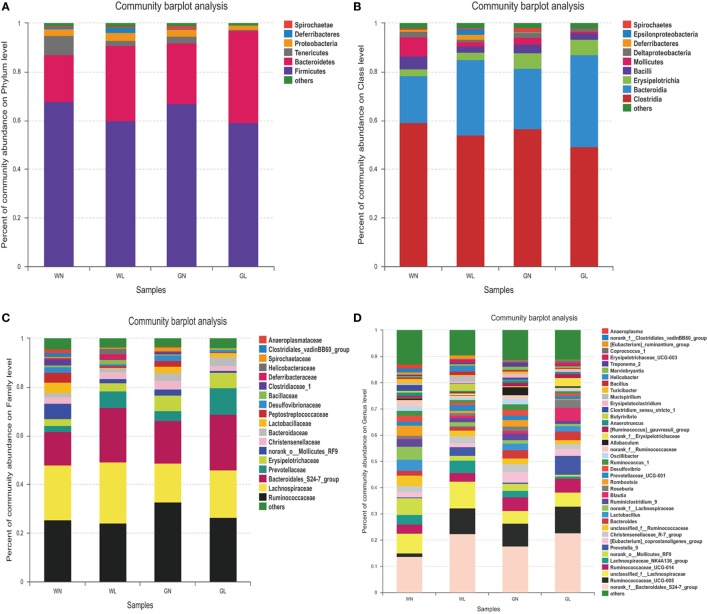
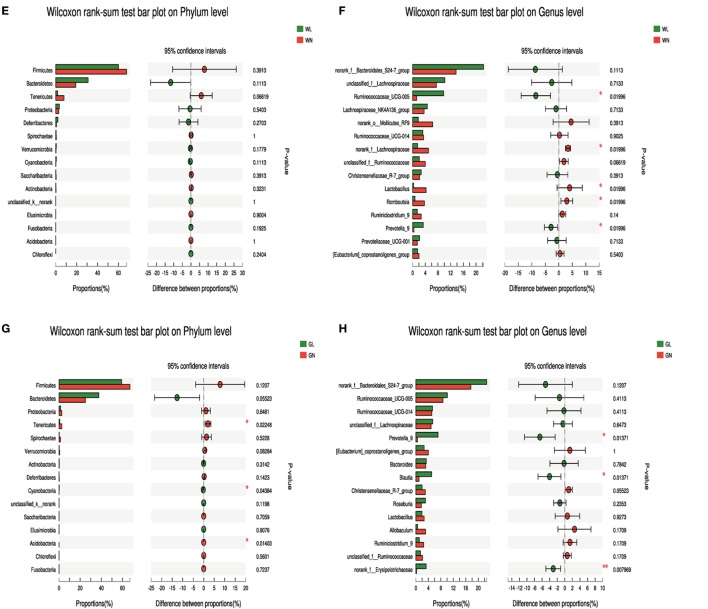
In addition to improving glucose metabolism, liraglutide, a glucagon-like peptide-1 receptor agonist, has weight-loss effects. The underlying mechanisms are not completely understood. This study was performed to explore whether liraglutide could lower weight by modulating the composition of the gut microbiota in simple obese and diabetic obese rats. In our study, Wistar and Goto-Kakizaki (GK) rats were randomly treated with liraglutide or normal saline for 12 weeks. The biochemical parameters and metabolic hormones were measured. Hepatic glucose production and lipid metabolism were also assessed with isotope tracers. Changes in gut microbiota were analyzed by 16S rRNA gene sequencing. Both glucose and lipid metabolism were significantly improved by liraglutide. Liraglutide lowered body weight independent of glycemia status. The abundance and diversity of gut microbiota were considerably decreased by liraglutide. Liraglutide also decreased obesity-related microbial phenotypes and increased lean-related phenotypes. In conclusion, liraglutide can prevent weight gain by modulating the gut microbiota composition in both simple obese and diabetic obese subjects.

Keywords: glucagon-like peptide-1; gut microbiota; metabolism; obesity; type 2 diabetes.


Figures

Figure 1
Figure 1
Liraglutide attenuated glucose levels, body weight gain, and insulin resistance. (A) Fasting blood glucose (FBG) levels. (B) Postprandial blood glucose (PBG) levels. (C) Food intake. (D) Body weight. (E) Fasting insulin (FINS) levels. (F) Insulin sensitivity index (ISI). (G) The homeostatic model assessment-insulin resistance (HOMA-IR). Data are presented as the mean ± SEM. *P < 0.05 vs WN group; #P < 0.05 vs WL group; and &P < 0.05 vs GN group.
Figure 2
Figure 2
Liraglutide improved glucose tolerance and insulin tolerance. (A) Blood glucose levels after intraperitoneal glucose tolerance test (IPGTT). (B) The area under the curve (AUC) after IPGTT. (C) Blood glucose levels after intraperitoneal insulin tolerance test (IPITT). (D) The AUC after IPITT. Data are presented as the mean ± SEM. *P < 0.05 vs WN group; #P < 0.05 vs WL group; and &P < 0.05 vs GN group.
Figure 3
Figure 3
Liraglutide improved the lipid profiles and the leptin and adiponectin levels. (A) Non-esterified fatty acid (NEFA) levels. (B) Triglyceride (TG) levels.(C) Total cholesterol (TC) levels. (D) Low-density lipoprotein (LDL) cholesterol levels. (E) High-density lipoprotein (HDL) cholesterol levels. (F) Adiponectin levels. (G) Leptin levels. Data are presented as the mean ± SEM. *P < 0.05 vs WN group; #P < 0.05 vs WL group; and &P < 0.05 vs GN group.
Figure 4
Figure 4
Liraglutide inhibited hepatic glucose production, decreased hepatic fat deposition and lipogenesis, and promoted fatty acid β oxidation. (A) Rate of glucose appearance (Raglu). (B) Gluconeogenesis (GNG). (C) Triglyceride (TG) content in the liver. (D) TG synthetic rates in the liver. (E) Rate of glycerol appearance (Ragly). (F) Fatty acid β-oxidation in the skeletal muscle. Data are presented as the mean ± SEM. *P < 0.05 vs WN group; #P < 0.05 vs WL group; and &P < 0.05 vs GN group.
Figure 5
Figure 5
Liraglutide reduced adipocyte size in both visceral and subcutaneous fat depots. (A) Mesenteric white adipose tissues (WAT) hematoxylin and eosin (HE) staining (magnification 200×). (B) Inguinal WAT HE staining (magnification 200×).
Figure 6
Figure 6
Liraglutide changed the overall structure of gut microbiota. (A) The rarefaction curves. (B) Shannon curves. (C) Chao index levels. (D) Shannon index levels. (E) Principal coordinate analysis (PCoA) generated using an unweighted UniFrac metric between before and after liraglutide intervention in all rats. (F) PCoA between WN and WL groups. (G) PCoA between GN and GL groups. (H) PCoA between the four groups.
Figure 7
Figure 7
Liraglutide changed the composition of gut microbiota in both simple obese and type 2 diabetes mellitus obese rats. (A) Composition of gut microbiota at the phylum level. (B) Composition of gut microbiota at the class level. (C) Composition of gut microbiota at the family level. (D) Composition of gut microbiota at the genus level. (E) The differential species between the WN and WL groups at the phylum level. (F) The differential species between the WN and WL groups at the genus level. (G) The differential species between the GN and GL groups at the phylum level. (H) The differential species between the GN and GL groups in the genus level. *P < 0.05 and **P < 0.01.
Figure 7
Figure 7
Liraglutide changed the composition of gut microbiota in both simple obese and type 2 diabetes mellitus obese rats. (A) Composition of gut microbiota at the phylum level. (B) Composition of gut microbiota at the class level. (C) Composition of gut microbiota at the family level. (D) Composition of gut microbiota at the genus level. (E) The differential species between the WN and WL groups at the phylum level. (F) The differential species between the WN and WL groups at the genus level. (G) The differential species between the GN and GL groups at the phylum level. (H) The differential species between the GN and GL groups in the genus level. *P < 0.05 and **P < 0.01.
Figure 8
Figure 8
The relationship between microbiota composition and metabolic parameters. *P < 0.05, **P < 0.01, and ***P < 0.001.

References

    1. Bauer PV, Duca FA. Targeting the gastrointestinal tract to treat type 2 diabetes. J Endocrinol (2016) 230:R95–113. 10.1530/JOE-16-0056 - DOI - PubMed
    1. Remely M, Aumueller E, Merold C, Dworzak S, Hippe B, Zanner J, et al. Effects of short chain fatty acid producing bacteria on epigenetic regulation of FFAR3 in type 2 diabetes and obesity. Gene (2014) 537:85–92. 10.1016/j.gene.2013.11.081 - DOI - PubMed
    1. Vrieze A, Holleman F, Zoetendal EG, de Vos WM, Hoekstra JB, Nieuwdorp M. The environment within: how gut microbiota may influence metabolism and body composition. Diabetologia (2010) 53:606–13. 10.1007/s00125-010-1662-7 - DOI - PMC - PubMed
    1. Wang L, Li P, Tang Z, Yan X, Feng B. Structural modulation of the gut microbiota and the relationship with body weight: compared evaluation of liraglutide and saxagliptin treatment. Sci Rep (2016) 6:33251. 10.1038/srep33251 - DOI - PMC - PubMed
    1. Turnbaugh PJ, Ley RE, Mahowald MA, Magrini V, Mardis ER, Gordon JI. An obesity-associated gut microbiome with increased capacity for energy harvest. Nature (2006) 444:1027–31. 10.1038/nature05414 - DOI - PubMed

LinkOut - more resources