. 2018 May 17:9:1080.
doi: 10.3389/fimmu.2018.01080. eCollection 2018.

STAT3-Mediated Transcriptional Regulation of Osteopontin in STAT3 Loss-of-Function Related Hyper IgE Syndrome

Affiliations

STAT3-Mediated Transcriptional Regulation of Osteopontin in STAT3 Loss-of-Function Related Hyper IgE Syndrome

Shubham Goel et al. Front Immunol. .

Abstract

Background: Hyper-IgE syndrome (HIES) caused by loss-of-function (LOF) mutations in STAT3 gene (STAT3 LOF HIES) is associated with dental and facial abnormalities in addition to immunological defects. The role of STAT3 in the pathogenesis of the dental/facial features is, however, poorly elucidated.

Objectives: Since mechanism of cellular resorption of mineralized tissues such as bone and teeth are similar, we attempted to study the expression of genes involved in bone homeostasis in STAT3 LOF HIES.

Methods: Peripheral blood mononuclear cells from healthy controls (HCs), STAT3 LOF HIES patients, STAT3-/- PC-3 cells and STAT3+/+ LNCaP cells were stimulated with IL-6 and quantitative PCR array was performed to study the relative mRNA expression of 43 pre-selected genes. PCR array finding were further evaluated after stattic induced STAT3 inhibition.

Results: Osteopontin (OPN) gene was seen to be significantly upregulated after IL-6 stimulation in HC (mean fold change 18.6, p = 0.01) compared with HIES subjects. Inhibition of STAT3 signaling by stattic followed by IL-6 stimulation abrogated the OPN response in HCs suggesting that IL-6-induced STAT3 signaling regulates OPN expression. Bioinformatics analysis predicted the presence of STAT3 response element TTCCAAGAA at position -2005 of the OPN gene.

Conclusion: Regulation of OPN gene through IL-6-mediated STAT3 activation and its significant dysregulation in STAT3 LOF HIES subjects could make OPN a plausible candidate involved in the pathogenesis of dental/facial manifestations in HIES.

Keywords: STAT3 signaling; craniosynostosis; dental anomalies; hyper-IgE syndrome; osteopontin; skeletal anomalies.


Figures
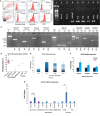
Figure 1
Figure 1
(A) Representative flow cytometry histogram of STAT3 protein expression in PC-3 and LNCaP cells. PC-3 cells had no expression of STAT3 protein. (B) STAT3 mRNA expression in PC3, LNCaP, hyper-IgE syndrome (HIES) subjects and healthy controls (HCs) by conventional PCR. PC-3 cells showed no expression of STAT3 mRNA. (C) Agarose gel pictures showing either absence or non-specific/extremely faint bands of STAT3 amplification (exons 9–22) in PC-3 cells. Gel 1 (Exons 9–10/12–24/15 and 16–17), gel 2 (exon 11), and gel 3 (exons 18-20/21/22-23) have been grouped together for representation purpose. (D) Scatter plot showing per cent STAT3 phosphorylation in HCs, HIES subjects, LNCaP, and PC3 cells; mean values are shown as horizontal bars. Bar graphs showing quantitative real time PCR (qRT-PCR) of SOCS3 mRNA expression in HC peripheral blood mononuclear cells stimulated with IL-6 in a (E) time-dependent manner at 30 ng/ml and (F) dose-dependent manner for 2 h. Data are shown as mean ± SD for three independent experiments. (G) Bar graphs showing qRT-PCR results of SOCS3 expression from HCs, HIES subjects, LNCaP, and PC-3 cells stimulated with IL-6. The primary transcript for each gene were assayed at least in duplicate and normalized to β-actin expression. (Data are represented as mean ± SD, *p < 0.05, **p < 0.01, ***p < 0.001, paired t-test.)
Figure 2
Figure 2
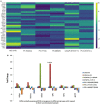
(A) Heat map of gene expression profile of HCs, hyper-IgE syndrome (HIES) subjects, LNCaP, and PC-3 cells generated using Plotly software (http/plot.ly). Scale bar −4 to +6 and >6. Fold change values were calculated using RT2 PCR array analysis software (Qiagen), an online tool. (B) Bar graphs showing differentially expressed genes in the PCR Array post IL-6 stimulation of HCs, LNCaP cells, PC3 cells, and HIES subjects with respect to their unstimulated samples. Data were normalized to mean Ct value of β-actin, GAPDH, and RPL37A genes. Statistical significance was determined by Student’s t-test (*p < 0.05, **p < 0.01, ***p < 0.001) using RT2 PCR Array Analysis software, Qiagen.
Figure 3
Figure 3
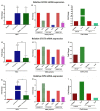
Bar graphs showing effect of stattic at different doses on cell viability and STAT3 phosphorylation on healthy controls peripheral blood mononuclear cells. Cell viability: (A) at 2 h, no effect on cell viability was observed except at high doses where growth inhibition was evident (B) at 24 h, growth was inhibited in a dose-dependent manner. Stattic abrogated the STAT3 activity in a dose (C) and time (D) dependent manner. Data are represented as mean ± SD for three independent experiments. *p < 0.05, **p < 0.01, ***p < 0.001, one way ANOVA post Tukey’s multiple comparison test.
Figure 4
Figure 4
Bar graphs showing relative mRNA expression of SOCS3, STAT3, and OPN in HC peripheral blood mononuclear cells (A,D,G) treated with either IL-6 alone or with stattic; in hyper-IgE syndrome (HIES) subjects (B,E,H) treated with IL-6 alone and in LNCaP and PC-3 cells (C,F,I) treated with IL-6 alone. The primary transcript for each gene were assayed at least in duplicate and normalized to β-actin expression. Data represented as mean ± SD, *p < 0.05, **p < 0.01, ***p < 0.001, paired t-test and Wilcoxon test.
Figure 5
Figure 5
Schematic representation of STAT3 transcription factor binding site (TFBS) in the human OPN gene. Results were obtained using STAT Finder Bioinformatics Tool (33, 34).

References

    1. Holland SM, DeLeo FR, Elloumi HZ, Hsu AP, Uzel G, Brodsky N, et al. STAT 3 mutation in the hyper IgE syndrome. N Engl J Med (2007) 357:1608–19.10.1056/NEJMoa073687 - DOI - PubMed
    1. Minegishi Y, Saito M, Tsuchiya S, Tsuge I, Takada H, Hara T, et al. Dominant-negative mutations in the DNA-binding domain of STAT 3 cause hyper-IgE syndrome. Nature (2007) 448:1058–62.10.1038/nature06096 - DOI - PubMed
    1. Chandesris MO, Melki I, Natividad A, Puel A, Fieschi C, Yun L, et al. Autosomal dominant STAT3 deficiency and hyper-IgE syndrome: molecular, cellular, and clinical features from a French national survey. Medicine (2012) 91:e1–19.10.1097/MD.0b013e31825f95b9 - DOI - PMC - PubMed
    1. Milner JD, Brenchley JM, Laurence A, Freeman AF, Hill BJ, Elias KM, et al. Impaired TH17 cell differentiation in subjects with autosomal dominant hyper-IgE syndrome. Nature (2008) 452:773–7.10.1038/nature06764 - DOI - PMC - PubMed
    1. Minegishi Y, Saito M, Nagasawa M, Takada H, Hara T, Tsuchiya S, et al. Molecular explanation for the contradiction between systemic TH17 defect & localized bacterial infection in hyper-IgE syndrome. J Exp Med (2009) 206:1291–301.10.1084/jem.20082767 - DOI - PMC - PubMed

Publication types

MeSH terms