. 2018 May 9:9:612.
doi: 10.3389/fpls.2018.00612. eCollection 2018.

Genetic Basis of Variation in Rice Seed Storage Protein (Albumin, Globulin, Prolamin, and Glutelin) Content Revealed by Genome-Wide Association Analysis

Affiliations

Genetic Basis of Variation in Rice Seed Storage Protein (Albumin, Globulin, Prolamin, and Glutelin) Content Revealed by Genome-Wide Association Analysis

Pingli Chen et al. Front Plant Sci. .

Abstract

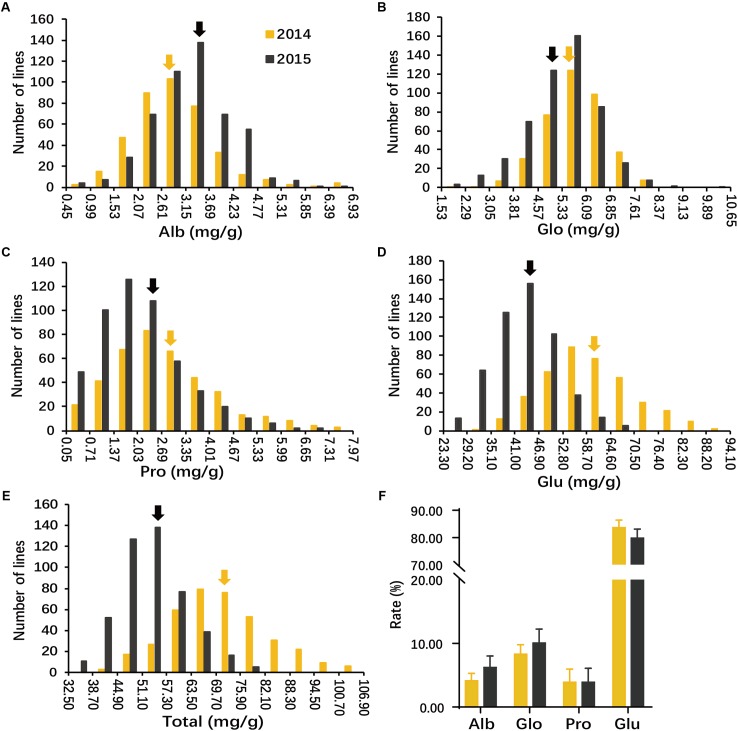
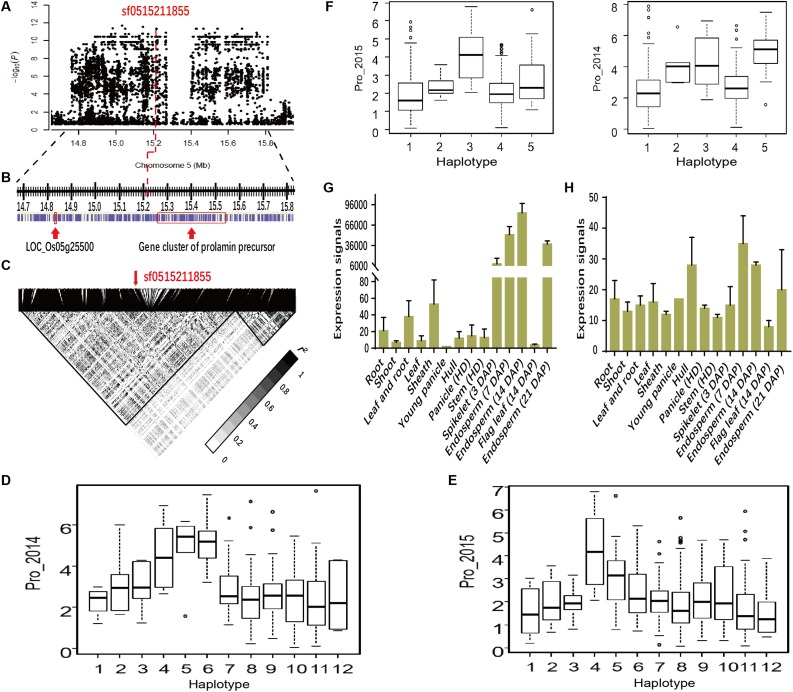
Rice seed storage protein (SSP) is an important source of nutrition and energy. Understanding the genetic basis of SSP content and mining favorable alleles that control it will be helpful for breeding new improved cultivars. An association analysis for SSP content was performed to identify underlying genes using 527 diverse Oryza sativa accessions grown in two environments. We identified more than 107 associations for five different traits, including the contents of albumin (Alb), globulin (Glo), prolamin (Pro), glutelin (Glu), and total SSP (Total). A total of 28 associations were located at previously reported QTLs or intervals. A lead SNP sf0709447538, associated for Glu content in the indica subpopulation in 2015, was further validated in near isogenic lines NIL(Zhenshan97) and NIL(Delong208), and the Glu phenotype had significantly difference between two NILs. The association region could be target for map-based cloning of the candidate genes. There were 13 associations in regions close to grain-quality-related genes; five lead single nucleotide polymorphisms (SNPs) were located less than 20 kb upstream from grain-quality-related genes (PG5a, Wx, AGPS2a, RP6, and, RM1). Several starch-metabolism-related genes (AGPS2a, OsACS6, PUL, GBSSII, and ISA2) were also associated with SSP content. We identified favorable alleles of functional candidate genes, such as RP6, RM1, Wx, and other four candidate genes by haplotype analysis and expression pattern. Genotypes of RP6 and RM1 with higher Pro were not identified in japonica and exhibited much higher expression levels in indica group. The lead SNP sf0601764762, repeatedly detected for Alb content in 2 years in the whole association population, was located in the Wx locus that controls the synthesis of amylose. And Alb content was significantly and negatively correlated with amylose content and the level of 2.3 kb Wx pre-mRNA examined in this study. The associations or candidate genes identified would provide new insights into the genetic basis of SSP content that will help in developing rice cultivars with improved grain nutritional quality through marker-assisted breeding.

Keywords: GWAS; Oryza sativa L.; endosperm; grain quality; nutrition; storage protein.


Figures

FIGURE 1
FIGURE 1
Phenotypic distribution of seed storage proteins (SSPs) of milled rice in the whole population. Histograms show the distributions of albumin (Alb) (A), globulin (Glo) (B), prolamin (Pro) (C), glutelin (Glu) (D), and Total SSP (E) of milled rice measured in two environments (2014 and 2015). Arrowheads indicate mean values. (F) Proportions of individual components in total protein in 2014 and 2015 across all accessions. y-axis ‘Proportion’. Error bars, SE of replicates.
FIGURE 2
FIGURE 2
Genome-wide P-values and quantile-quantile plots from linear mixed model (LMM) model for Glo (A,B), Glu (C,D), and Total SSP (E,F) in 2 years across all accessions. The x-axis depicts the physical locations of single nucleotide polymorphisms (SNPs) across the 12 rice chromosomes and the y-axis is the –log10 (P-value). Lead SNPs in significant peaks are red. The horizontal dotted line indicated the genome-wide significance threshold (P = 5.0E-06). Total, total SSP content.
FIGURE 3
FIGURE 3
Genome-wide association study (GWAS) for Glu in 2015 and Validation of GWAS Signals by genetic materials for the chromosome 7 peak. Manhattan plots of LMM for Pro in the all accessions in 2015 (A). (B) Local Manhattan plot surrounding the peak in 2015 on chromosome 7. Arrow indicates the position of the lead peak. The corresponding colors of r2 represent linkage disequilibrium levels. (C) Plant architectures of near-isogenic lines. (D) Phenotypes of Glu of two parents ZS97, DL208, NIL(ZS97), and NIL(DL208). ∗∗Indicates the differences of Glu between two materials are significant at P < 0.01.
FIGURE 4
FIGURE 4
Genome-wide association study for Pro in two environments and identification of the causal gene for the chromosome 7 peak. Manhattan plots of LMM for Pro in the all accessions in 2014 (A) and in 2015 (B). Arrowheads indicate the positions of strong peaks investigated in this study. (C) Local Manhattan plot surrounding the peak in 2015 on chromosome 7. Arrow indicates the position of the lead peak. The corresponding colors of r2 represent linkage disequilibrium levels. The panel shows a 50 kb region on each side of the peak SNP, with annotated genes indicated by purple boxes. Previously identified genes (RP6 and RM1) controlling prolamin content are labeled. The distribution of Pro values in 2014 (Left) and 2015 (Right) in the three haplotypes of RP6 (D) and RM1 (F). Expression signals of RP6 (E) and RM1 (G) in various tissues of ZS97 based on the microarray data. The y-axis represents the expression signals. (H) Representation of pairwise r2 values among polymorphic sites in RP6 and RM1. The lines in red represent lead SNP. Expression levels of RP6 (I) and RM1 (J) in the endosperm at 7 days after pollination in indica group. Error bars, SE of 3 replicates. ∗∗Indicates the differences of expression levels between two haplotypes are significant at P < 0.01. Hap, haplotype; HD, heading date; DAP, day after pollination.
FIGURE 5
FIGURE 5
Genome-wide association study for Alb in two environments and identification of the causal gene for the peak on chromosome 6. Manhattan plots of LMM for Alb for all accessions in 2014 (A) and 2015 (B). Arrows indicate the position of the lead peak. (C) Local Manhattan plot surrounding the peak in 2015 on chromosome 6. (D) Schematic of Wx structure (Top) and linkage disequilibrium (measured as pairwise r2 values) between the lead SNP sf0601764762 and some polymorphic sites in Wx (Bottom). The distribution of Alb values in 2014 (E) and 2015 (F) in the eight haplotypes of Wx. Quantity of 2.3 kb (G) and 3.3 kb (H) Wx in indica and japonica groups among four haplotypes in the endosperm at 7 days after pollination. (I) Quantity of 2.3 kb Wx RNA in various tissues of ZS97 and Minghui 63 based on the public microarray data. The y-axis represents the expression signals. (J) Comparison of the quantity of 2.3 and 3.3 kb Wx RNA between Zhonghua 11 and ZS97 with different genotypes by Real-time PCR. Error bars, SE of three replicates. Letters above the bars are ranked by Duncan test at P < 0.05; different letters next to SE bars indicate significant difference. Hap, haplotype; HD, heading date; DAP, day after pollination.
FIGURE 6
FIGURE 6
Regions of the genome showing association signals and the expression profiles of candidate genes. (A) An associated locus from MLM for Pro in 2015 in 14.6–16.0 Mb on chromosome 5. Arrow indicates the position of the lead SNP sf0515211855. (B) The panel shows a region with the candidate genes indicated by arrows. (C) LD heatmap surrounding the peak between 14.6–16.0 Mb on chromosome 5. The distribution of Pro values in 2014 (D) and 2015 (E) in the twelve haplotypes of the candidate gene (PROLM1). (F) The distribution of Pro values in 2014 (Left) and 2015 (Right) in the five haplotypes of the candidate gene (LOC_Os05g25500). Expression signals of PROLM1 (G) and LOC_Os05g25500 (H) in various tissues of ZS97 based on the public microarray data. The y-axis represents the expression signals. HD, heading date; DAP, day after pollination.
FIGURE 7
FIGURE 7
Haplotype analyses and expression profiles of candidate genes. The distribution of Glo values in 2015 in indica group in the six haplotypes of the candidate gene (LOC_Os03g29750) (A) and Glu values in 2014 in all group in the six haplotypes of the candidate gene (LOC_Os02g13130) (B). Expression signals of LOC_Os03g29750 (C) and LOC_Os02g13130 (D) in various tissues of ZS97 based on the public microarray data. The y-axis represents the expression signals. HD, heading date; DAP, day after pollination.

References

    1. Adachi T., Izumi H., Yamada T., Tanaka K., Takeuchi S., Nakamura R., et al. (1993). Gene structure and expression of rice seed allergenic proteins belonging to the alpha-amylase/trypsin inhibitor family. 21 239–248. 10.1007/BF00019940 - DOI - PubMed
    1. Akihiro T., Mizuno K., Fujimura T. (2005). Gene expression of ADP-glucose pyrophosphorylase and starch contents in rice cultured cells are cooperatively regulated by sucrose and ABA. 46 937–946. 10.1093/pcp/pci101 - DOI - PubMed
    1. Aluko G., Martinez C., Tohme J., Castano C., Bergman C., Oard J. H. (2004). QTL mapping of grain quality traits from the interspecific cross Oryza sativa x O. glaberrima. 109 630–639. 10.1007/s00122-004-1668-y - DOI - PubMed
    1. Bhullar N. K., Gruissem W. (2013). Nutritional enhancement of rice for human health: the contribution of biotechnology. 31 50–57. 10.1016/j.biotechadv.2012.02.001 - DOI - PubMed
    1. Borba T. C. D. O., Brondani R. P. V., Breseghello F., Coelho A. S. G., Mendonça J. A., Rangel P. H. N., et al. (2010). Association mapping for yield and grain quality traits in rice (Oryza sativa L.). 33 515–524. 10.1590/S1415-47572010005000065 - DOI - PMC - PubMed

LinkOut - more resources