

Sensory and cross-network contributions to response inhibition in patients with schizophrenia
- PMID: 29868440
- PMCID: PMC5984577
- DOI: 10.1016/j.nicl.2018.01.001
Sensory and cross-network contributions to response inhibition in patients with schizophrenia
Abstract
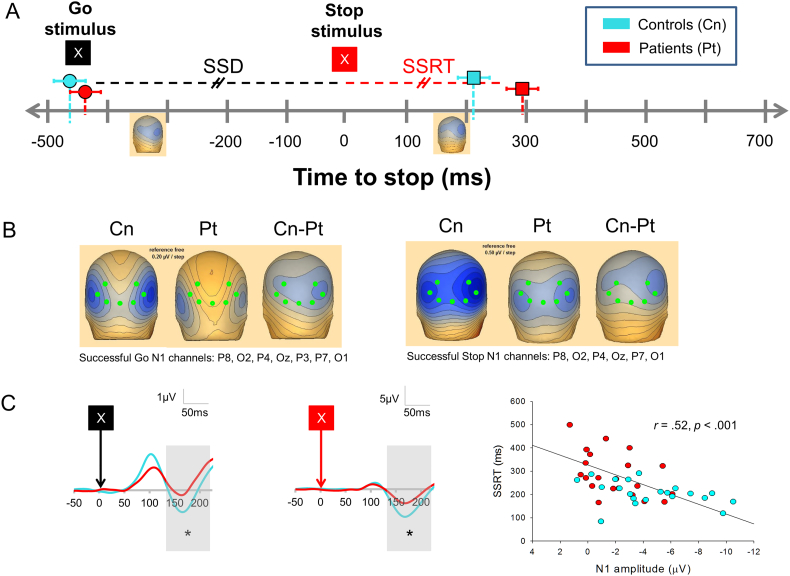
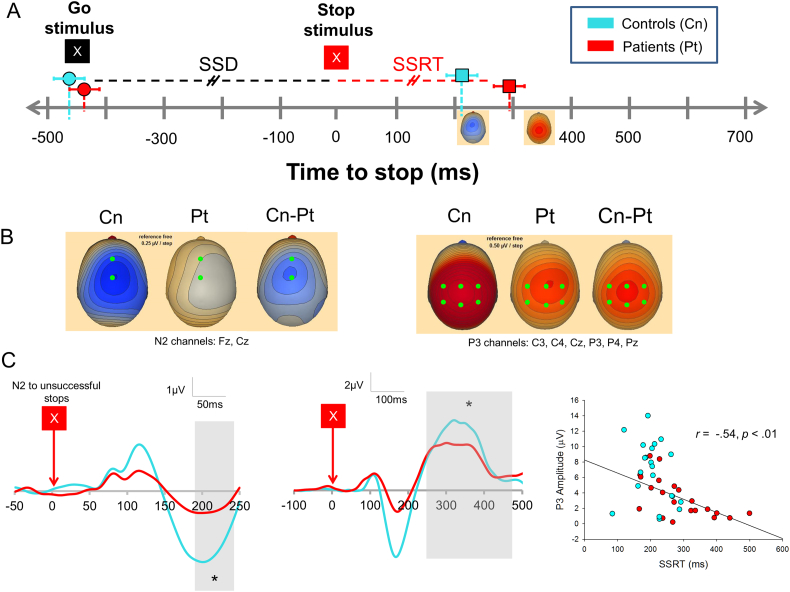
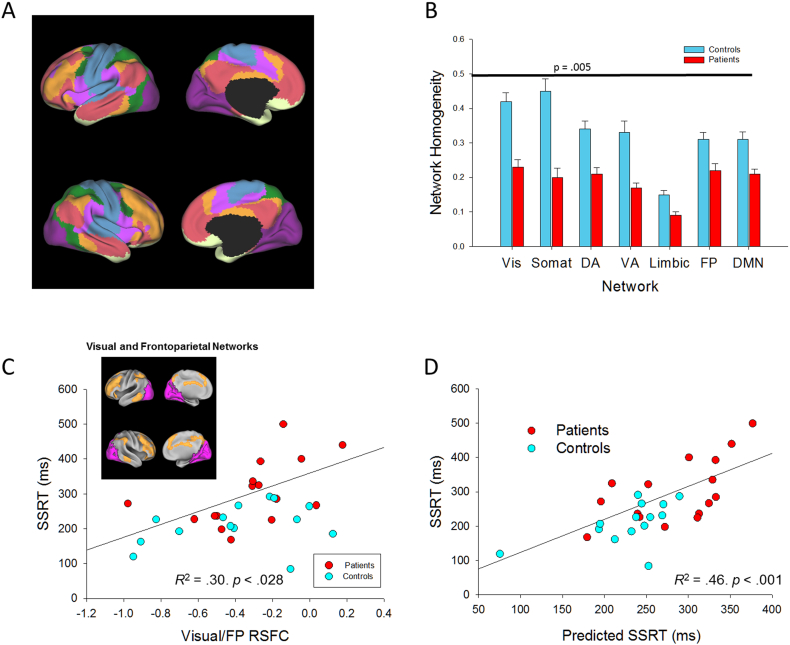
Patients with schizophrenia show response inhibition deficits equal to or greater than those seen in impulse-control disorders, and these deficits contribute to poor outcome. However, little is known about the circuit abnormalities underlying this impairment. To address this, we examined stop signal task performance in 21 patients with schizophrenia and 21 healthy controls using event related potential (ERP) and resting state functional connectivity. Patients showed prolonged stop signal reaction time (SSRT) and reduced N1, N2, and P3 amplitudes compared to controls. Across groups, P3 amplitudes were maximal after SSRT (i.e., after the time associated with the decision to stop occurred), suggesting that this component indexed response monitoring. Multiple regression analyses showed that longer SSRTs were independently related to 1) patient status, 2) reduced N1 amplitude on successful stop trials and 3) reduced anticorrelated resting state functional connectivity between visual and frontoparietal cortical networks. This study used a combined multimodal imaging approach to better understand the network abnormalities that underlie response inhibition in schizophrenia. It is the first of its kind to specifically assess the brain's resting state functional architecture in combination with behavioral and ERP methods to investigate response inhibition in schizophrenia.
Keywords: EEG; Impulsivity; Resting state functional connectivity; Schizophrenia; Stop signal task.
Figures
Similar articles
-
Stop-signal response inhibition in schizophrenia: behavioural, event-related potential and functional neuroimaging data.Biol Psychol. 2012 Jan;89(1):220-31. doi: 10.1016/j.biopsycho.2011.10.013. Epub 2011 Oct 24. Biol Psychol. 2012. PMID: 22027085
-
Connectivity and local activity within the fronto-posterior brain network in schizophrenia.Suppl Clin Neurophysiol. 2013;62:181-96. doi: 10.1016/b978-0-7020-5307-8.00012-0. Suppl Clin Neurophysiol. 2013. PMID: 24053040
-
Investigating inhibition deficit in schizophrenia using task-modulated brain networks.Brain Struct Funct. 2020 Jun;225(5):1601-1613. doi: 10.1007/s00429-020-02078-7. Epub 2020 Apr 30. Brain Struct Funct. 2020. PMID: 32356019
-
Failures of cognitive control or attention? The case of stop-signal deficits in schizophrenia.Atten Percept Psychophys. 2017 May;79(4):1078-1086. doi: 10.3758/s13414-017-1287-8. Atten Percept Psychophys. 2017. PMID: 28185228 Free PMC article. Review.
-
Cognitive dysfunction in schizophrenia: unifying basic research and clinical aspects.Eur Arch Psychiatry Clin Neurosci. 1999;249 Suppl 4(Suppl 4):69-82. doi: 10.1007/pl00014188. Eur Arch Psychiatry Clin Neurosci. 1999. PMID: 10654112 Free PMC article. Review.
Cited by
-
People with high schizotypy experience more illusions in the Pattern Glare Test: Consistent with the hyperexcitability hypothesis.Eur J Neurosci. 2023 Jan;57(2):388-399. doi: 10.1111/ejn.15886. Epub 2022 Dec 21. Eur J Neurosci. 2023. PMID: 36484768 Free PMC article.
-
Shared Response Inhibition Deficits but Distinct Error Processing Capacities Between Schizophrenia and Obsessive-Compulsive Disorder Patients Revealed by Event-Related Potentials and Oscillations During a Stop Signal Task.Front Psychiatry. 2019 Nov 19;10:853. doi: 10.3389/fpsyt.2019.00853. eCollection 2019. Front Psychiatry. 2019. PMID: 31798483 Free PMC article.
-
Relationships between Diffusion Tensor Imaging and Resting State Functional Connectivity in Patients with Schizophrenia and Healthy Controls: A Preliminary Study.Brain Sci. 2022 Jan 25;12(2):156. doi: 10.3390/brainsci12020156. Brain Sci. 2022. PMID: 35203920 Free PMC article.
-
The contributions of neonatal inhalation of copper to air pollution-induced neurodevelopmental outcomes in mice.Neurotoxicology. 2024 Jan;100:55-71. doi: 10.1016/j.neuro.2023.12.007. Epub 2023 Dec 9. Neurotoxicology. 2024. PMID: 38081392 Free PMC article.
-
Biomarkers for Cognitive Control, Response Inhibition, Aggressivity, Impulsivity, and Violence.Adv Neurobiol. 2024;40:725-756. doi: 10.1007/978-3-031-69491-2_24. Adv Neurobiol. 2024. PMID: 39562462 Review.
References
-
- Ardekani B.A., Nierenberg J., Hoptman M.J., Javitt D.C., Lim K.O. MRI study of white matter diffusion anisotropy in schizophrenia. Neuroreport. 2003;14:2025–2029. - PubMed
-
- Aron A.R., Robbins T.W., Poldrack R.A. Inhibition and the right inferior frontal cortex: one decade on. Trends Cogn. Sci. 2014;18:177–185. - PubMed
-
- Biswal B., Zerrin Yetkin F., Haughton V.M., Hyde J.S. Functional connectivity in the motor cortex of resting human brain using echo-planar mri. Magn. Reson. Med. 1995;34:537–541. - PubMed
Publication types
MeSH terms
Grants and funding
LinkOut - more resources
Full Text Sources
Other Literature Sources
Medical
