

Geographic Variation in Heart Failure Mortality and Its Association With Hypertension, Diabetes, and Behavioral-Related Risk Factors in 1,723 Counties of the United States
- PMID: 29868540
- PMCID: PMC5950547
- DOI: 10.3389/fpubh.2018.00132
Geographic Variation in Heart Failure Mortality and Its Association With Hypertension, Diabetes, and Behavioral-Related Risk Factors in 1,723 Counties of the United States
Abstract
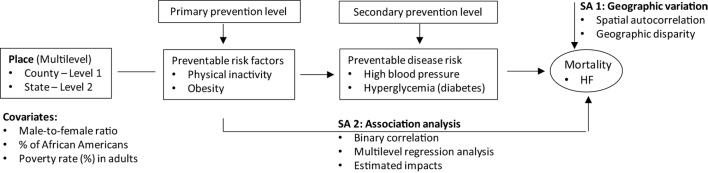
Background and objectives: Studies that examined geographic variation in heart failure (HF) and its association with risk factors at county and state levels were limited. This study aimed to test a hypothesis that HF mortality is disproportionately distributed across the United States, and this variation is significantly associated with the county- and state-level prevalence of high blood pressure (HBP), diabetes, obesity and physical inactivity.
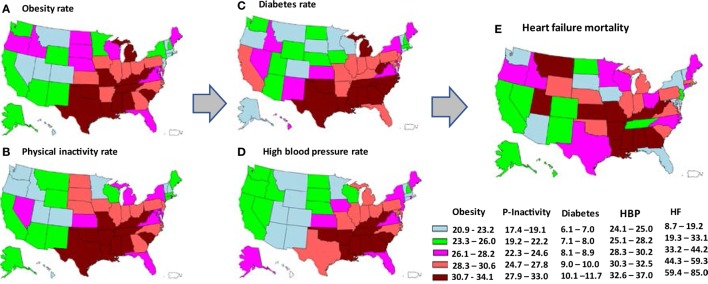
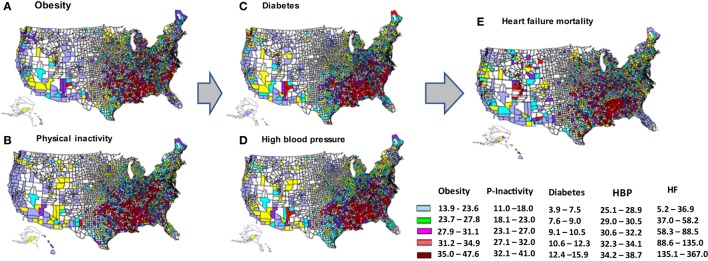
Methods: Data from 1,723 counties in 51 states (including District of Columbia as a state) on the age-adjusted prevalence of obesity, physical inactivity, HBP and diabetes in 2010, and age-adjusted HF mortality in 2013-2015 are examined. Geographic variations in risk factors and HF mortality are analyzed using spatial autocorrelation analysis and mapped using Geographic Information System techniques. The associations between county-level HF mortality and risk factors (level 1) are examined using multilevel hierarchical regression models, taking into consideration of their variations accounted for by states (level 2).
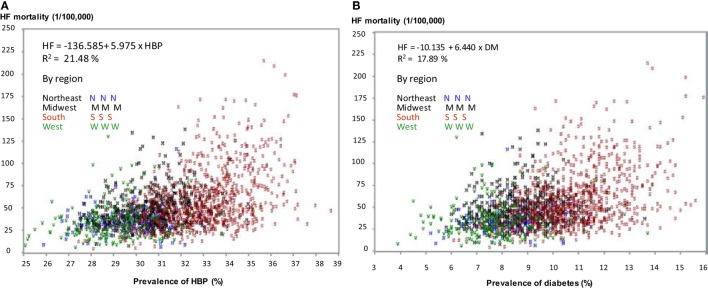
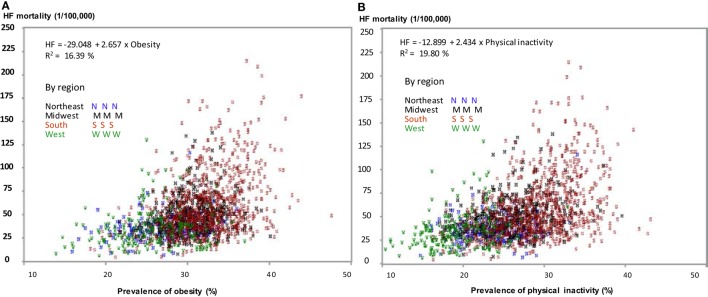
Results: There are significant variations in HF mortality, ranging from the lowest 11.7 (the state of Vermont) to highest 85.0 (Mississippi) per 100,000 population among the 51 states. Age-adjusted prevalence of obesity, physical inactivity, HBP, and diabetes are positively and significantly associated with HF mortality. Multilevel analysis indicates that county-level HF mortality rates remain significantly associated with diabetes (β = 2.7, 95% CI: 1.7-3.7, p < 0.0001), HBP (β = 3.6, 2.1-5.0, p < 0.0001), obesity (β = 0.9, 0.6-1.3, p < 0.0001), and physical inactivity (β = 1.2, 0.8-1.5, p < 0.0001) after controlling for gender, race/ethnicity, and poverty index. After further controlling obesity and physical inactivity in diabetes and HBP models, the effects of diabetes (β = 1.0, -0.3 to 2.3, p = 0.12) and HBP (β = 2.4, 0.9-3.9, p = 0.003) on HF mortality had a considerable reduction.
Conclusion: HF mortality disproportionately affects the counties and states across the nation. The geographic variations in HF morality are significantly explained by the variations in the prevalence of obesity, physical inactivity, diabetes, and HBP.
Keywords: United States; heart failure; mapping; mortality; risk factors.
Figures
References
-
- Jessup M, Abraham WT, Casey DE, Feldman AM, Francis GS, Ganiats TG, et al. 2009 Focused update: ACCF/AHA guidelines for the diagnosis and management of heart failure in adults: a report of the American College of Cardiology Foundation/American Heart Association Task Force on Practice Guidelines: developed in collaboration with the international society for heart and lung transplantation. Circulation (2009) 119(14):1977–2016.10.1161/CIRCULATIONAHA.109.192064 - DOI - PubMed
-
- Liu L. Heart Failure: Epidemiology and Research Methods. St. Louis, MO: Elsevier Health Sciences; (2017).
LinkOut - more resources
Full Text Sources
Other Literature Sources
Research Materials
Miscellaneous